
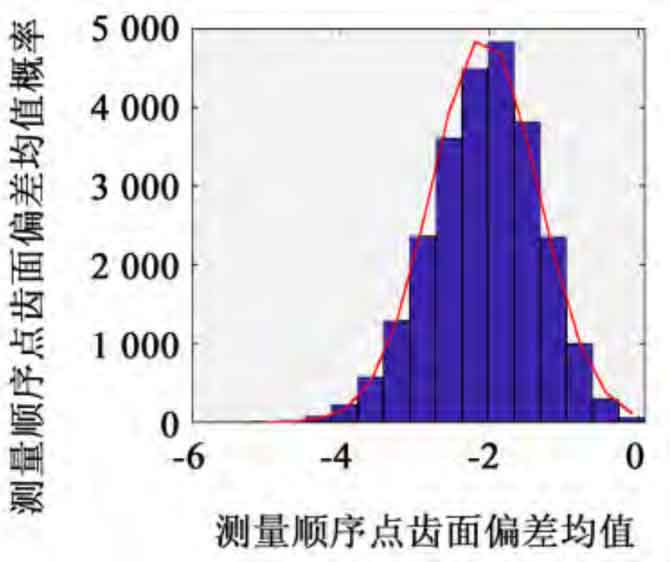
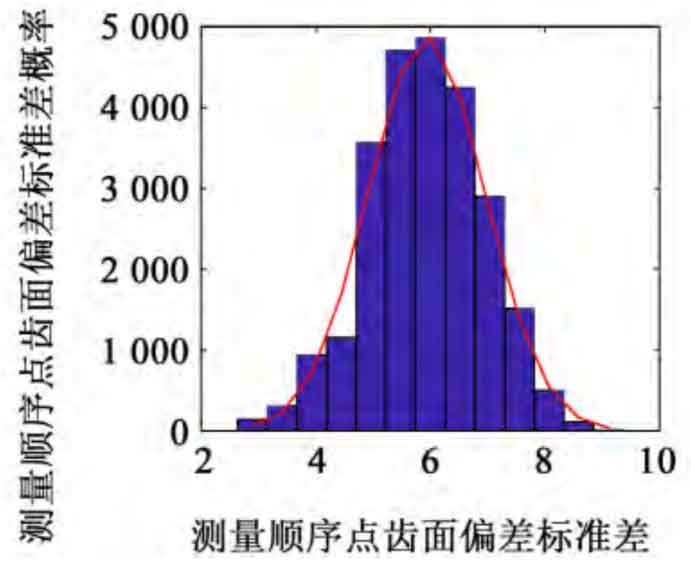
The same batch of spiral bevel gears with the same spiral bevel gear material, CNC milling method and heat treatment specification are taken as the research object, and the measurement results of the same tooth surface measurement point after heat treatment are randomly selected as the original data. Sampling is conducted according to the self-service sampling principle to obtain the sample probability eigenvalue. Take the number of original sample data 20 as an example, resample the original sample according to the self-service sampling principle, and take 25000 groups of self-service samples. The probability eigenvalues of each group of samples are calculated in turn, that is, the mean and standard deviation of self-service samples. The k-s test method is used to test the eigenvalues of self-service samples. The histograms are shown in Figure 1 and Figure 2 respectively. The eigenvalue results approximately follow the normal distribution. Therefore, the estimated true value of the self-service sample eigenvalue can be represented by the average value.
According to the calculation method of mean value and standard deviation of measuring point error of spiral bevel gear tooth surface with formula self-service method, different self-service sample mean value and self-service sample standard deviation can be obtained by calculating the original samples with different quantities of elements. Solve that the eigenvalue of self-service samples is 1 at the confidence level- α The result shows a probability that the true value of the self-service sample eigenvalue falls in the self-service sample data, and also indicates the credibility of the self-service sample eigenvalue. The confidence interval is shown in Table 1.
| Number of sample elements | Original sample parameters(σ) | Original sample parameters(δ) | Sample parameters of self-service method(σ1) | Sample parameters of self-service method(δ1) | 95% confidence interval of mean value | 95% confidence interval of variance |
| 10 | -1. 610 0 | 3.769 3 | -1. 599 4 | 3.579 8 | (-1. 609 3,-1. 589 4) | (3. 572 8,3. 586 9) |
| 15 | -0. 713 3 | 3.516 1 | -0. 717 2 | 3.397 2 | (-0. 716 6,-0. 701 3) | (3. 394 3,3. 406 5) |
| 20 | -0. 905 0 | 3.274 4 | -0. 908 2 | 3.190 8 | (-0. 913 3,-0. 903 1) | (3. 187 2,3. 194 4) |
| 25 | 0.420 0 | 4.010 0 | 0.421 0 | 3.926 9 | (-0. 415 4,-0. 426 6) | (3. 922 9,3. 930 9) |
| 30 | 0.856 7 | 3.824 7 | 0.858 0 | 3.761 0 | (0. 852 6,0. 863 3) | (3. 757 2,3. 764 8) |
| 35 | 0.502 9 | 4.007 2 | 0.503 0 | 3.949 3 | (0. 498 2,0. 507 8) | (3. 946 0,3. 952 7) |
Table 2 shows the relative error table of probability eigenvalue of different sample elements. It can be seen from Table 2 that when the number of elements in the original sample is 10, the relative error between the mean value of self-service sample and the mean value of the original sample is 0.66%; With the increasing number of elements in the original sample, the relative error of the mean value decreases significantly; When the number of sample elements reaches 35, their values are almost the same. Similarly, the relative error of sample variance is also gradually decreasing. It can be seen from this that, with the gradual increase of the number of elements in the original sample, the relative error between the self-help sample generated by the self-help method and the original sample can be significantly reduced, which fully demonstrates that the self-help method can also obtain effective computing results only under the condition of small samples.
| Number of sample elements | Mean value of original sample | Self service sample mean | Relative error | Original sample variance | Self service sample variance | Relative error |
| 10 | -1. 610 0 | -1. 599 4 | 0.66% | 3.769 3 | 3.579 8 | 5.03% |
| 15 | -0. 713 3 | -0. 717 2 | 0.55% | 3.516 1 | 3.397 2 | 3.38% |
| 20 | -0. 905 0 | -0. 908 2 | 0.35% | 3.274 4 | 3.190 8 | 2.64% |
| 25 | 0.420 0 | 0.421 0 | 0.24% | 4.010 0 | 3.926 9 | 2.10% |
| 30 | 0.856 7 | 0.858 0 | 0.15% | 3.824 7 | 3.761 0 | 1.66% |
| 35 | 0.502 9 | 0.503 0 | 0.019% | 4.007 2 | 3.949 3 | 1.44% |