
| Fx | Fy | Fz | |
| Root mean square value of prediction error | 58.2 N(11.2%) | 60.4 N(11.6%) | 108.7 N(4.6%) |
| Standard deviation of prediction error | 63.9 N(12.3%) | 64.1 N(12.8%) | 129.9 N(5.5%) |
In the hobbing process of straight cylindrical gears, the Z axis of WCS mainly coincides with the tangential cutting direction, capturing the most important force component. The lateral X/Y axis reflects the effects of local feed and radial cutting forces. When establishing the simulation, the Kienzle model is used to update the local cutting force coefficients (Ktc, Kfc, Krc) on the meshing nodes independently based on the front angle and inclination angle of the meshing nodes. Under the process parameters shown in Table 1, the cutting force prediction and measurement results of the sample are shown in the figure.
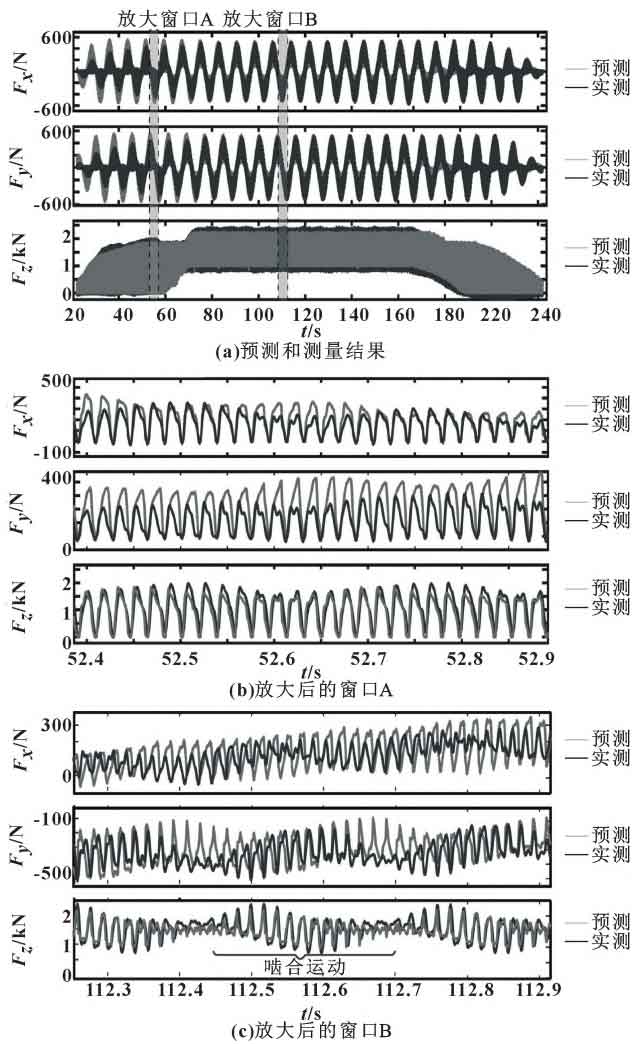
It can be seen from the figure that the minimum/maximum envelope of the hob, the impact of the cut in and out strokes, and the meshing motion are all well captured. By subtracting the measured cutting force from the simulated cutting force one by one sample, the root mean square value and standard deviation of the force prediction error during the entire process are calculated. In addition, the error values were compared with the peak cutting forces in three corresponding directions (X: 520N, Y: 521N, Z: 2363N) (%). Generally, in machining process planning, an accuracy of 4% to 12% (root mean square and standard deviation) is considered reasonable. The prediction error of cutting force is shown in Table 2.
| Cutting speed/(m · min ^ – 1) | Cutting depth/mm | Feed rate/(mm · r ^ – 1) | |
| Test 1 | 55 | 7.143 | 3.0 |
| Test 2 | 55 | 7.143 | 1.8 |
| Test 3 | 55 | 7.143 | 1.2 |
| Test 4 | 30 | 6.734 | 3.0 |