
1. Experimental setup
In order to verify the overall effectiveness of the image recognition method for grinding cracks in automotive gears using machine vision under multiple optical paths affected by optical properties, the hardware CPU was 64 GHz and the memory was 128 GB in the corresponding test environment. At the same time, in order to reduce the impact of the application system on the experimental results, MatlabR 2019 b is used to simulate and compare the experimental results in an environment with a dominant frequency of 1.
On the basis of the above, the proposed methods are used to compare and analyze the recognition fault tolerance, recognition efficiency, and recognition time of automotive gear grinding crack images using the multi optical path image recognition method, the noisy automotive gear image edge detection method combined with image enhancement, and the tooth profile image edge distortion compensation algorithm based on SVR.
2. Experimental results
2.1 Identification fault tolerance analysis
Fault tolerance refers to the degree of error that can be tolerated during image recognition of grinding cracks in automotive gears. The stronger the fault tolerance, the better the effectiveness of the method. The determination of the degree of fault tolerance requires the use of an accuracy calculation formula to obtain the fault tolerance rate by obtaining the recognition accuracy rate. The higher the fault tolerance rate, the smaller the impact on the recognition effect, and the stronger the fault tolerance. In order to measure the fault-tolerance of different methods, 600 images of grinding cracks in automotive gears were collected as experimental data, and the experimental data were identified using the proposed methods to obtain the final recognition accuracy. After the acquisition of the first recognition accuracy rate is completed, continue to add data failure signals based on the experimental data, and continue to perform the second recognition to obtain the second recognition accuracy rate. Through the calculation of the two recognition rates, the degree of fault tolerance can be obtained. Calculate the fault tolerance ratio of the two accuracy rates of the three methods based on the relative attenuation algorithm. The expression of the relative attenuation algorithm is as follows:
Where: Aoriginal is the accuracy rate of the original data; ρ Is the relative attenuation coefficient; Bnoise is the value range of fault tolerance rate. The comparison results of fault tolerance rates of various methods are shown in the table.
| Method | First recognition accuracy | Second recognition accuracy | Fault tolerance rate |
| Proposed method | 95.6% | 96.8% | 97.3% |
| Literature [4] Method | 94.3% | 94.9% | 95.7% |
| Literature [5] Method | 95.4% | 96.1% | 96.8% |
As can be seen from the table, the fault tolerance rate of the proposed method is 97.3%, the fault tolerance rate of the method is 95.7%, and the fault tolerance rate of the method is 96.8%, indicating that the recognition fault tolerance of the three methods has a good degree. Due to the fact that the method in this paper uses 3D visual sensors to segment pixel thresholds of automotive gears, it improves the accuracy of image recognition of automotive gear grinding cracks to a certain extent. Therefore, the proposed method can reduce data redundancy and achieve higher fault tolerance results than the other two methods.
2.2 Identification effect analysis
After preprocessing 600 collected images of grinding cracks in automotive gears, randomly select 3 images, and use the proposed algorithm to identify and distinguish the same grinding cracks in each image. The more grinding cracks identified for automotive gears, the better the recognition effect, as shown in Figure 1.
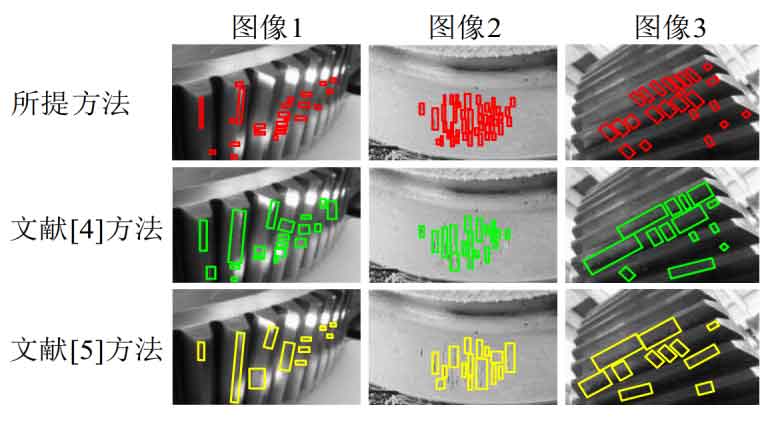
As can be seen from Figure 1, the proposed method can accurately identify grinding crack images of automotive gears, and more grinding cracks are identified. This is because the proposed method uses particle swarm optimization algorithm to obtain the feature vector weight of the automotive gear grinding crack image, establish a feature classification matrix, and accurately identify the automotive gear grinding crack image in the process of identifying the automotive gear grinding crack image, which proves the superiority of the proposed method.
2.3 Identification time analysis
The collected 600 images of grinding cracks in automotive gears are used as test data. The image recognition time for grinding cracks in automotive gears is shown in Figure 2.
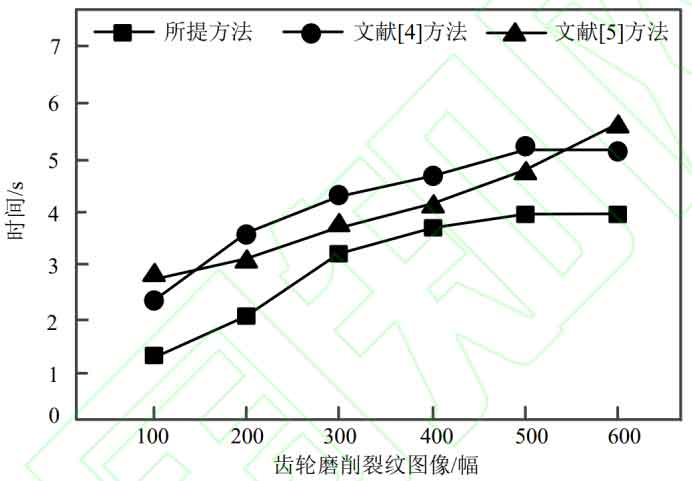
As can be seen from Figure 2, the proposed method uses machine vision to collect and preprocess noisy data, enabling noisy data to be filtered and denoised. Gaussian filtering stored by low-frequency filters in two-dimensional space is used to eliminate high-frequency noise signals, obtaining optimized noiseless data, thereby improving the recognition effect of automotive gear grinding crack images. Therefore, the recognition time of automotive gear grinding crack images is relatively short, Using only 4s can effectively identify 600 different automotive gear grinding crack images, with a significantly higher efficiency than the other two methods, and has strong applicability.