
Cylindrical gears are widely used in various industries, such as aerospace, rail transit, automotive, agriculture, mining, and many others. The fatigue failure of gears can have serious consequences in practical engineering applications. Therefore, it is of great significance to establish a bending fatigue life prediction model for cylindrical gears that has a wide range of applications and is easy to calculate.
In recent years, many scholars at home and abroad have proposed various gear damage accumulation models and life prediction methods. For example, Xue Qiwen et al. established an improved nonlinear fatigue life prediction model by introducing the energy criterion and determining the damage parameters, and using the load cycle ratio and real-time fatigue damage to modify the interaction factor. Li Ming et al. established a probabilistic life prediction model for gears based on the concept of the minimum order statistic. Lin Xiaoyan et al. established a residual strength prediction model based on the characteristics of residual strength attenuation, which determines the unknown parameters from the stress-life curve. Gao Zhenkui et al. used the nominal stress method to predict the fatigue life of the rod, which is closer to the actual situation. Liu Yongping proposed a life prediction method for the gear transmission of a jaw crusher based on damage defects. Zhang Mouqing et al. discussed the prediction method of crack propagation life by studying the crack propagation path, direction, and speed at the tooth root. Lin et al. proposed a gear fatigue life prediction method based on the concept of power density. He et al. proposed a damage accumulation model based on the continuum damage approach, considering the effect of initial residual stress, for the gear pair in the wind turbine gearbox. Shen et al. calculated the gear contact fatigue life based on the nominal stress method and Miner’s cumulative damage theory, according to the modified material P-S-N curve. Patil et al. proposed a method for generating the crack propagation trajectory based on the three-dimensional boundary element method. Čular et al. proposed an analytical model for predicting the bending fatigue life of carburized gears based on the strain-life method. Vuckovic et al. proposed a computational model for predicting the bending fatigue failure of surface-hardened spur gears.
In summary, scholars have carried out a lot of research on the bending fatigue life prediction methods for cylindrical gears. Some research has also been conducted on the fatigue life prediction methods based on energy as the damage variable, but most of them take the standard cylindrical specimen as the research object, and the research on the bending fatigue life prediction of gears based on the energy theory needs to be further developed. Therefore, in this paper, through the gear bending fatigue test combined with the simulation results of the finite element model, the energy accumulation curve at the tooth root is obtained, and a bending fatigue life prediction model for cylindrical gears is proposed. The research results can provide a certain reference for further research on the gear bending fatigue life prediction based on the energy theory.
Gear Bending Fatigue Test
To study the bending fatigue life of gears, it is necessary to conduct bending fatigue tests on gears. Currently, the main methods for conducting gear bending fatigue tests are the running gear bending fatigue test and the non-running gear bending fatigue test. The running gear bending fatigue test is carried out by installing the gears on the testing machine, and the gears operate at the speed and load in the actual work. The non-running gear bending fatigue test can determine the bending fatigue life of the gears under static conditions, and simulate the meshing of the gear pair by applying a load on the gear teeth. Compared with the running test, this method has the advantages of low test consumption, low cost, short required time, simple operation, and high utilization rate.
Single Tooth Bending Fatigue Test
The test equipment is the PLG – 200 high-frequency bending fatigue testing machine. The gear parameters are shown in Table 1.
| Number of Teeth | Normal Module m/mm | Tooth Width/mm | Material |
|---|---|---|---|
| 5 | 10 | 18CrNiMo7 – 6 |
The literature takes the subway gear as the research object, which is similar to the gear specimen in this paper. The fatigue life of the gear specimen determined in this test is at the N = 10^7 level, and the fatigue limit of the gear specimen is 500.40 MPa. Most of the gear fatigue belongs to high-cycle fatigue . Considering the performance of the test equipment, this paper studies the fatigue life of the gear specimen with N ≤ 10^7.
Before the test, the surface of the gear specimen is polished, and the polished gear specimen is shown in Figure 1.
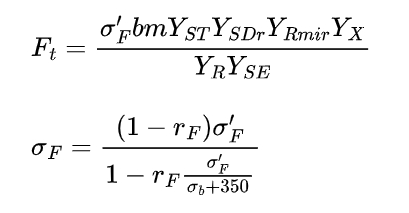
The tooth root stress of the test is selected as the level III tooth root stress determined in literature 15 – 27, which is 544.76 MPa. The loading load of the testing machine can be calculated according to Equations (1) and (2), namely:
where YFE is the tooth form coefficient; YSE is the test load stress correction coefficient; YδrelT is the relative tooth root fillet sensitivity coefficient; YRrelT is the relative tooth root surface condition coefficient; YX is the size coefficient for calculating the bending strength; YST is the stress correction coefficient of the gear; b is the tooth width; m is the gear module; σF is the pulsating cyclic tooth root stress when the cyclic characteristic coefficient is equal to zero; σ´F is the actual tooth root stress; rF is the cyclic characteristic coefficient; σb is the tensile strength of the gear material. The parameter values are shown in Table 2.
| Coefficient | Y5 | Yrx | Ya | YMeT | YA | Ysr |
|---|---|---|---|---|---|---|
| Value | 1.765 | 2.25 | 1 | 1.063 | 1 | 2 |
The loading frequency of the testing machine is about 150 Hz. When the vibration frequency drops by 8%, the test is paused, and the number of cycles at this time is recorded as the crack initiation life Ni. The crack along the gear end face and the crack along the tooth width direction are observed, and the crack length is measured by a handheld graduated microscope, which is recorded as ai and a* i, respectively.
The fatigue testing machine is set to displacement protection, and the test continues until the gear tooth breaks. At this stage, the crack expands slowly along the end face direction, and the crack along the tooth width direction expands rapidly. The number of cycles when the fracture occurs is recorded as the fatigue life N of the specimen. The extended life Ns during the crack propagation period is calculated by Equation (3).
The test is conducted in 3 groups, and the test data is shown in Table 3.
| Test | Initiation Life N/10^6 times | End Face Crack Length a/mm | Tooth Width Crack Length | Extended Life | |
|---|---|---|---|---|---|
| Number | a/mm | N/10^5 times | Fatigue Life N/10^5 times | ||
| 1 | 280.62 | 0.73 | 0.49 | 23.29 | 303.91 |
| 2 | 310.70 | 0.91 | 0.58 | 16.79 | 327.49 |
| 3 | 263.39 | 0.82 | 0.56 | 19.27 | 282.66 |
According to the test data, the initiation life of the specimen accounts for more than 92.33% of the fatigue life of the specimen; the extended life only accounts for a very small part of the fatigue life, less than 7.66%. When the frequency of the testing machine drops to 10% of the original frequency, visible cracks appear at the tooth root of the 3 groups of specimens, and the length of the cracks along the end face direction is greater than that along the tooth width direction, and the size of the cracks along the tooth root end face is less than 1 mm, and the length of the cracks along the tooth width direction is less than 0.6 mm.
Specimen Fracture Analysis
The gray-scale image of the fracture on the gear specimen is shown in Figure 2. It can be seen from the figure that in the red dotted line frame, the section is relatively smooth, and there are wavy patterns, which conform to the characteristics of the fatigue fracture initiation zone, and the width of this area is about 1.2 mm; in the yellow dotted line frame, the fracture surface is grainy and relatively rough, which conforms to the characteristics of the fatigue fracture instantaneous zone.
According to the literature [17], the fracture of the gear tooth is due to the tensile stress on one side of the loaded tooth root, which causes the initiation of the opening type crack at the tooth root and eventually leads to the fracture of the gear tooth.
Finite Element Analysis
To conform to the actual working conditions of the single tooth bending fatigue test, considering the balance between the calculation cost and the calculation accuracy, only the single tooth on the cylindrical gear is meshed to reduce the calculation scale. The number of meshes is 82,213, and the total number of nodes is 119,208, and the calculation is carried out using the tetrahedral volume integral element (C3D10). The static analysis of the single tooth finite element model is carried out, the single tooth model is fixed, and the loading area is consistent with the loading area of the single tooth bending fatigue test.
The stress distribution nephogram at the tooth root during the loading of the testing machine can be simulated by the single tooth static finite element analysis. The stress distribution nephogram at the tooth root is shown in Figure 3, and the stress distribution nephogram of the tooth root cross-section is shown in Figure 4.
The stress distribution nephogram at the tooth root with a pre-set crack (1×0.5) is shown in Figure 5, and the stress distribution nephogram of the cross-section of the pre-set crack tooth root is shown in Figure 6.
By comparing the stress distribution nephograms of the pre-set crack and the tooth root section through finite element analysis, it can be known that at the initial stage of crack propagation, the stress at the crack tip at the tooth root is relatively large, about twice the maximum stress at the tooth root surface.
The small crack (1×0.5) has little influence on the stress at the tooth root, and there is a large stress only in the crack tip area, and the stress value at the rest of the tooth root surface is very small compared with the finite element model without cracks.
The large crack (exceeding the above size) is affected by the cross-sectional area of the crack, which has a greater impact on the stress at the tooth root, and there are difficulties in calculating the energy, but the fatigue life corresponding to the large crack propagation stage is often less than 10%. Therefore, this paper only predicts the initiation life of the gear and takes this as the fatigue life of the gear.
The stress along the Z-axis direction of the gear end face is uniformly distributed, and the stress distribution along the X-axis direction changes. Therefore, when calculating the mean value of the stress amplitude in the energy accumulation area, the stress trend of different nodes inward along the X-axis direction of the gear end face is mainly studied.
By comparing with the results of the gear bending fatigue test, the position of the node with the largest principal stress in the static mechanics simulation of the Abaqus finite element software coincides with the position of the initial crack initiation in the bending fatigue test, which proves that the finite element simulation method can accurately calculate the stress field distribution of the gear 36 – 37.
Energy Accumulation Curve and Growth Rate Curve
Single-level Load Gear Bending Fatigue Test
According to previous studies, the tooth root stress corresponding to the fatigue life of 10^5 times for this type of gear is 639.60 MPa. In this paper, the bending fatigue test under single-level load is carried out on the gear within the high-cycle fatigue range to obtain the strain curve at the tooth root under different stress levels. The tests on the gear specimens are carried out at 5 tooth root stress levels. The stress levels and loading loads are shown in Table 4.
| Testing Machine Loading Load/kN | Stress Level/MPa |
|---|---|
| 79.18 | 510.00 |
| 84.12 | 541.25 |
| 89.08 | 572.50 |
| 94.04 | 603.75 |
| 99.02 | 635.00 |
Before the start of the test, the specimen is polished with sandpaper. According to the previous test, the strain gauge is pasted at a position as close as possible to the tooth profile surface on the crack propagation path, and the position of the strain gauge is shown in Figure 7. The strain gauge is a 1AA high-precision resistive strain gauge, and the size of the sensitive grid of the strain gauge is 3.6 mm x 3.9 mm. The strain gauge is connected to the signal acquisition instrument through enameled wire, and the acquisition instrument model is the MDR80 data acquisition instrument, and the acquisition frequency is 2000 Hz. The loading frequency of the testing machine is about 150 Hz. When the frequency of the testing machine drops to 92% of the original frequency, the test is stopped, and the number of cycles is recorded as the bending fatigue life of the specimen.
| Stress Level/MPa | Fatigue Life/10^5 times | Stress Level/MPa | Fatigue Life/10^5 times |
|---|---|---|---|
| 510.00 | 890.06 | 603.75 | 39.95 |
| 541.25 | 356.53 | 635.00 | 11.60 |
| 572.50 | 92.11 |
The collected strain signal is filtered and the peak is extracted. Under the tooth root stress level of 572.50 MPa, the strain-load cycle number curve at the tooth root.