
In recent years, electric vehicles have gained significant attention due to their advantages in terms of energy conservation and environmental protection. However, the transmission system and its components in electric vehicles often operate under dynamic loads of high frequency, strong impact, and long cycles, which can easily lead to contact fatigue failure of the transmission gears. Therefore, accurately calculating the dynamic load of high-speed helical gears in electric vehicles under actual working conditions and predicting their service life is of great significance for the design and reliability of electric vehicle transmission systems.
Introduction to Electric Vehicle Transmission Systems
Electric vehicles have some similarities with traditional fuel vehicles in terms of body structure, but there are significant differences in the structure and working environment of the power transmission system. The transmission system of electric vehicles usually omits the torque converter, clutch, and other torsional damping components, resulting in an underdamped system. Additionally, the transmission system adopts a multi-stage reduction and fewer gear positions, with a shorter power transmission path and a significant increase in the number of cycles.
The driving motor, as the power source of electric vehicles, has a torque dynamic response that is 100 times faster and a rotational speed that is 2 – 3 times higher than that of traditional internal combustion engines. Moreover, there are high-frequency fluctuations and strong impacts. During the operation of electric vehicles, the gear transmission system is affected by the torque from the motor and the driving conditions, resulting in a time-varying and random load on the gears. At the same time, impact loads often occur during the meshing process, making the force on the gears complex and significantly affecting the dynamic meshing process, which can lead to fatigue failure such as pitting and fracture.
Transmission System Structure and Transmission Loading Analysis
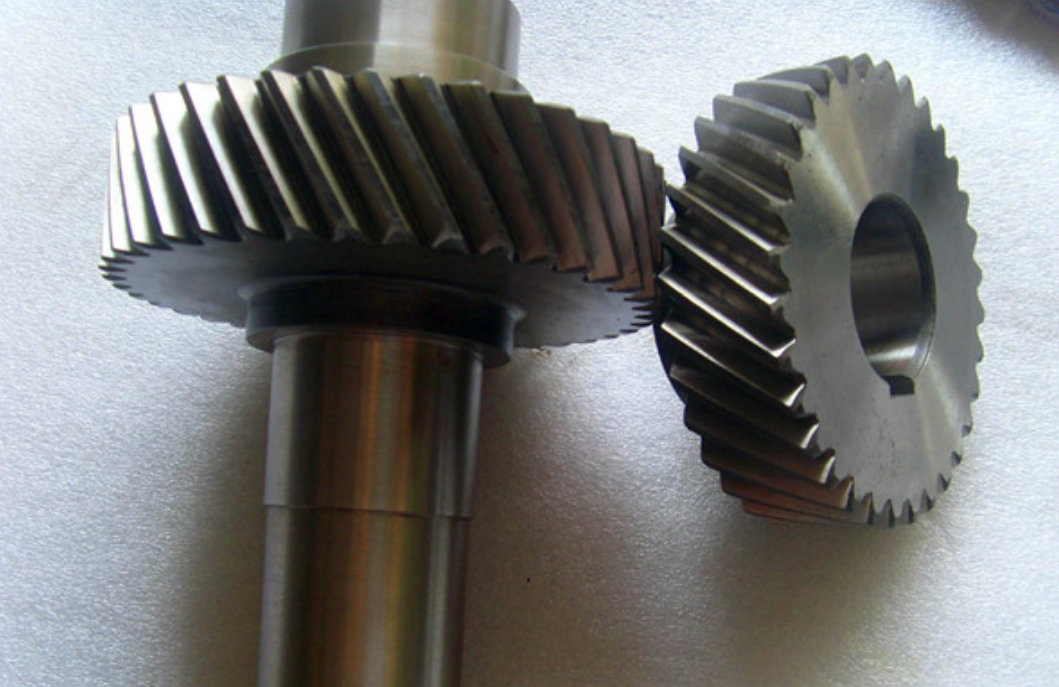
The basic structure of a fixed transmission ratio system for an electric vehicle is shown in Figure 1. The motor’s starting torque is large, enabling it to achieve a constant torque at low speeds and a constant power at high speeds, and easy to achieve stepless speed regulation.
During the driving of the car, the wheels are subjected to the torque transmitted by the driving motor, and the torque exerts a force on the ground. The ground, in turn, exerts a driving force Ft on the wheels. The relationship between the driving force and the input torque of the gearbox is given by Equation (1): Ft = Ttq * ig * i0 * ηT / r, where Ttq represents the input torque of the gearbox, ig represents the transmission ratio of the gearbox, i0 represents the transmission ratio of the main reducer, ηT represents the mechanical efficiency of the transmission system, and r represents the wheel radius.
The resistance encountered by the car during driving is divided into four parts: rolling resistance, air resistance, acceleration resistance, and gradient resistance, which constitute the driving resistance of the car, as shown in Equation (2): ∑F = Ff + Fw + Fi + Fj, where ∑F represents the sum of the driving resistance, Ff represents the rolling resistance, Fw represents the air resistance, Fi represents the gradient resistance, and Fj represents the acceleration resistance.
Therefore, the driving force Ft of the car is given by Equation (3): Ft = ∑F.
According to the car’s driving equation, the load torque TL on the rotor of the motor under the actual driving conditions of the electric vehicle can be calculated as follows: TL = ∑F * r / (ig * i0 * ηT), as shown in Equation (4).
Here is a summary table of the transmission system structure and loading analysis:
| Parameter | Equation | Description |
|---|---|---|
| Driving Force | Ft = Ttq * ig * i0 * ηT / r | Relationship between the driving force and the input torque of the gearbox |
| Driving Resistance | ∑F = Ff + Fw + Fi + Fj | Composition of the driving resistance |
| Load Torque on Motor Rotor | TL = ∑F * r / (ig * i0 * ηT) | Calculation of the load torque on the motor rotor based on the driving resistance |
Vehicle Motor Model and Simulation
Permanent Magnet Synchronous Motor (PMSM) is commonly used as the traction motor in electric vehicles due to its advantages such as small size, light weight, high efficiency, large electromagnetic torque, and strong overload capacity. The vector control is widely used in the PMSM drive system, which has the advantages of high motor efficiency, stable torque, wide speed regulation range, and good dynamic performance.
The parameters of the PMSM used in this article are shown in Table 1.
Table 1: Parameters of the Vehicle Permanent Magnet Synchronous Motor
| Parameter | Value | Parameter | Value |
|---|---|---|---|
| Rated Voltage Udc (V) | 300 | Stator Internal Resistance Rs (Ω) | 0.013 |
| Rated Power Pr (kW) | 24 | d-axis Inductance Ld (mH) | 0.27 |
| Maximum Speed nmax (r/min) | 7200 | q-axis Inductance Lq (mH) | 0.67 |
| Maximum Torque Tmax (N·m) | 118 | Permanent Magnet Flux Linkage ψf (wb) | 0.101 |
| Number of Pole Pairs Pn | 3 | Rotational Inertia J (Kg·m²) | 0.003 |
The vector control model of the PMSM is based on the mathematical model in the rotor rotating two-phase coordinate system d – q, and the voltage and torque equations are given by Equations (5) – (7):
ud = Rs * id + p * ψd – ωe * ψq
uq = Rs * iq + p * ψq + ωe * ψd
Te = 3/2 * pn * (ψd * id – ψq * iq)
The mechanical motion equation of the motor is: J * dωm / dt = Te – TL – B * ωm, where ωm represents the mechanical angular velocity of the motor, J represents the rotational inertia of the motor rotor and the load, Te represents the electromagnetic torque of the motor, TL represents the motor load torque, and B represents the damping coefficient.
The vector control algorithm is established based on the mathematical model of the PMSM. By controlling the id and iq current components, the torque Te can be controlled. In this article, the id = 0 control strategy is adopted to simplify the control.
The simulation model of the PMSM is built using Matlab / Simulink based on the mathematical model and control principle. The simulation the urban driving cycle (UDDS) developed by the US Environmental Protection Agency (EPA). The load torque of the PMSM is calculated according to Equation (4). The dynamic output torque curve of the motor under the cyclic condition .
To verify the rationality of the parameter settings of the motor model and the accuracy of the simulated motor torque in simulating the output torque of the actual vehicle drive motor, an experiment is conducted on the 2016 EV160 pure electric sedan produced by Beijing Automotive Group Co., Ltd. (with the energy recovery mode turned off) on a cement road. The experimental vehicle and the test road are shown in Figure 4.
The experimental tools include the USBCAN – OBD analyzer produced by Guangcheng Technology Co., Ltd. and the ECANTools software. The principle of the experiment is to connect the OBD port of the USBCAN – OBD device to the OBD interface of the car, and connect the other end USB interface to the computer. The USBCAN – OBD can read the car’s OBD data through the ECANTools software, and parse the car sensor data specified in the protocol, including motor speed, motor torque, cumulative mileage, voltage, stator temperature, cooling water temperature, IGBT temperature, etc. The numerical changes of these data can be saved in the computer in real time. Due to the limited experimental conditions, the test vehicle is driven for 1000 seconds, and the measured motor speed and torque of the test vehicle are obtained through the ECANTools software. The measured motor speed is shown in Figure 5, and the simulated torque of the motor is obtained by using the measured motor speed as the control speed of the motor model in Section 2.1. The comparison between the measured motor torque and the simulated torque is shown in Figure 6. The error between the measured data and the simulation results is within 3%, which verifies the reliability of the simulation results.
Here is a summary table of the vehicle motor model and simulation:
| Parameter | Description |
|---|---|
| PMSM Parameters | Parameters of the permanent magnet synchronous motor used in the study, including rated voltage, rated power, maximum speed, maximum torque, number of pole pairs, and other electrical and mechanical parameters |
| Vector Control Model | Equations and principles of the vector control model for the PMSM, including voltage and torque equations, mechanical motion equation, and control strategy (id = 0) |
| Simulation Model | Description of the simulation model built using Matlab / Simulink, including the use of the PMSM module in the Simulink toolbox, the selection of the simulation 工况 (UDDS), and the calculation of the load torque of the PMSM |
| Experimental Verification | Description of the experiment conducted to verify the motor model, including the test vehicle, test tools, experimental principle, and the comparison between the measured and simulated motor torque |
Load History Calculation and Cycle Counting
The gear contact stress spectrum is calculated based on the Hertz contact theory. The maximum contact stress on the helical gear tooth surface occurs on the pinion, and the contact fatigue dangerous position usually appears first in the single tooth meshing area near the pitch line. Therefore, the node is taken as the dangerous position of the gear tooth contact fatigue. The contact stress calculation formula is given by Equation (9):
σH = √(2 * T * (1 / R1 + 1 / R2) / (d1 * π * B * cos(αn) * cos(β) * ((1 – ν1²) / E1 + (1 – ν2²) / E2)))
where σH represents the contact stress, T represents the pinion torque, B represents the tooth width, d1 represents the pitch diameter of the pinion, αn represents the normal pressure angle, β represents the helix angle, E1 and E2 represent the elastic moduli of the two gears, ν1 and ν2 represent the Poisson’s ratios of the two gears, and R1 and R2 represent the curvature radii of the two tooth profiles and are calculated according to the following equations:
R1 = rb1 * tan(α)
R2 = rb2 * tan(α)
where rb1 and rb2 represent the base circle radii of the two gears, and α represents the meshing angle of the two gears.
The dynamic torque of the driving motor obtained from the simulation is substituted into Equation (9) to calculate the contact stress spectrum of the active gear of the electric vehicle transmission under the cyclic condition based on the quasi-static method, as shown in Figure 7.
The rainflow counting method is commonly used for load cycle counting, which establishes a connection between the counting process of the load and the fatigue characteristics of the material. The rainflow counting process is usually implemented through a computer program and can be divided into two steps: data compression and cycle number extraction.
For the gear contact stress spectrum, data extraction and reorganization are first performed to transform the load of a single tooth into a continuous load history. Based on the relationship between the total duration of one revolution of the gear (which is a function of the rotational speed, the meshing period of a single tooth, and the number of teeth), the gear load data can be extracted and reorganized to make the stress – time curve of a single tooth become a continuous load history. Then, the rainflow counting method is used for cycle counting. Finally, the mean – frequency relationship of the contact stress amplitude of the active gear is obtained, as shown in Figure 8. The statistical analysis and K – S hypothesis test of the counting results show that the load mean follows a normal distribution, and the load amplitude follows a Weibull distribution. The mean and standard deviation of the mean distribution of the gear contact stress are 508 MPa and 82.3 MPa, respectively.
Here is a summary table of the load history calculation and cycle counting:
| Parameter | Description |
|---|---|
| Gear Contact Stress Spectrum | Calculation of the contact stress spectrum of the gears based on the Hertz contact theory, including the formula for calculating the contact stress and the determination of the contact fatigue dangerous position |
| Rainflow Counting Method | Introduction to the rainflow counting method for load cycle counting, including its principle and application in engineering practice |
| Data Processing for Gear Contact Stress Spectrum | Description of the data processing steps for the gear contact stress spectrum, including data extraction, reorganization, and the use of the rainflow counting method to obtain the mean – frequency relationship of the contact stress amplitude |
Fatigue Life Calculation
The gears studied in this article are in a low-stress, high-frequency fatigue state, which belongs to high-cycle fatigue. The nominal stress method is commonly used to predict the crack formation life of crack-free structures under high-cycle fatigue. This method is based on the S – N curve of the material or structural component, considering the stress concentration factor and nominal stress at the fatigue dangerous position of the structure and material specimen, and calculates the fatigue life according to the fatigue cumulative damage theory.
The P – S – N curve of the gear material is modified according to Equation (11): S0 = σ0 * ε * β * CL / KT, where S0 represents the stress of the structural S – N curve, σ0 represents the stress of the S – N curve of the structural material, KT represents the stress concentration factor, ε represents the size coefficient, β represents the surface processing coefficient, and CL represents the loading mode.
Based on the experience, the P – S – N curve of the target gear material in the “Handbook of Mechanical Engineering Material Performance Data” is modified to obtain the S – N curve of the target gear with a survival rate of 99%. The effective stress concentration factor of the gear material is selected as 1.0, the size coefficient is 0.86, the surface processing coefficient is 0.90, and CL is taken as 0.85. In addition, since there are many load frequencies below the fatigue limit in the motor drive system, these loads will also cause cumulative damage to the gear. Therefore, the EM rule is used to modify the part of the gear P – S – N curve below the fatigue limit, that is, the same slope as the part above the fatigue limit is taken for the part below the fatigue limit. Thus, the number of stress cycles Ni to reach fatigue failure under any stress amplitude σa is obtained, as shown in Figure 9.
The average stress in the mean – frequency relationship of the gear contact stress amplitude obtained by the rainflow counting method is not all zero. Therefore, the non-zero average stress cycles need to be converted into zero average stress cycles according to the equivalent damage principle. The Goodman fatigue empirical formula is commonly used for this conversion, as shown in Equation (12): N(Se)m = N((Swe / (Sb – Sme)) * Sb)m = C, where Sae and Sme represent the working cycle stress amplitude and average stress obtained by the rainflow counting method, Sb represents the strength limit of the component material, and Se represents the equivalent symmetric cycle stress.
According to the Miner linear cumulative damage theory, the damage is linearly accumulated with the stress cycles, and when the damage accumulates to a certain critical value, failure occurs, as shown in Equation (13): D = Σ(ni / Ni) ≤ 1, where ni represents the number of working cycles under the symmetric cycle stress level, Ni represents the corresponding failure life (number of cycles), and D represents the total damage during a typical load cycle.
Based on the modified P – S – N curve, the fatigue damage under different stress amplitudes is calculated, and the damage D of the transmission active high-speed helical gear under one cycle of driving conditions (UDDS) is calculated to be 3.22 × 10 – 5 according to the Miner linear cumulative fatigue damage theory, as shown in Figure 11. According to the fatigue life formula, the contact fatigue life of the transmission gear is T = 3.1 × 10⁴, that is, after 3.1 × 10⁴ times of UDDS cycles, the gear reaches contact fatigue failure, and the mileage life of the pure electric vehicle is 370,000 km.
Here is a summary table of the fatigue life calculation:
| Parameter | Description |
|---|---|
| Fatigue Performance Curve | Modification of the P – S – N curve of the gear material, including the factors considered in the modification and the determination of the S – N curve of the target gear with a certain survival rate |
| Contact Fatigue Life Calculation | Application of the Miner linear cumulative fatigue damage theory to calculate the contact fatigue life of the transmission gear, including the calculation of fatigue damage under different stress amplitudes and the determination of the fatigue life based on the fatigue life formula |
Conclusion
This article presents a method for calculating the load history of the electric vehicle transmission under cyclic driving conditions based on the dynamic control model of the vehicle permanent magnet synchronous motor and the cyclic driving conditions using computer simulation.
For the load cycle counting of gears, by first performing data extraction and reorganization on the gear contact stress spectrum to make the load of a single tooth into a continuous load history, and then using the rainflow counting method for load cycle counting, the mean – frequency relationship of the contact stress amplitude of the gear teeth under cyclic conditions is obtained.
Based on the modified P – S – N curve and the Miner linear cumulative fatigue damage theory, the contact fatigue life of the high-speed helical gear of the transmission is calculated, providing a theoretical basis and method for the dynamic fatigue life prediction of the gears in the electric vehicle transmission system.
In the future, further research can be conducted in the following aspects: exploring more accurate models and algorithms for calculating the dynamic load of gears, considering the influence of factors such as temperature, lubrication, and material properties on the fatigue life of gears, and conducting more in-depth experimental studies to validate the theoretical predictions. This will help to further improve the reliability and performance of the electric vehicle transmission system.