
Abstract
This study focuses on the performance analysis of cylindrical gear flowmeters through computational fluid dynamics (CFD) simulations. To determine the influence of structural parameters and fluid medium properties on the flowmeter’s accuracy, a simulation method based on the six-degree-of-freedom motion model is proposed. The effects of varying assembly clearances and fluid viscosities on the performance of DN16 cylindrical gear flowmeters are systematically investigated. The results indicate that linearity errors decrease with narrower assembly clearances and higher fluid viscosities. Optimal linearity errors of 0.13% and 0.03% are achieved at specific assembly clearances and fluid viscosities, respectively. These findings provide valuable insights for optimizing the design and application of cylindrical gear flowmeters.
1. Introduction
Cylindrical gear flowmeters, as a type of positive displacement flowmeter, are widely used in various industries such as aerospace, chemical processing, and petrochemicals due to their high accuracy, reliability, and wide measurement range. However, internal leakage resulting from assembly clearances significantly impacts the measurement performance of these flowmeters. The variation in assembly clearances alters the flow pattern within the flowmeter, leading to unpredictable measurement errors.
Recent advances in CFD technology have facilitated detailed analyses of fluid flow phenomena within complex geometries. This study leverages CFD simulations to investigate the effects of assembly clearances and fluid viscosities on the performance of cylindrical gear flowmeters. By understanding these relationships, we aim to optimize the design and application of these flowmeters.
2. Literature Review
Previous studies have investigated the performance of gear flowmeters from different angles. Ma et al. [1] experimentally analyzed the effect of viscosity on the performance of elliptical gear flowmeters, observing an increase in meter factor with higher fluid viscosities. Xin et al. [2] tested cylindrical gear flowmeters under high-pressure conditions but did not delve into the mechanisms behind pressure’s impact. Zhang et al. [3] studied the temperature dependence of cylindrical gear flowmeters, fitting a functional relationship between the meter factor and temperature, yet they did not explain the underlying physical mechanisms.
CFD simulations have been increasingly applied to optimize flowmeter designs. Guo et al. [4] analyzed the internal flow field of turbine flowmeters using CFD and elucidated the influence of viscosity. Similarly, CFD has been employed to study the effects of blade shape on turbine flowmeter performance [5], Reynolds number and boundary layer thickness on V-cone flowmeter performance [6], and flow characteristics of non-standard sonic nozzles [7].
Despite these advancements, there is a lack of comprehensive studies exploring the mechanisms by which assembly clearances affect the performance of cylindrical gear flowmeters. This study fills this gap by conducting a systematic CFD analysis of the effects of varying assembly clearances and fluid viscosities on flowmeter performance.
3. Theoretical Basis
3.1 Working Principle of Cylindrical Gear Flowmeter
A cylindrical gear flowmeter comprises a pair of intermeshing cylindrical gears that rotate under the pressure differential between the inlet and outlet. As the gears rotate, they continuously divide the incoming fluid into discrete volumes, each of which is displaced to the outlet. The total volume of fluid displaced per revolution is given by:
V=2Nv
where V is the total displaced volume, N is the number of teeth on each gear, and v is the volume of each segmented fluid element.
Internal leakage, primarily occurring through end and radial clearances, reduces the actual measured flow rate compared to the theoretical flow rate, thereby impacting measurement accuracy. This study focuses on end and radial leakages, as gear mesh leakage accounts for only approximately 5% of the total leakage.
3.2 Six-Degree-of-Freedom Model
The gear rotation in a cylindrical gear flowmeter can be described by the rigid body equation of motion in an inertial frame:
mathbfL=I⋅ω
where L is the angular momentum, ω is the angular velocity in the body frame, and I is the inertia tensor.
The time derivative of angular momentum is equal to the applied torque T:
fracdLdt=T
This equation governs the gear rotation under varying force conditions. In the simulation, we constrain five degrees of freedom and only allow rotation about the gear’s axis, simulating the real-world operating conditions of the flowmeter.
4. Simulation Methodology
4.1 Simulation Model Setup
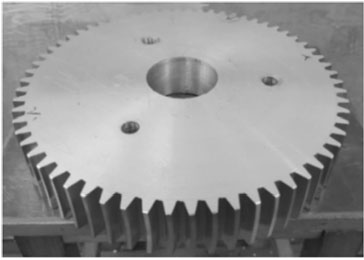
The study focuses on a DN16 cylindrical gear flowmeter, with key dimensions measured from an experimental prototype. A three-dimensional (3D) model of the internal flow field is created using SolidWorks and imported into PumpLinx for CFD simulation.
Table 1 summarizes the key dimensions of the flow field model.
| Dimension | Value |
|---|---|
| Inlet/Outlet Straight Pipe Length | 20 mm |
| Tip Circular Clearance (Bilateral) | 180 μm |
| Gear End Clearance (Bilateral) | 140 μm |
| Gear Mesh Clearance | 22.36 μm |
4.2 Mesh Generation
The flow field is divided into several regions (inlet, upper end clearance, lower end clearance, gears and surroundings, and outlet) to facilitate mesh generation. A fine mesh with 18 layers in critical regions (tip clearance and gear mesh) ensures accurate solutions, resulting in a total mesh count of approximately 660,000 elements.
4.3 Simulation Procedure
Initial and boundary conditions are set up in PumpLinx, following the simulation flowchart in Figure 3. Gear rotation speed is monitored and calculated using an expression derived from the angular velocity:
n=2π60⋅ω
The average rotation speed nˉ over one revolution cycle is used to compute the meter factor Ks:
f=60nˉ⋅N
Ks=qv60f
where f is the rotation frequency and qv is the instantaneous flow rate.
4.4 Validation of the Simulation Method
The simulation method is validated against experimental results obtained from a volume prover system at the AVIC 304 Institute. The system’s measurement range is (0.15–500) L/min, with an overall expanded uncertainty of 0.05% (k=2).
Experimental and simulation results show a similar trend, with an average deviation of 8.8% in meter factors, which is within an acceptable range.
5. Effects of Assembly Clearances on Flowmeter Performance
5.1 Simulation Results
Six models with varying tip and end clearances are simulated (Table 2). the average meter factor and linearity error as clearances decrease.
| Model | Tip Clearance (μm) | End Clearance (μm) |
|---|---|---|
| 1 | 180 | 140 |
| 2 | 170 | 130 |
| 3 | 160 | 120 |
| 4 | 150 | 110 |
| 5 | 140 | 100 |
| 6 | 120 | 80 |
The optimal linearity error of 0.13% is achieved at tip and end clearances of 140 μm and 100 μm, respectively. Narrower clearances beyond this point increase linearity errors due to increased viscous shear forces and pressure losses.
5.2 Mechanism Analysis
Leakage flow rates are estimated using the difference between inlet and theoretical flow rates. Model 2 exhibits the lowest leakage, contributing to its low measurement error.
Pressure loss trends mirror leakage flow rate variations, suggesting that pressure losses dictate the meter factor and linearity error.
6. Effects of Fluid Viscosity on Flowmeter Performance
6.1 Simulation Results
The effects of varying fluid viscosities on flowmeter performance are investigated using Model 2 (optimal leakage configuration). Viscosities range from 42.7 mm²/s to 5.6 mm²/s, simulating different operating temperatures (Table 3).
| Temperature (°C) | Viscosity (mm²/s) |
|---|---|
| 0 | 42.7 |
| 20 | 22.5 |
| 40 | 13.9 |
| 60 | 9.7 |
| 80 | 7.1 |
| 100 | 5.6 |
The meter factor increases with viscosity, and linearity errors decrease significantly at higher viscosities. The lowest linearity error of 0.03% is achieved at 42.7 mm²/s viscosity.
6.2 Mechanism Analysis
Leakage flow rates decrease with increasing viscosity, resulting in higher meter factors and lower linearity errors. This trend is attributed to the reduced leakage caused by higher viscous forces.
7. Conclusion
This study comprehensively analyzes the performance of cylindrical gear flowmeters using CFD simulations. Key findings include:
- Validation of Simulation Method: The simulation method, based on the six-degree-of-freedom model, is validated against experimental results, confirming its reliability.
- Optimal Clearances: Optimal linearity errors (0.13%) are achieved at tip and end clearances of 140 μm and 100 μm, respectively. Narrower clearances increase linearity errors due to increased pressure losses.
- Effect of Viscosity: Linearity errors decrease significantly with increasing fluid viscosity, with the lowest error (0.03%) observed at 42.7 mm²/s viscosity.
- Mechanism Insights: Pressure losses and viscous forces dictate the meter factor and linearity error, with leakage flow rates playing a crucial role.
These findings offer valuable insights for optimizing the design and application of cylindrical gear flowmeters, particularly in environments with varying operating conditions.