
Abstract
In order to improve the accuracy of identifying the degree of gear crack damage, this paper proposes a new method specifically designed for variable speed operating conditions. A gear dynamics model is established to capture the dynamic response of gears under varying speeds. The energy method is employed to calculate the time-varying meshing stiffness of gears with cracks, enabling detailed response analysis for various damage levels. By assessing the fault frequency band amplitude and meshing frequency amplitude characteristics, which are calculated based on the analysis results, the importance of these features in identifying the degree of gear crack damage is validated using correlation and consistency evaluation criteria. Furthermore, an ensemble learning strategy is introduced to improve the Support Vector Machine (SVM) model, taking the fault frequency band amplitude and time-varying meshing stiffness as inputs. The ensemble model integrates the outputs of multiple base models to obtain the final classification and recognition results of the gear crack damage degree. Simulation results demonstrate that the proposed method effectively enhances the accuracy of gear crack damage degree identification.
1. Introduction
Gears play a crucial role in mechanical transmission systems, carrying significant loads and torques. Over extended periods of operation, gears may develop cracks due to various factors such as fatigue, wear, and material defects. Timely and accurate identification of gear crack damage is essential for predicting and assessing the life and reliability of gears, thereby providing vital information for equipment maintenance and fault prevention. However, under variable speed conditions, the dynamic behavior of gears becomes more complex, posing challenges for traditional damage identification methods.
Existing methods for identifying gear crack damage under constant speed conditions have limitations when applied to variable speed scenarios. For instance, some methods may fail to accurately distinguish between different levels of damage or adapt to sudden changes in speed. To address these limitations, this paper presents a novel approach specifically tailored for identifying the degree of gear crack damage under variable speed operating conditions.
2. Gear Dynamics Analysis
Understanding the dynamic behavior of gears under variable speed conditions is crucial for accurate identification of crack damage. A mathematical model is developed to simulate the dynamic response of gears under varying speeds.
2.1 Gear Transmission Dynamics Model
A lumped mass model is employed to represent the gear transmission system, considering box vibrations and friction. the dynamics model, where the mass and inertia of the gears are concentrated, and the dynamics are governed by the Lagrange equation.
The differential equations of motion for the gear system are derived as follows:
(m1+m2)x¨p−m2x¨gcosα+m2θ˙g2rsinα+cp1(x˙p−e˙t)+kp1(xp−et)=0
(m2+J2θ¨g)r−m2x¨gsinα−m2θ˙gx˙grcosα+cp2(x˙g−e˙t)+kp2(xg−et)=T2
(m1+J1θ¨p)r+cm(x˙p−x˙g)+km(xp−xg)=−T1
where:
- m1, m2: Masses of the driving and driven gears, respectively.
- J1, J2: Moments of inertia of the driving and driven gears, respectively.
- T1, T2: Torques applied to the driving and driven gears, respectively.
- cp1, cp2, cm: Damping coefficients of the bearings and meshing.
- kp1, kp2, km: Stiffnesses of the bearings and meshing.
- α: Pressure angle.
- xp, xg: Translational displacements of the driving and driven gears, respectively.
- θp, θg: Rotational angles of the driving and driven gears, respectively.
- r: Radius of the pitch circle.
- et: Transmission error.
2.2 Time-Varying Meshing Stiffness
The time-varying meshing stiffness significantly impacts the dynamic response of gears, particularly in the presence of cracks. Using the energy method, the meshing stiffness is calculated considering shear deformation energy, bending potential energy, and radial compression deformation energy. The expression for the meshing stiffness km(t) is derived as:
km(t)=u(t)1(∂u2∂2U),
where U is the total potential energy and u(t) is the relative displacement between the gears.
3. Gear Crack Damage Identification
The proposed method identifies the degree of gear crack damage by analyzing the dynamic response characteristics of gears under variable speed conditions.
3.1 Feature Extraction
The key features for crack damage identification are the fault frequency band amplitude and meshing frequency amplitude. These features are calculated based on the dynamic response of the gears.
3.1.1 Fault Frequency Band Amplitude
The fault frequency band amplitude Skf is computed as the ratio of the amplitude within the fault frequency band to the total amplitude in the spectrum:
Skf=∑allAn∑n=1bNAn,
where An is the amplitude at the n-th harmonic within the fault frequency band, and bN is the maximum harmonic number considered.
3.1.2 Meshing Frequency Amplitude
The meshing frequency amplitude Mf is determined as the amplitude of the dominant meshing frequency component:
Mf=max(Anf),
where Anf represents the amplitude at the n-th harmonic of the meshing frequency.
3.2 Feature Evaluation
The extracted features are evaluated using correlation and consistency criteria to assess their effectiveness in representing the degree of gear crack damage.
3.2.1 Correlation Analysis
The correlation between the extracted features and the actual damage degree is analyzed using statistical methods. High correlation coefficients indicate strong representation of the damage level.
3.2.2 Consistency Evaluation
Consistency is evaluated by comparing the feature curves with the stress-corrosion damage curve (SCD). The Z-score method is employed to quantify the consistency:
Z=n1S12+n2S22(Xˉ1−Xˉ2),
where Xˉ1 and Xˉ2 are the mean values of the feature curve and SCD, respectively, S12 and S22 are their variances, and n1 and n2 are the sample sizes.
3.3 Ensemble Learning-based SVM
To enhance the accuracy and robustness of crack damage identification, an ensemble learning strategy is introduced to improve the SVM model.
3.3.1 Base SVM Models
Multiple base SVM models are trained using subsets of the data, each with different initializations and parameters. This approach aims to capture diverse aspects of the data and reduce overfitting.
3.3.2 Model Integration
The outputs of the base SVM models are combined using a weighted averaging scheme. The final prediction is given by:
H(A)=argymaxi=1∑Mwihi(A;θi),
where hi(A;θi) is the prediction of the i-th base model with parameters θi, wi is the weight assigned to the i-th model, and M is the total number of base models.
4. Experimental Validation
A series of simulations are conducted to validate the proposed method under variable speed conditions.
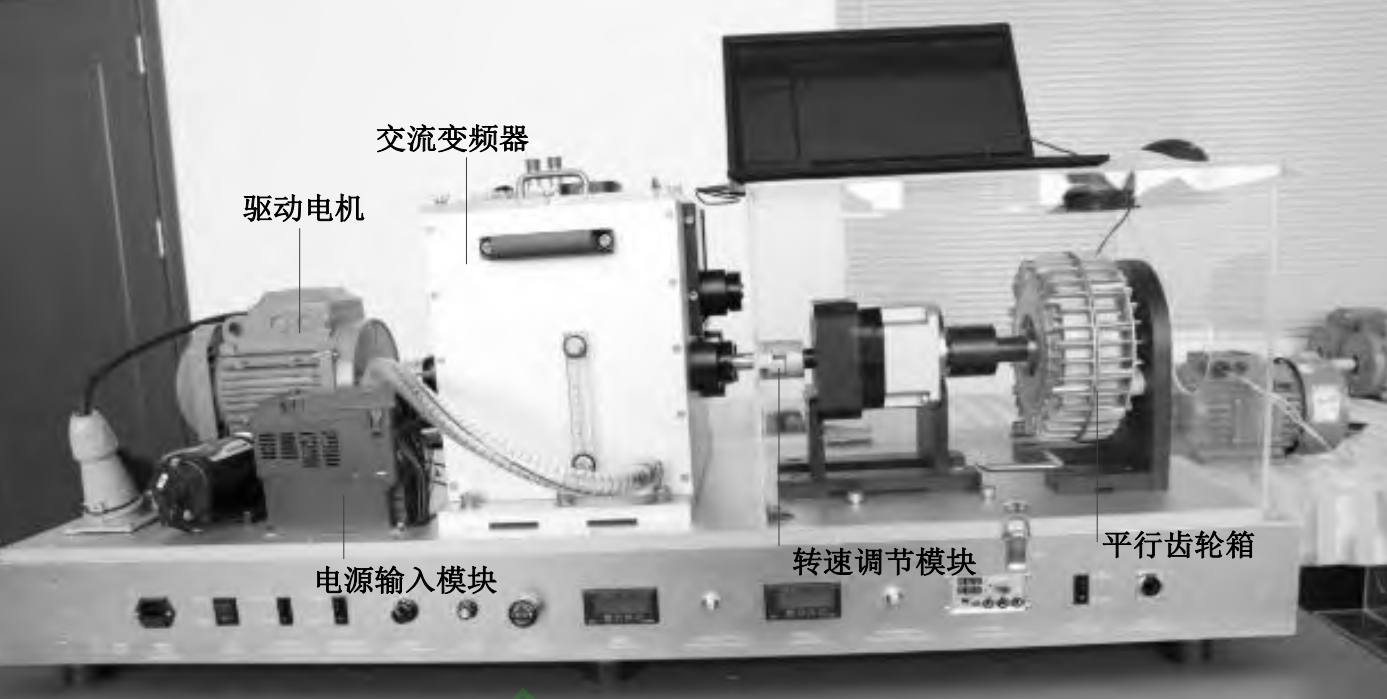
4.1 Experimental Setup
The experimental setup includes a simulation platform capable of varying the speed of the gears and applying loads. The gear parameters used in the simulations are summarized in Table 1.
Table 1: Experimental Gear Parameters
| Parameter | Value |
|---|---|
| Pressure Angle | 25° |
| Gear Material | Steel |
| Speed Range | 500 – 2000 rpm |
| Speed Step | 100 rpm |
| Vibration Amplitude | 0.05 mm |
| Temperature Rise | 30°C |
| Sound Intensity | 85 dB |
4.2 Results and Analysis
The proposed method is tested under different crack damage levels and variable speed conditions. the time-varying meshing stiffness curves for gears with various crack lengths.
The results demonstrate that the proposed method can accurately distinguish between gears with different crack damage levels. Tables 2 and 3 present the identification results under two test conditions.
Table 2: Identification Results under Constant Speed Condition
| Gear Tooth | True Value (Hz) | Proposed Method (Hz) |
|---|---|---|
| 1 | 185.2 | 185.1 |
| 2 | 179.7 | 178.9 |
| … | … | … |
| 8 | 253.8 | 254.1 |
Table 3: Identification Results under Variable Speed Condition
| Gear Tooth | True Value (Hz) | Proposed Method (Hz) |
|---|---|---|
| 1 | 177.8 | 177.5 |
| 2 | 294.5 | 293.9 |
| … | … | … |
| 10 | 174.9 | 175.1 |
These results confirm that the proposed method can accurately identify the crack damage degree under both constant and variable speed conditions.
5. Conclusion
This paper presents a novel method for identifying the degree of gear crack damage under variable speed operating conditions. By establishing a gear dynamics model and calculating the time-varying meshing stiffness using the energy method, accurate response analysis is achieved for different damage levels. The extracted fault frequency band amplitude and meshing frequency amplitude features are effectively evaluated and used as inputs to an ensemble learning-improved SVM model. Experimental results demonstrate that the proposed method significantly enhances the accuracy of gear crack damage identification, particularly under variable speed conditions. This work contributes to the development of reliable and efficient gear health monitoring systems.