
0. Introduction
Helical gear is widely used in various transmission equipment such as petroleum, chemicals, energy, and automobiles due to their high contact ratio, good meshing performance, and low vibration and noise. As gear transmission systems increasingly operate under high-speed and heavy-load conditions, assessing the fatigue life of helical gear remains a challenging issue, particularly when operating parameters are close to limits or safety factors are low. During high-speed operation, gear pairs often endure significant loads, leading to various forms of failure due to meshing impacts and large tooth vibrations. Statistics show that fatigue failure accounts for up to 50% of mechanical failures. To ensure the normal operation of equipment, it is necessary to predict the fatigue life of gear transmission systems during the design phase and perform reasonable gear shape modifications to ensure high-quality operation within the design life. Various studies have been conducted on gear fatigue life. Liu et al. proposed a bending fatigue life prediction model for cylindrical gears based on the Palmgren-Miner linear cumulative damage theory and fracture cumulative energy curves under different stress amplitudes. Zhou et al. considered residual stress on the tooth surface caused by manufacturing processes and proposed a method to calculate the contact fatigue crack initiation and propagation life of spiral bevel gears. Liu et al. used multi-objective optimization to automatically select the feature subset most relevant to contact fatigue remaining life and constructed a contact fatigue remaining life prediction model based on an optimized Back Propagation (BP) neural network on the Spark platform. Nie et al. calculated the deviation between the actual tooth surface of the pinion and the reference tooth surface, constructed an Ease-off topology map, and improved the actual contact ratio under loading by modifying the current Ease-off topology, which is beneficial for vibration reduction and noise reduction. Li et al. proposed a modified S-N curve considering low-stress cycles and material differences to address the shortcomings of the traditional Miner fatigue cumulative damage theory. The modified S-N curve and transient dynamics analysis were used to predict the fatigue life of gears in electric multiple units. The results showed that the improved fatigue life analysis method is more consistent with engineering practice than traditional methods. Cameron et al. developed an iterative fitting method to optimize the prediction of gear fatigue life by determining the values of distribution parameters and analyzed bearing and gear data. The results showed an increasing trend in the minimum life coefficient related to the time scale of fatigue tests.
From the above research analysis, most current gear fatigue life prediction analysis and modification methods rely on theoretical discussions, local modifications, or empirical formulas, lacking an objective and effective complete modification theory. This paper combines the above research results, takes the helical gear pair in a compressor system as the research object, obtains the simulation analysis load spectrum of the helical gear through dynamics simulation, proposes a strain analysis-guided node displacement modification method based on the fatigue life analysis results, uses data integration and simulation methods to obtain the correction modification curve, and verifies the effectiveness of the modification method in improving fatigue life.
1. Fatigue Analysis Method
Direct experimental validation to test fatigue life is costly and has disadvantages such as limited testing times and poor universality, especially for customized non-standard products. The nominal stress method, as one of the earliest material fatigue analysis methods, is suitable for high-cycle fatigue analysis of mechanical components . The working principle of the nominal stress method is based on the S-N curve of mechanical parts or materials, which shows the nominal stress and stress concentration at the damage-prone locations of mechanical components, and uses fatigue damage accumulation theory to solve the fatigue life of mechanical components. The fatigue life research of helical gear pairs belongs to the category of high-cycle fatigue, making the nominal stress method suitable for analysis and calculation. The steps of analyzing the fatigue life of mechanical components using the nominal stress method .
| Step | Description |
|---|---|
| 1 | Determine the basic geometric parameters and material properties of the helical gear pair. |
| 2 | Establish a three-dimensional assembly model of the helical gear pair using GearTrax software. |
| 3 | Import the model into the simulation software and define the material properties, contact parameters, and loading conditions. |
| 4 | Perform dynamics simulation to obtain the time-domain contact force curve. |
| 5 | Conduct finite element static contact analysis to obtain the stress and strain distribution of the gear teeth. |
| 6 | Obtain the S-N curve of the gear material through experimental methods or empirical formulas. |
| 7 | Combine the time-domain contact force curve and finite element analysis results in nCode to convert the load time history into a stress tensor time history. |
| 8 | Set the average stress correction method and load statistics method to obtain the fatigue life nephogram. |
2. Simulation Analysis of Helical Gear Pair
2.1 Dynamics Analysis of Helical Gear Pair
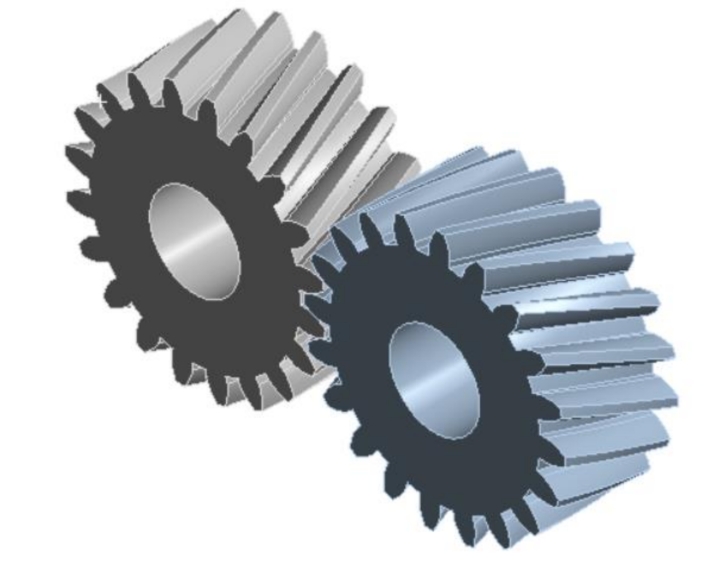
The basic geometric parameters of the helical gear pair in the transmission box of a compressor system are shown in Table 1. Using these parameters, a three-dimensional assembly model of the helical gear pair was established using GearTrax software and imported into the simulation software. Both the driving and driven gears are made of high-quality low-carbon alloy steel 20CrMnMo, with material properties including a Poisson’s ratio μ of 0.3, yield limit σₛ of 885 MPa, elastic modulus E of 206 GPa, and tensile strength σb of 1182 MPa.
To ensure the authenticity of the dynamics analysis, the meshing motion between the gears is defined as interaction only through contact collision force and friction, based on a force constraint relationship involving contact collision. In the dynamics analysis, the restitution coefficient employs a compensation function, and the contact collision force is calculated based on the Impact function of Hertz theory combined with damping and stiffness coefficients. The Impact function is a nonlinear spring-damper model based on penetration depth, equivalent to the actual collision process of objects, with the expression:
F=max{0,K(x1−x)p−step(x,x1−d,Cmax,x1,0)x∗}
where K is the contact stiffness coefficient, x1 is the displacement state control variable, x is the displacement variable of the contacted part, p is the nonlinear spring force exponent, d is the maximum damping penetration depth, Cmax is the maximum contact damping, and x∗ is the penetration speed of the contacted object.
During the analysis, the motion mode and load of the helical gear pair are equivalently converted into corresponding motion pairs and loads in the Adams software. Mass properties are added to the imported model, rotational pairs are added to the driving and driven gears, the rotational speed of the driving gear is set to 11,000 r/min (66,000°/s), and a resistance torque of 1,465 N·m is applied to the driven gear. To ensure a smooth speed transition during the startup phase and reduce impacts, a step function is used to gradually apply the rotational speed. The contact stiffness coefficient of the helical gear is determined by the gear material and structural characteristics, with the expression:
K=34R1+R2R1R2E2(1−μ12)+E1(1−μ22)E1E2
where E1 and E2 are the elastic moduli of the driving and driven gear materials, respectively; R1 and R2 are the equivalent radii of the contact points of the driving and driven gears, respectively; and μ1 and μ2 are the Poisson’s ratios of the driving and driven gear materials, respectively. Calculation yields K=1.56×10⁷ N/mm^1.5, with a collision force exponent e=1.5, maximum damping penetration depth d=0.1, and damping coefficient C=30 N·s/mm. Gear friction is determined using Coulomb’s method, and gears are analyzed with lubrication, with static and dynamic friction coefficients set to 0.08 and 0.05, respectively.
The simulation time is set to 10 s, the velocity constraint equation is substituted into the calculation, and the GSTIFF integrator SI2 format, which provides more thorough acceleration and velocity analysis results, less dependence on step size for calculation accuracy, and stronger stability, is used to solve the problem. A virtual prototype model of the corresponding helical gear pair is established .
Table 1: Basic geometric parameters of the helical gear pair
| Parameter | Value |
|---|---|
| Number of teeth (driving/driven) | 112, 63 |
| Normal module mn (mm) | 2.5 |
| Normal pressure angle α (°) | 20 |
| Helix angle β (°) | 12.429 |
| Center distance a (mm) | 224 |
| Face width b (mm) | 80 |
| Addendum modification coefficients (high/low speed) | 0.1, -0.1 |
| Input speed (r/min) | 11,000 |
2.2 Meshing Force Analysis Results
The dynamic time-domain variation curve of the contact force of the helical gear pair reaching the rated rotational speed . The contact force of the helical gear pair varies periodically around the mean value within a certain numerical range, consistent with the variation in meshing force caused by changes in meshing stiffness during gear meshing. The interval between peaks (or troughs) is 5.11 × 10⁴ N. The calculation results are saved as a “.dac” file and exported to prepare the load spectrum for fatigue life analysis.
2.3 Finite Element Contact Analysis of Helical Gear Pair
To simplify calculations while accurately simulating the meshing process and state, local processing is performed on the three-dimensional model, retaining 9 teeth on the driving gear and 8 teeth on the driven gear. The meshing model is saved as a “.x_t” file readable by the Hypermesh professional meshing software for meshing. Comparing meshing algorithms, hexahedral meshing exhibits higher numerical simulation accuracy, smaller computation scale, and faster convergence compared to tetrahedral meshing. Therefore, hexahedral meshing is adopted .
During meshing, the model is divided into several equal parts, and one tooth unit is meshed. Then, using the Soildmap tool, the mesh is replicated and rotated according to the model prototype to obtain the final meshed model. The total number of elements in the model is 98,450, with the effective meshing part controlled to approximately 1 mm and the minimum Jacobian element of 0.7.
The meshed model is imported into Workbench software. According to the power transmission relationship, the tooth surface of the driving gear is set as the contact surface, the tooth surface of the driven gear is set as the target surface, the contact type is Frictional, and the friction coefficient is 0.2. The contact algorithm selects the Lagrange algorithm for enhanced stability. During boundary condition setting, constraints are applied to the driving and driven gears, with a torque applied to the rotational center of the driving gear to retain axial rotation, and the driven gear is fully constrained.
The calculated end face contact ratio εα is 1.762, axial contact ratio εβ is 2.192, and total contact ratio εα+εβ is 3.954, indicating good transmission smoothness. During gear transmission, three-tooth and four-tooth meshing alternately occur, with four-tooth meshing prevailing for most of the time. The tooth surface contact stress nephogram. The maximum contact stress is 602.95 MPa, and the gear contact line has a certain angle of inclination along the tooth edge. The contact pressure distributes along the contact line, with the maximum value occurring at the tooth tip of the driven gear. the equivalent strain nephogram of the driven gear. The deformation amount at specific coordinate locations can be identified using the label tool, with larger deformation amounts indicated by darker colors.
3. Fatigue Life Analysis of Helical Gear Pair
The S-N curve represents the fatigue performance of the material and is generally obtained through experimental methods and empirical formulas to describe the relationship between material stress and fatigue life, with the expression:
mlgσ+lgN=lgG
where N is the stress cycle count, σ is the stress, and m and G are fatigue test constants.
From the literature , when the reliability of 20CrMnMo is 99%, the test constant G=3.68×1056 and m=15.29. After gear hobbing, carburizing and quenching are performed, with an effective carburized layer depth of 0.63–0.75 mm and tooth surface hardness of 60–62 HRC. Substituting these values yields the approximate S-N curve , with a reliability of 99%.
The complete 10 s load spectrum obtained from Adams and the Workbench analysis results are imported into nCode, which automatically combines the time series load and finite element analysis results to convert the load time history into a stress tensor time history. The Goodman method is set for average stress correction, and the rainflow counting method is selected for load statistics to obtain the final fatigue life nephogram. The minimum life cycle of the gear pair is 7.35 × 10^7 cycles, with the minimum value occurring at the meshing tooth tip of the driven gear, consistent with the location of the maximum stress. The fatigue analysis load acts for 10 s, indicating fatigue failure after 7.35 × 10^7 cycles of 10 s loads. Therefore, the complete fatigue life cycle count is converted to 1.44 × 10^13.
4. Research on Modification Methods
4.1 Traditional Modification Methods
Tooth profile modification can optimize the tooth profile structure of gears, improve their load-bearing capacity and dynamic performance, and extend service life . The amount of tooth profile modification is mainly influenced by factors such as the deformation generated by the load on the teeth and manufacturing errors. Traditional modification methods mostly adopt local modifications or empirical formulas. For powers greater than 2,000 kW and linear velocities greater than 100 m/s, the commonly used linear modification is employed, with the principle. When the normal module mn is 2.5 mm, Δ1=Δ3=0.015 mm, Δ2=0.005 mm, the tooth tip modification radius R=0.5 mm, and the tooth tip modification height h=1 mm are selected. Through fatigue life analysis, the fatigue life of the traditional linear modification is 1.59 × 10^13, an improvement of 10.42% compared to before modification.
4.2 Node Displacement Modification Method
Combining finite element simulation results, based on the specific position deformation of the tooth surface, the tooth surface is divided into n equal parts, node displacement during meshing is obtained on each section, and multiple node displacements are integrated to fit the trend curve that best reflects the characteristics of all nodes. According to the trend curve, the load distribution feedback by node deformation is corrected to make the load distribution on the tooth profile line more uniform. The tooth surface node segmentation method.
To represent feature points as much as possible and reflect the trend of node displacement changes, 10 equal sections are selected, with 13 nodes taken from the tooth tip to the tooth root on each section, totaling 130 sets of data. K-Means clustering is used to integrate the data. The principle of the K-Means clustering algorithm is to randomly select k data points as cluster centers and then classify the remaining data points into cluster centers based on the nearest distance criterion . The advantages of the K-Means clustering algorithm include high efficiency and strong scalability In this study, two k-means values are selected for integration and calculation, with the results .
Based on the data characteristics obtained from the clustering algorithm, three methods are used to numerically simulate the modification trend curve: polynomial fitting, neural network fitting, and custom base function fitting. Polynomial fitting offers flexibility in fitting various curve shapes by selecting appropriate polynomial degrees and parameters, enabling the fitting curve to better approximate the original data. The neural network fitting algorithm is a flexible and effective nonlinear data fitting method that can approximate continuous functions with arbitrary precision and has a wide range of applications. The base function fitting method, on the other hand, utilizes functions with a specific trend to comprehensively process the data based on the data variation trend, allowing for the creation of custom functions that best represent the target curve.
For the neural network fitting, the ReLU function is chosen as the activation function, Xavier initialization is used for the initialization method, the learning rate is set to 0.01, and the Adam algorithm, known for its excellent performance, is adopted to optimize and update the network weights. The final fitting results of the three methods.
To more clearly demonstrate the data processing effect and the fitting gaps between polynomial, neural network, and base function fitting curves, the root mean square error (eRMS) and mean absolute error (eMAE) are used for quantification, with their expressions given by:
eRMS=1n∑i=1n(yi−^yi)2eMAE=1nn∑i=1|yi−^yi|(4)(5)where n is the number of instances and yi and ^yi represent the expected and actual output values, respectively.
As shown in Table 2, the clustering error is several orders of magnitude smaller than the fitting curve errors, satisfying the calculation requirements. After continuous optimization and adjustment, the mean square errors and mean absolute errors of polynomial, neural network, and custom base function fitting methods are in the orders of 10-3, respectively. Among them, the base function fitting method exhibits the best performance. Therefore, the base function is selected as the tooth profile modification trend curve, with the expression given by:
CMTC=−0.2944−0.0038x+0.0001×2+0.9998x+0.0001x(6)
Combining the trend curve and the numerical range of modification experience, the final tooth profile modification curve is obtained, which can be used to supplement and correct the standard involute profile. The relationship between the modification amount and fatigue life is shown in Table 3.
It can be observed from Table 3 that when the modification amount Δ1 is 0.021 mm, the fatigue life reaches its maximum value of 1.86×10^13, representing a 29.17% increase compared to the unmodified gear and a 16.98% improvement over the traditional linear modification. By subtracting the maximum deformation amount from the maximum modification amount, the modification curve is obtained as:
CMC=−0.9734−0.0038x+0.0001×2+0.9998x+0.0001x(7)
Compared to traditional modification methods, the node displacement modification method is not limited to a single modification trend. The modification curve aligns well with the deformations caused by loading, offering advantages such as strong modification adaptability, high modification curve accuracy, and effective modification results. Reasonable modification can reduce meshing impacts and improve gear transmission performance. However, excessive modification amounts can lead to material removal beyond normal ranges, causing abrupt changes in meshing stiffness and reducing fatigue life, which is consistent with actual meshing processes.
In summary, the node displacement modification method proposed in this study, based on the specific position deformations of the tooth surface and utilizing K-Means clustering and base function fitting, effectively optimizes the tooth profile structure, enhances load distribution uniformity, and improves fatigue life, providing a valuable reference for the research on gear pair fatigue life.