
1. Introduction
Spiral bevel gear plays crucial role as key components in power and motion transmission systems. Their dynamic characteristics, strength, lifespan, and reliability significantly impact the overall performance of the transmission system. For instance, when spiral bevel gear meshing frequency approaches its natural frequency, it can lead to severe vibration and noise. This issue becomes particularly prominent in the aviation sector, where transmission systems are evolving towards being lighter, capable of handling heavier loads, and operating at higher speeds.
Modal analysis serves as a primary method for studying structural dynamics. By conducting modal analysis on spiral bevel gear, we can determine their dynamic properties, enabling more accurate predictions of the actual operating state and performance of spiral bevel gear. Additionally, based on the results of modal analysis, the gears can be redesigned. This helps designers identify the weak areas of the structure, make necessary structural dynamics modifications, and understand the changes in dynamic characteristics due to structural alterations.
Traditional methods for analyzing spiral bevel gear has their limitations. When using the finite element method for modal analysis, the defined physical properties are often approximate values, making it difficult to accurately assess the obtained modal parameters. On the other hand, experimental methods may face issues such as incomplete testing. Moreover, separating the physical entity from the finite element model makes it challenging to correlate the experimental modal results with the finite element model.
Digital twin, as a digital mirror of the real physical body, offers a solution. The construction of a digital twin model involves digitally modeling the attributes, methods, and behaviors of the physical entity and its processes in the digital space. This enables an accurate simulation and mapping of the form and performance of the real physical body in a virtual space. For spiral bevel gear, creating an accurate digital twin model requires precise geometric shapes and structures, along with accurate material physical properties, to accurately map the dynamic characteristics of the physical entity.
This article proposes a method that combines experimental and simulation approaches. Based on the construction of an accurate geometric model, the physical properties of the spiral bevel gear is refined to establish an accurate digital twin model. Through simulation analysis, the modal frequency, modal shape, and frequency response function of the free mode are obtained. Quantitative correlation analysis between the simulation and experimental modal analysis results is then performed to verify the accuracy of the modal analysis.
2. Spiral Bevel Gear Modal Test
2.1 Modal Test Scheme
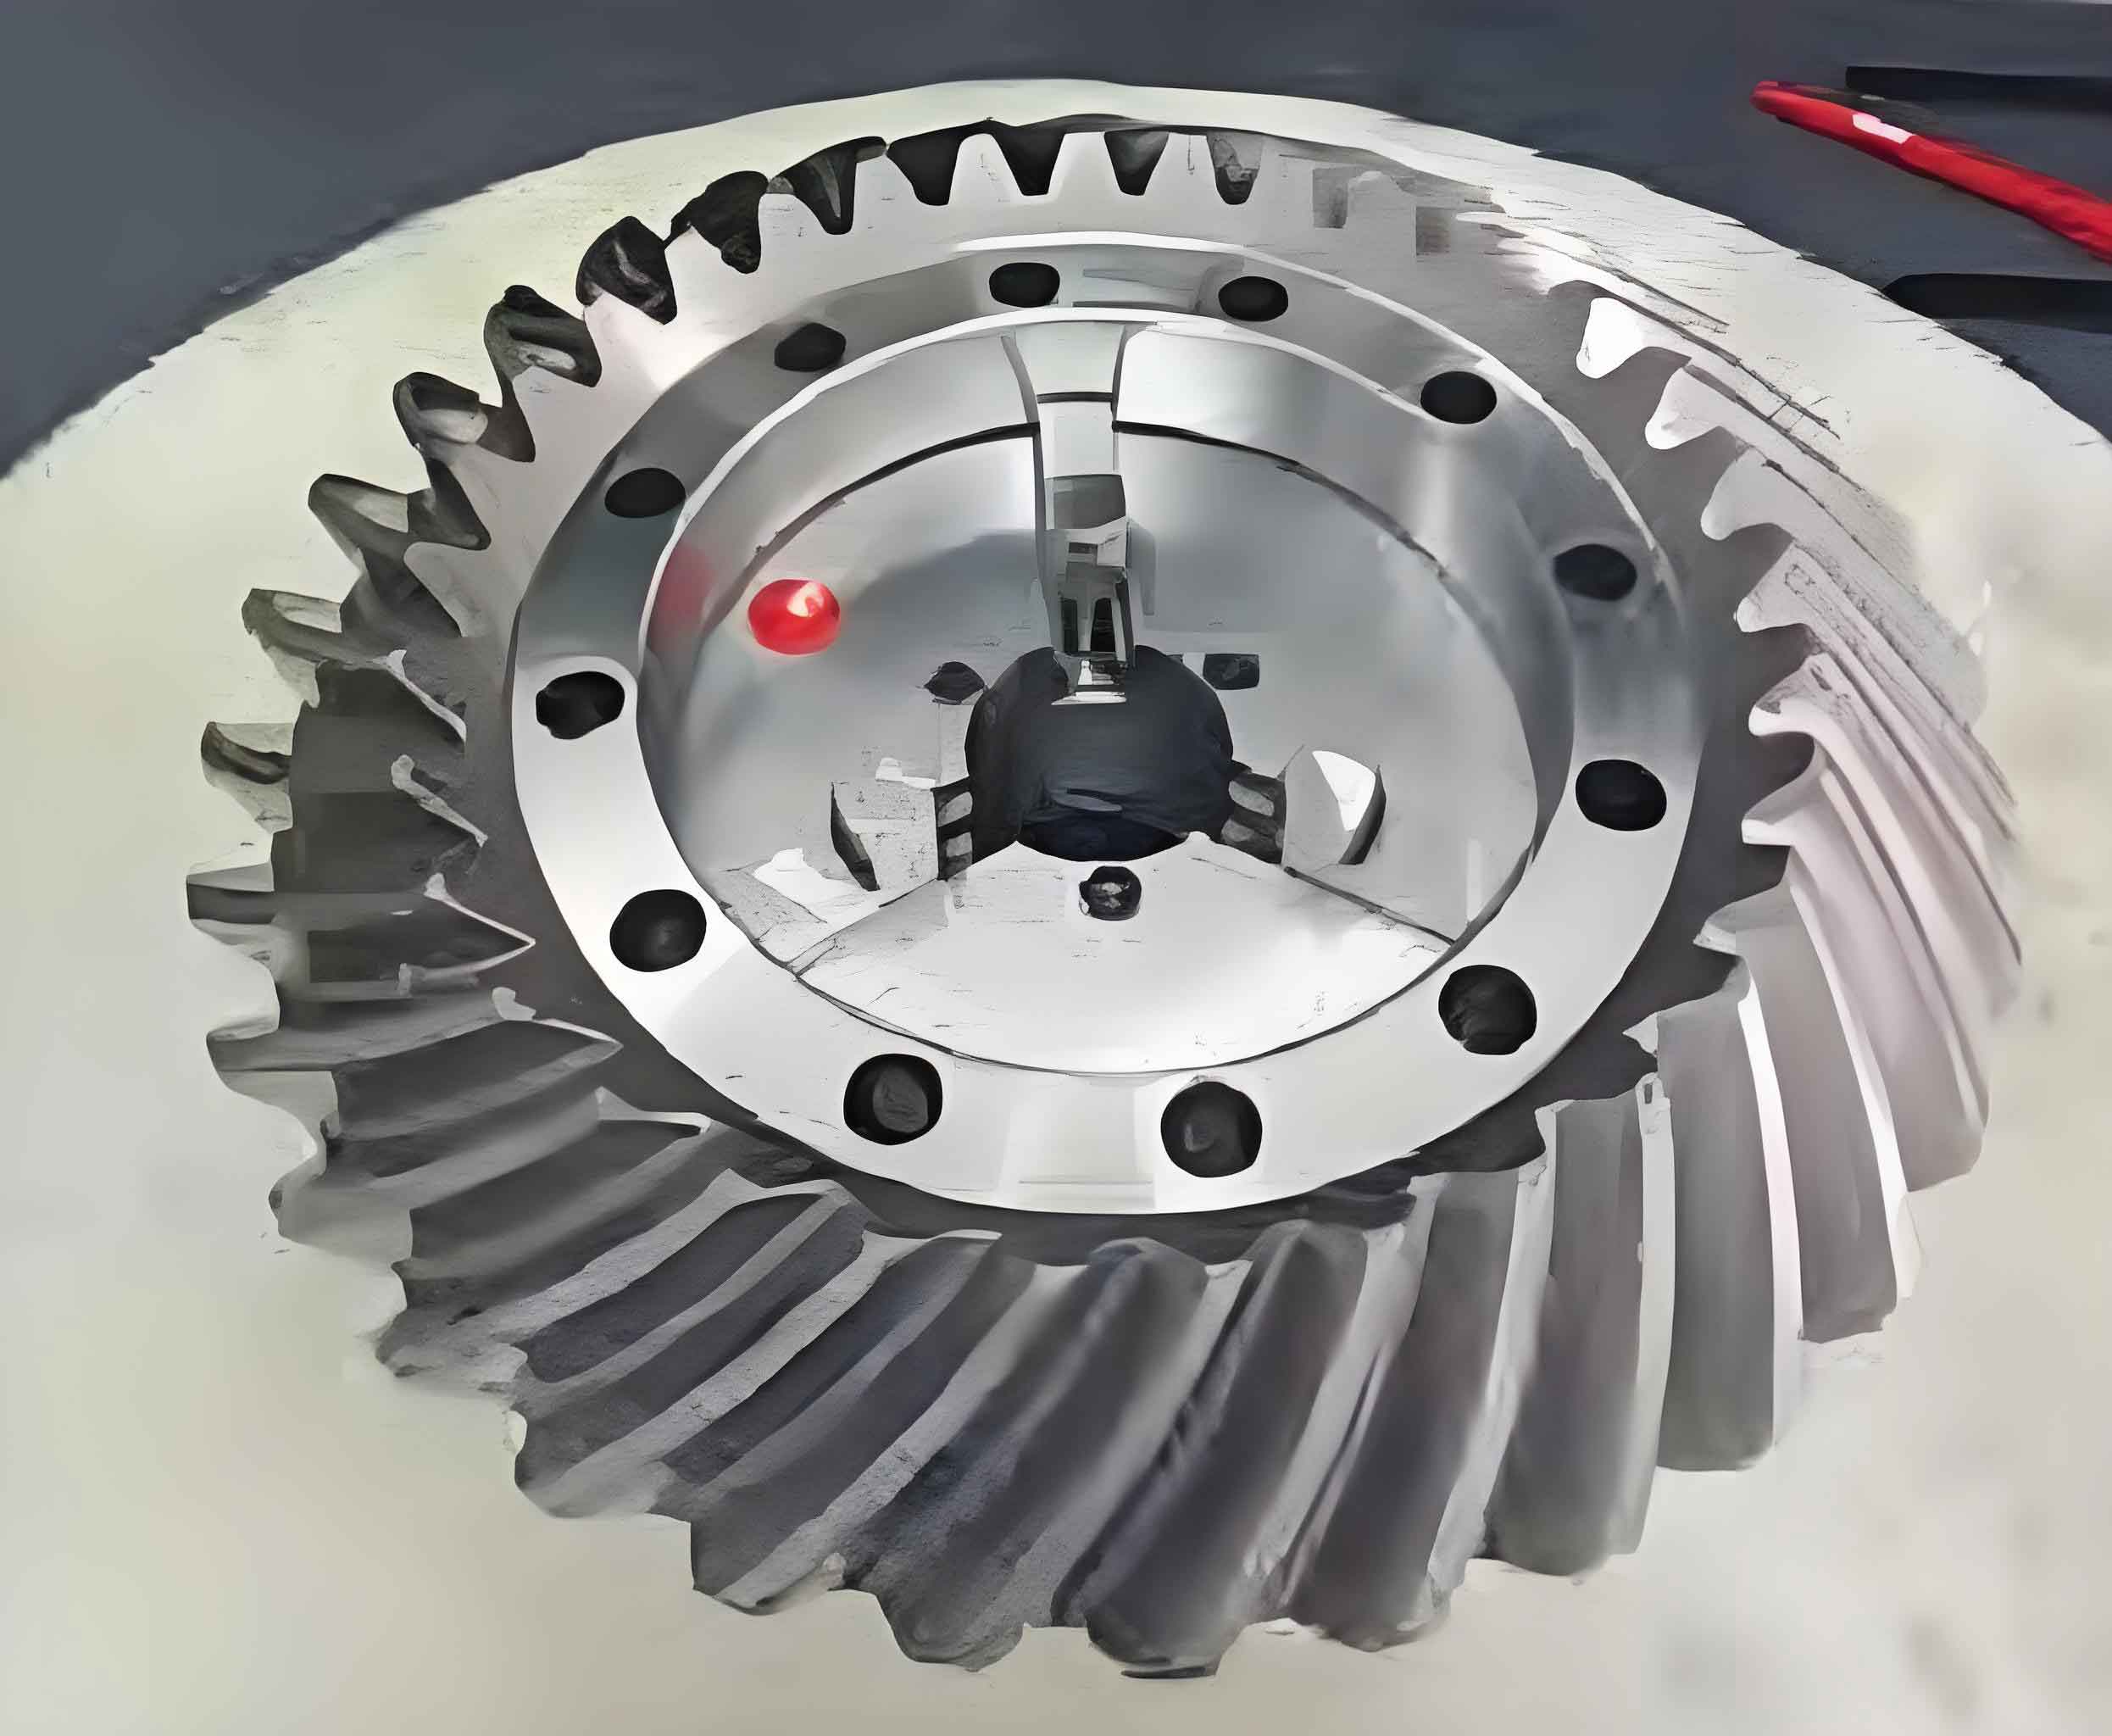
The modal test was conducted on the large wheel of a spiral bevel gear pair. The basic parameters of the spiral bevel gear pair are presented in Table 1.
| Parameter | Large Wheel |
|---|---|
| Number of Teeth | 33 |
| Module | 8.4848 |
| Helix Direction | Right-handed |
| Tooth Width (mm) | 46 |
| Pressure Angle (°) | 20 |
| Spiral Angle (°) | 35 |
| Pitch Cone Angle (°) | 51.767 |
| Face Cone Angle (°) | 54.193 |
| Root Cone Angle (°) | 48.585 |
| Midpoint Cone Distance (mm) | 155.23 |
| Addendum Height (mm) | 5.939 |
| Dedendum Height (mm) | 9.955 |
The gear detection center was used to detect the tooth surface coordinates for constructing an accurate geometric model of spiral bevel gear. The free modal test of the spiral bevel gear implies no constraints during testing. However, it is practically impossible to make the gear completely suspended in the air. In the test, a 2m elastic nylon rope was used to hang the test gear to achieve a free boundary. The mobile force hammer method was employed to test the modal parameters and modal shapes of the large wheel. The excitation points and response points were evenly set on the back of spiral bevel gear. Four acceleration sensors were installed at the measurement points, and 132 measurement points were planned for the large wheel. The position and numbering of the measurement points . Each measurement point was hammered three times, and the average value was taken.
2.2 Experimental Modal Analysis
The force hammer and vibration response signals were collected by a signal acquisition instrument. the hammering excitation force signal, and the time-domain and frequency-domain signals of the large wheel measurement point response, respectively.
Through the test, the modal frequency and modal shape under the free modal condition were obtained. Table 2 lists the modal frequencies and damping ratios measured for the large wheel.
| Modal Order | Frequency (Hz) | Damping Ratio (%) |
|---|---|---|
| 1 | 1436.3 | 0.098 |
| 2 | 1441.1 | 0.083 |
| 5 | 3400.5 | 0.112 |
| 6 | 3700.5 | 0.086 |
| 7 | 3700.7 | 0.094 |
| 8 | 5195.8 | 0.063 |
| 9 | 5204.0 | 0.295 |
| 12 | 6393.0 | 0.070 |
| 13 | 6403.7 | 0.029 |
| 15 | 8653.2 | 0.140 |
| 16 | 8686.5 | 0.101 |
| 17 | 9267.0 | 0.093 |
| 18 | 9268.4 | 0.073 |
Due to the one-dimensional nature of the vibration acceleration sensor, which mainly detects the axial vibration signal of spiral bevel gear, the modal shapes and frequencies of the 3rd, 4th, 9th, 10th, 11th, and 14th orders, which are mainly radial vibrations, could not be detected. the experimental modal shapes corresponding to each order in Table 2.
The Modal Assurance Criterion (MAC) value was used to evaluate the geometric correlation between different modal shape vectors. The MAC between two modal shape vectors {φ}r and {φ}s is defined as ,
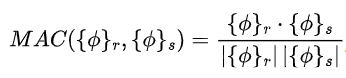
where r and s represent the modal orders.
The Auto-MAC matrix for the experimental modal orders. The diagonal elements are basically 1, and the off-diagonal elements are mostly 0, indicating a low correlation between different modal orders and proving the accuracy of the modal extraction and the high precision of the modal shapes in the modal test.
3. Spiral Bevel Gear Physical Property Modification
3.1 Spiral Bevel Gear Modal Simulation Boundary Conditions
Based on the basic parameters and processing parameters of the spiral bevel gear, the tooth surface was detected, and an accurate finite element model of the large wheel was established. Since the modal test measured the free modal, the data collected by the sensors was the vibration acceleration response in an unconstrained state. To more accurately simulate the experimental boundary conditions, 0-dimensional spring elements (such as CBUSH units) combined with one-dimensional connection elements (such as RBE3 units) were used to simulate the nylon rope suspension. The 0-dimensional spring element has no mass and provides a small amount of stiffness in six degrees of freedom to simulate the nylon rope used for suspension. The RBE3 unit can reduce the impact of the small stiffness introduced by the CBUSH unit on the modal. The finite element model of the spiral bevel gear was then simulated to calculate the modal frequency.
3.2 Physical Property Modification
The objective was to minimize the absolute value of the difference between the simulation modal frequency and the experimental modal frequency. The physical property parameters to be modified were the elastic modulus E, Poisson’s ratio μ, and density ρ. The response surface method, a statistical method for solving multi-variable problems by analyzing multivariate quadratic regression equations, was used. The “three-factor five-level” central composite experimental design method was adopted to calculate the optimal combination of material parameters using the response surface. Since 13 modal frequencies were detected in the modal test, the optimization objective function was ,
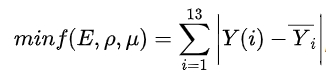
where Yi is the -th experimental modal frequency and Y(i) is the i-th response surface predicted frequency value.
After optimization, the modified physical property parameters were: elastic modulus ,

and Poisson’s ratio μ=0.256.
4. Digital Twin Model Verification and Evaluation
4.1 Modal Frequency Comparison Analysis
Table 3 shows the comparison between the experimental modal frequency and the simulation modal frequency.
| Modal Order | Experimental Frequency (Hz) | Simulation Frequency (Hz) | Relative Error (%) |
|---|---|---|---|
| 1 | 1436.3 | 1441.8 | 0.383 |
| 2 | 1441.1 | 1441.8 | 0.049 |
| 3 | 2559.0 | ||
| 4 | 2559.0 | ||
| 5 | 3400.5 | 3400.7 | 0.006 |
| 6 | 3700.6 | 3700.9 | 0.008 |
| 7 | 3700.7 | 3700.9 | 0.003 |
| 8 | 5195.8 | 5232.5 | 0.706 |
| 9 | 5204.0 | 5232.5 | 0.548 |
| 10 | 6347.1 | ||
| 11 | 6347.1 | ||
| 12 | 6393.0 | 6398.5 | 0.085 |
| 13 | 6403.7 | 6398.5 | -0.07 |
| 14 | 7229.0 | ||
| 15 | 8653.1 | 8760.0 | 1.235 |
| 16 | 8686.5 | 8760.0 | 0.85 |
| 17 | 9267.0 | 9267.0 | 0 |
| 18 | 9268.4 | 9267.0 | -0.015 |
The spiral bevel gear has a cyclic symmetric structure, resulting in multiple pairs of repeated roots that are relatively dense. Among the first 18 modal frequencies, the largest relative error occurred in the 15th order. The 15th and 16th orders are repeated root modes, and theoretically, their frequencies should be the same. However, the relative error in the 15th order was 1.235%, and in the 16th order, it was 0.85%. The consistency between the experimental modal frequency and the simulation modal frequency indicates that by modifying the physical properties of the bevel gear material, the modal frequencies of the spiral bevel gear can be effectively extracted.
4.2 Experimental and Simulation Modal Shape Comparison Analysis
The modal shapes calculated by simulation for each order. Comparing with the experimental modal shapes, it can be seen that the simulation modal shapes are the same as those measured experimentally. For the structure with repeated root modes, the shapes are identical, but there may be an angle difference between the shapes. The consistency between the experimental and simulation modal shapes indicates that the constructed spiral bevel gear digital twin can match the modal characteristics of its physical entity.
The consistency between each order of experimental and simulation modal shapes was evaluated using the Cross Modal Assurance Criterion (Cross MAC), defined as ,
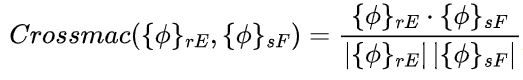
where φrE represents the r-th experimental modal shape and φsF represents the s-th simulation modal shape.
The Cross MAC matrix between each order of experimental and simulation modal shapes. The values on the main diagonal are close to 1, and those on the off-diagonal approach 0, indicating a good consistency between the simulation modal analysis results and the experimental modal analysis results. This is especially true for the 1st and 2nd orders, 6th and 7th orders, 8th and 9th orders, and 12th and 13th orders of repeated root modes.
On the off-diagonal, the Cross MAC value between the 15th experimental and 1st simulation modal shapes is 0.0603, and that between the 16th experimental and 2nd simulation modal shapes is 0.0454. Comparing with the Auto MAC matrix of the experimental modal shapes, on the off-diagonal, the Auto MAC value between the 15th and 1st experimental modal shapes is 0.0737, and that between the 16th and 2nd experimental modal shapes is 0.0558. This indicates that due to experimental factors, the 15th and 16th order modal shapes detected experimentally have a small error, which is consistent with the comparison result of the experimental modal frequency and the simulation modal frequency .
4.3 Frequency Response Function Analysis
The Frequency Response Function (FRF) is the ratio of the response to the excitation and represents the inherent properties of the part structure. The FRF H1 can be expressed as ,
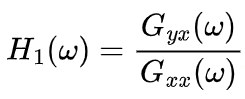
where Gxx is the input auto – power spectrum and Gyx is the input – output energy cross – spectrum.
The FRF was calibrated using decibels (dB), defined as the logarithmic ratio of the measured value to the reference value: ,
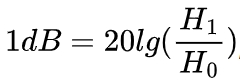
where H0=1X10^-6m/s^2 is the reference value of the vibration acceleration signal.
The comprehensive FRF of four measurement points (38, 46, 5 (missing digit), 63) obtained from the experiment. The peaks of the curve correspond to the detected modal frequencies. Since the spiral bevel gear has a cyclic symmetric structure, the comprehensive FRF curves of the four measurement points coincide very well, indicating good precision in the experimental detection.
The cross – point FRF with the 22nd measurement point as the excitation point and the 38th measurement point as the response point. The frequencies corresponding to the peaks of the FRF curve are the modal frequencies, and the values are consistent with those in Table 2.
Using the hammering force detected in the experiment as the excitation force applied to the 22nd measurement point, the vibration acceleration response of the 38th measurement point was calculated using the spiral bevel gear digital twin model. The modal damping ratios were determined experimentally, and the cross – point FRF curve of this point was calculated according to the formula. The frequencies corresponding to the peaks of the FRF curve are the modal frequencies, and the values are consistent with those in Table 3. it can be seen that the peaks have corresponding peaks, indicating that the modal frequencies detected experimentally can correspond to those analyzed by simulation. The peaks at 2559Hz, 6347Hz, 7229Hz, etc., are not obvious are difficult to identify. Especially for 6347Hz, which is very close to 6399Hz modal frequency, it cannot be identified in the experiment. Through simulation analysis, the modal frequency and its modal shape can be identified. The accurate spiral bevel gear digital twin model can solve the problem of incomplete and inaccurate measurement of some modal parameters due to limitations.
5. Conclusions
5.1 Accuracy of Modal Test
Through the modal test, the modal frequency, modal shape, and frequency response function of the spiral bevel gear in the free modal state were obtained. The correlation analysis of the experimental modal shapes showed that the modal parameters extracted from the test have good accuracy.
5.2 Accuracy of Digital Twin Model
By taking the experimental modal frequencies of each order as the target, the physical properties of the spiral bevel gear were refined, and its digital twin was established. Comparing the simulation analysis with the experimental results, the modal frequency and modal shape showed good consistency, indicating that the constructed digital twin has a high degree of accuracy.
5.3 Verification of Modal Analysis Accuracy
The comparison of the experimental and simulation frequency response functions further verified the accuracy of the modal analysis of the digital twin.
5.4 Identification of Modal Parameters
The modal simulation of the digital twin can not only identify the modal parameters that cannot be tested due to experimental conditions but also, by comparing the Cross MAC of the experimental and simulation modal shapes with the Auto MAC of the experimental modal shapes, identify the experimental modal parameters with errors. This can solve the problem of incomplete and inaccurate measurement of some modal parameters due to conditions.
5.5 Foundation for Dynamic Analysis
By combining experimental and simulation methods and endowing the spiral bevel gear with accurate geometric shapes and physical properties, an effective mapping model of the real physical body is constructed, which lays a foundation for further dynamic characteristic analysis.