
Abstract:
Hypoid gears are crucial components in drive axle systems, often operating under high-speed and heavy-load conditions. Due to significant system deformation and complex tooth surface meshing states, significant load eccentricity can occur under heavy loads. Therefore, it is of great significance to consider the influence of system deformation on the meshing performance of hypoid gears. This paper proposes a method for calculating the meshing efficiency of hypoid gears in drive axles considering system deformation under complex operating conditions.
1. Introduction
Drive axles are vital components in automotive transmissions, and hypoid gears are at the core of these systems. Meshing efficiency is a key performance indicator of drive axles, especially under high-load conditions where gear meshing power loss constitutes a significant portion of the total system power loss. Therefore, accurately calculating gear meshing efficiency is crucial for improving the overall quality of drive axles.
2. Methodology
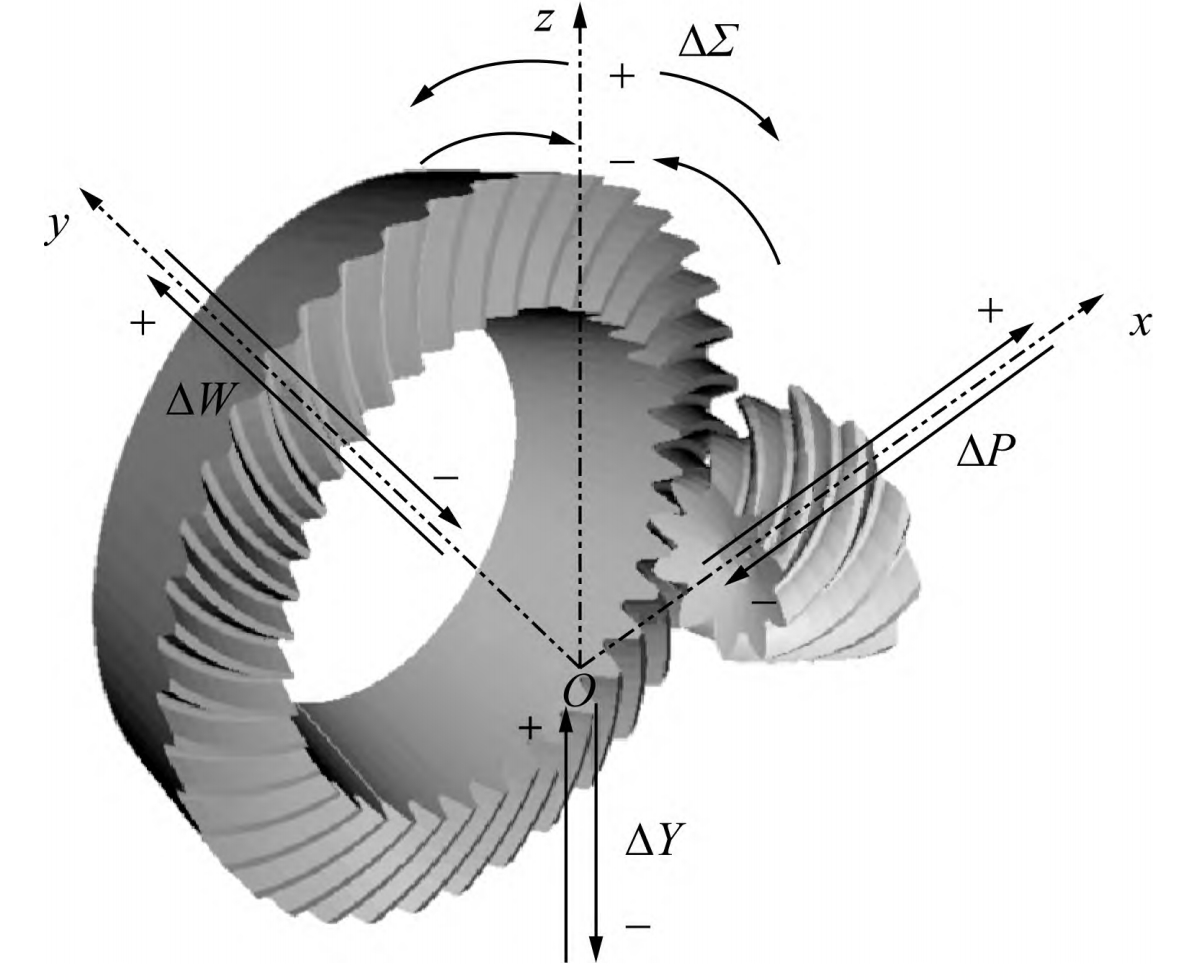
2.1 System Deformation and Gear Meshing Misalignment
Drive axle systems are complex, consisting of shafts, bearings, differentials, housings, and gears. Under load, the drive axle system deforms, causing the gear pair to deviate from ideal meshing conditions, leading to misalignment. This misalignment can result in adverse conditions such as load eccentricity and gear separation, and in extreme cases, gear fracture and drive axle failure.
To address this, a multi-support shaft system coupling analysis model is established to calculate the gear meshing misalignment caused by system deformation under different load conditions.
| Deformation Type | Description |
|---|---|
| Translational Displacement | Displacement along the x, y, z axes |
| Angular Displacement | Rotation around the x, y, z axes |
Table 1: Types of Deformation in the Drive Axle System
The system stiffness equation is formulated as:
K·δ=F
Where K is the system stiffness matrix, δ is the system node displacement, and F is the external force applied to the system. Solving this equation yields the displacement and forces at any node in the system.
2.2 Hypoid Gear Tooth Surface Geometry
The tooth surface geometry of hypoid gears is determined by machine tool processing parameters. By simulating the movement of the cutting tool during processing, the spatial coordinates of points on the tooth surface of the cycloid hypoid gear can be obtained. These coordinates are then transformed into the wheel blank coordinate system using coordinate system transformations.
2.3 Frictional Loaded Tooth Contact Analysis (FLTCA)
FLTCA is an effective method for calculating the meshing performance of gear pairs. To perform FLTCA, the tooth surface load distribution and friction coefficient at each meshing instant must be accurately calculated. A method considering system deformation for FLTCA of drive axle hypoid gears is proposed.
The process involves:
- Calculating the tooth surface geometry using machine tool processing parameters.
- Performing contact analysis under no-load conditions.
- Calculating the instantaneous friction coefficient based on the lubrication state.
- Iteratively solving for the contact pressure distribution and friction coefficient until convergence.
3. Experimental Validation
3.1 Test Setup
A drive axle transmission efficiency test bench is used for experimental validation. The control logic is to control the speed at the input end and the torque at the output end. The meshing efficiency ηg,fric is calculated as:
ηg,fric=poutpout+pg,fric=|Tout|ωout|Tout|ωout+pg,fric
Where pout is the output power, Tout is the output torque, ωout is the output speed, and pg,fric is the total meshing power loss of the gear pair.
3.2 Test Results
| Load Condition | ΔP/μm | ΔW/μm | ΔY/μm | ΔΣ/μrad |
|---|---|---|---|---|
| Forward 20% Full | 101.6 | -17.8 | -128.6 | 0.22 |
| Forward 40% Full | 191.7 | -31.7 | -236.6 | 0.38 |
| Forward 60% Full | 279.8 | -44.9 | -341.3 | 0.51 |
| Forward 80% Full | 366.8 | -57.7 | -444.1 | 0.63 |
| Forward 100% Full | 453.2 | -70.3 | -545.9 | 0.75 |
| Reverse 20% Full | -173.9 | 231.1 | 173.7 | 0.21 |
| Reverse 40% Full | -326.6 | 411.4 | 312.2 | 0.49 |
| Reverse 60% Full | -475.7 | 583.5 | 445.9 | 0.75 |
Table 2: Misalignment Measurements Under Different Load Conditions
Experimental results show good agreement between the calculated and experimental tooth surface contact patterns, validating the accuracy of the tooth surface calculation and no-load contact analysis.
3.3 Meshing Efficiency Results
The meshing efficiency increases nonlinearly with increasing vehicle speed. For example, when the vehicle speed increases from 10 km/h to 80 km/h, the gear meshing efficiency increases by approximately 1%. Similarly, the meshing efficiency varies insignificantly with load power.
4. Conclusion
This paper proposes a method for calculating the meshing efficiency of hypoid gears in drive axles considering system deformation. Experimental results validate the accuracy of the proposed method. Consideration of system deformation leads to more accurate calculations of tooth surface load distribution and meshing efficiency, especially under high-speed and heavy-load conditions. This work provides insights into improving the performance of drive axle hypoid gears.