
Abstract:
The intricacies of the gear honing process, emphasizing the importance of online vibration monitoring in achieving high-quality outcomes. By utilizing the PRAWEMA gear honing equipment as a case study, the paper elucidates the principles of vibration monitoring, data analysis methodologies, and practical applications. The integration of theoretical analysis with empirical data validates the effectiveness of vibration monitoring in ensuring gear surface quality.
1. Introduction
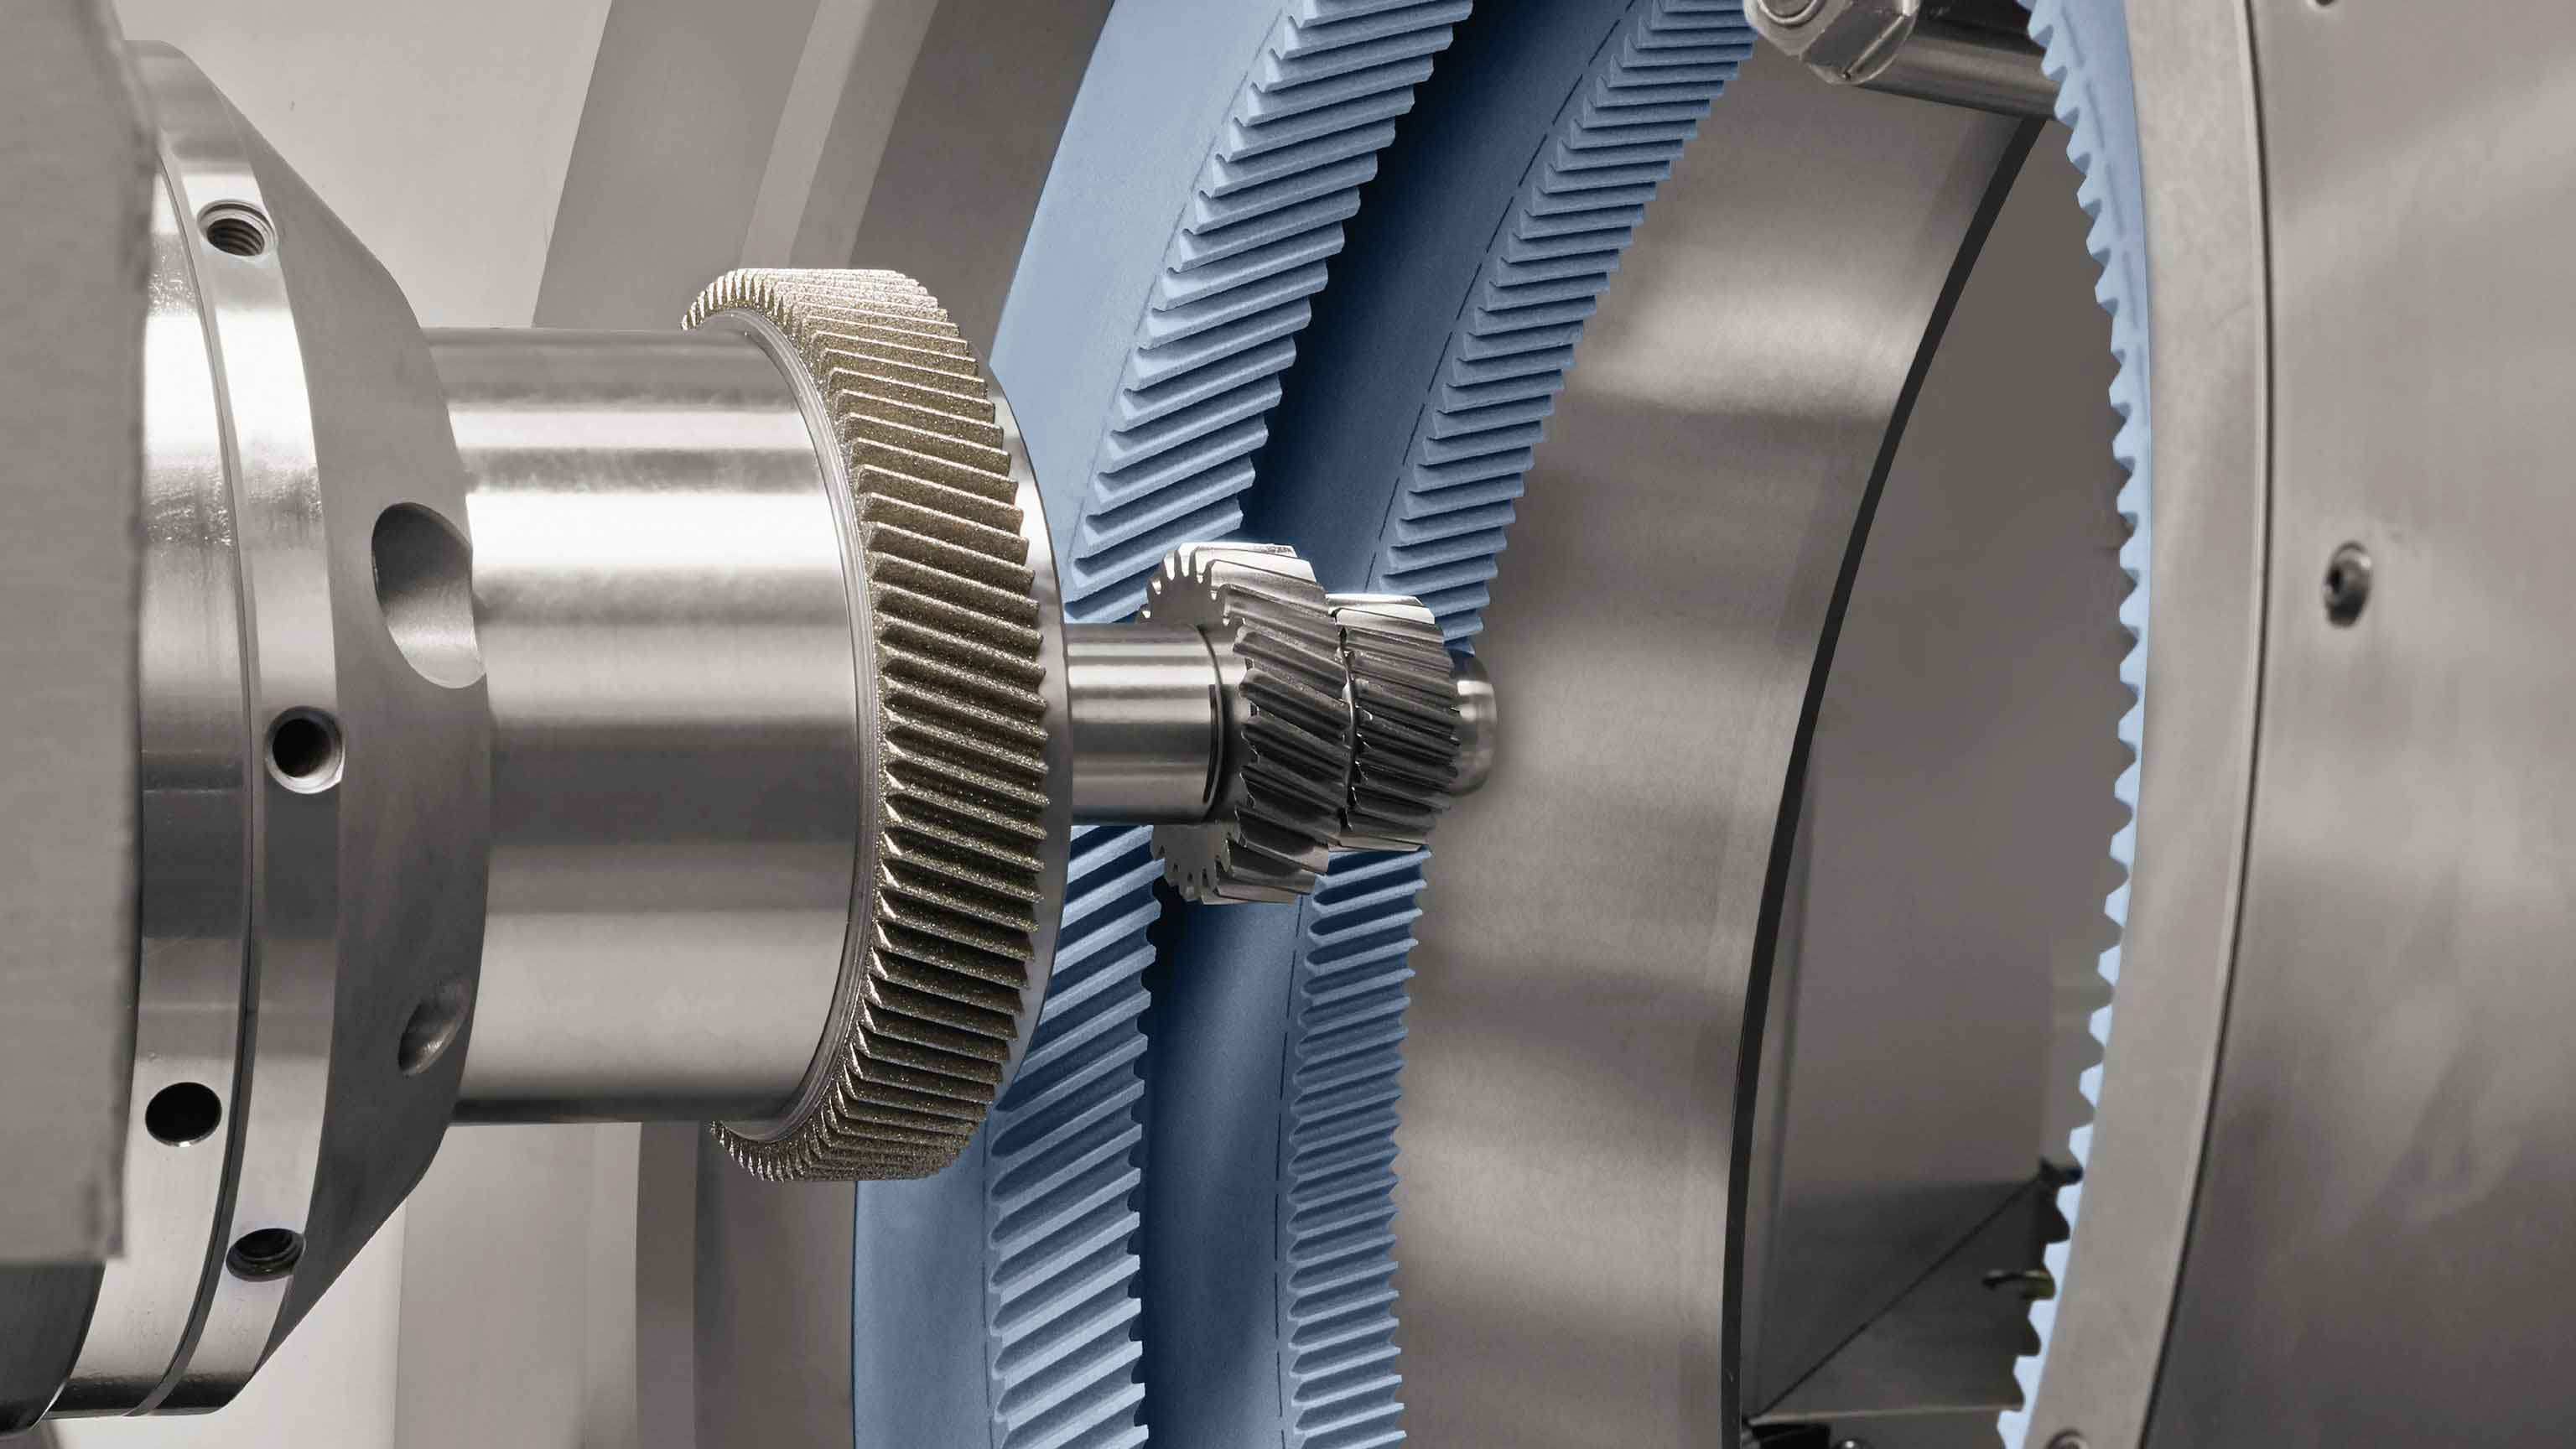
In the automotive industry, the demand for transmission gears with superior NVH (Noise, Vibration, Harshness) performance has necessitated the adoption of advanced manufacturing processes. Gear honing, particularly the robust gear honing technique, has emerged as a preferred finishing process to meet these stringent requirements. However, the process is highly sensitive to毛坯 conditions and allowances, often leading to vibrations due to varying grinding resistances. These vibrations can induce fixed-order amplitudes on the gear surface, compromising NVH performance and leading to complex quality issues. This paper explores the application of online vibration monitoring, specifically the Hybrid Reactive Index (HRI) system of PRAWEMA equipment, to enhance the quality of robust gear honing.
2. Principle of Online Vibration Monitoring
To capture vibration data during the gear honing process, vibration sensors are strategically placed on the primary moving components of the PRAWEMA equipment. These components include:
- C-axis (Workpiece Rotation Axis): Responsible for clamping and rotating the workpiece.
- B-axis (Honing Head Rotation Axis): Responsible for clamping and rotating the honing wheel.
- U-axis (Tailstock Movement Axis): Responsible for supporting and rotating the tailstock.
The sensors collect real-time data, transmitted instantaneously to a PC for storage and analysis.
Table 1: Main Process Stages of Robust Gear Honing
| Stage Code | Stage Name |
|---|---|
| 1-3 | Contact Stages |
| 4 & 10 | Working Paths |
| 5 | Finishing (Polishing) |
3. The Application of HRI System
3.1 HRI Spectrum Interface
The HRI system features a real-time monitoring interface where the horizontal axis represents frequency/order, switchable via settings. The relationship between frequency (f, in Hz), order (O), and axis speed (n, in r/min) is given by:
f=60O⋅n
The vertical axis indicates the amplitude (in mg) corresponding to each frequency/order, displayed through colored curves representing different axes.
Table 2: Known Problem Frequencies and Orders
| Frequency (Hz) | Corresponding Problem |
|---|---|
| 240-300 | Self-resonance frequency of guide rail system |
| 1040 | Self-resonance frequency of spindle housing |
| 1050-1850 | Self-resonance frequency of clamping system |
| 3000-4000 | Self-resonance frequency of clamping system with tailstock involvement |
3.2 HRI analyze+ Interface
The collected vibration data is stored in CSV format on the PC. HRI analyze+ provides multiple ways to view and analyze these CSV files, including tables, curves, and color-coded spectrum lines.
- HriDebugLog Folder: Contains process parameters over time for each workpiece.
- HriLog Folder: Contains an overview of HRI data for each part.
- HriFFTlog Folder: Contains frequency spectrum data for each stage of each workpiece, essential for vibration analysis.
3.3 FFTlog File Analysis
FFTlog files can be imported into HRI analyze+ for detailed analysis. Each FFT file encompasses data from nearly 2 hours, allowing for precise data selection based on time or workpiece count.
Table 3: FFTlog File Analysis Steps
| Step | Description |
|---|---|
| Data Filtering | Select critical axes and stages for analysis. |
| Spectrum Generation | Convert list data into spectral graph format. |
| Slice Analysis | Analyze high-amplitude regions in detail. |
3.4 Practical Applications of HRI and HRI analyze+
3.4.1 Fault Order and Stage Determination
Case Study: A gear honing machine produced gears with an S-shaped tooth profile. Spectral analysis revealed significant vibrations at orders 32-36 during the working path. Comparing this to the spectrum of a qualified gear, the vibration was confirmed as abnormal. The corresponding frequency range (3081-3466 Hz) matched the self-resonance frequency of the clamping system with tailstock involvement. Adjusting the coaxiality of the tooling and tailstock resolved the issue.
3.4.2 Fault Prevention
To prevent future occurrences, limit values can be set in the monitoring window. For instance, setting a limit for amplitudes exceeding 60 mg for order (2±2) during stage 10 on the C-axis would flag risky parts for inspection. This measure effectively prevents defective parts from being released.
4. Conclusion
The general process of vibration analysis for PRAWEMA robust gear honing equipment. In practice, determining which vibrations are normal and which are abnormal requires extensive data accumulation. The comparative analysis method presented is efficient and effective. The vibration monitoring system and analysis techniques discussed have broader implications for fault analysis in other gear finishing processes, such as gear grinding.