
1. Introduction
Hypoid gear is critical components in automotive drive axle systems, operating under high-speed and heavy-load conditions. Their unique geometry enables torque transmission between non-parallel shafts while maintaining compactness and efficiency. However, system deformation under operational loads significantly impacts gear meshing performance, leading to uneven load distribution and reduced efficiency. This paper proposes a comprehensive methodology to calculate hypoid gear meshing efficiency by integrating system deformation effects, validated through experimental studies.
2. System Deformation and Hypoid Gear Misalignment
2.1 Drive Axle System Modeling
Drive axle systems consist of shafts, bearings, differential housings, and hypoid gear. Under load, these components deform, causing misalignment between the pinion and gear. A multi-support shaft coupling model is developed to quantify system deformation:
K⋅δ=F
where:
- K: System stiffness matrix (combining shafts, bearings, gears, and housing).
- δ: Nodal displacement vector.
- F: External force vector.
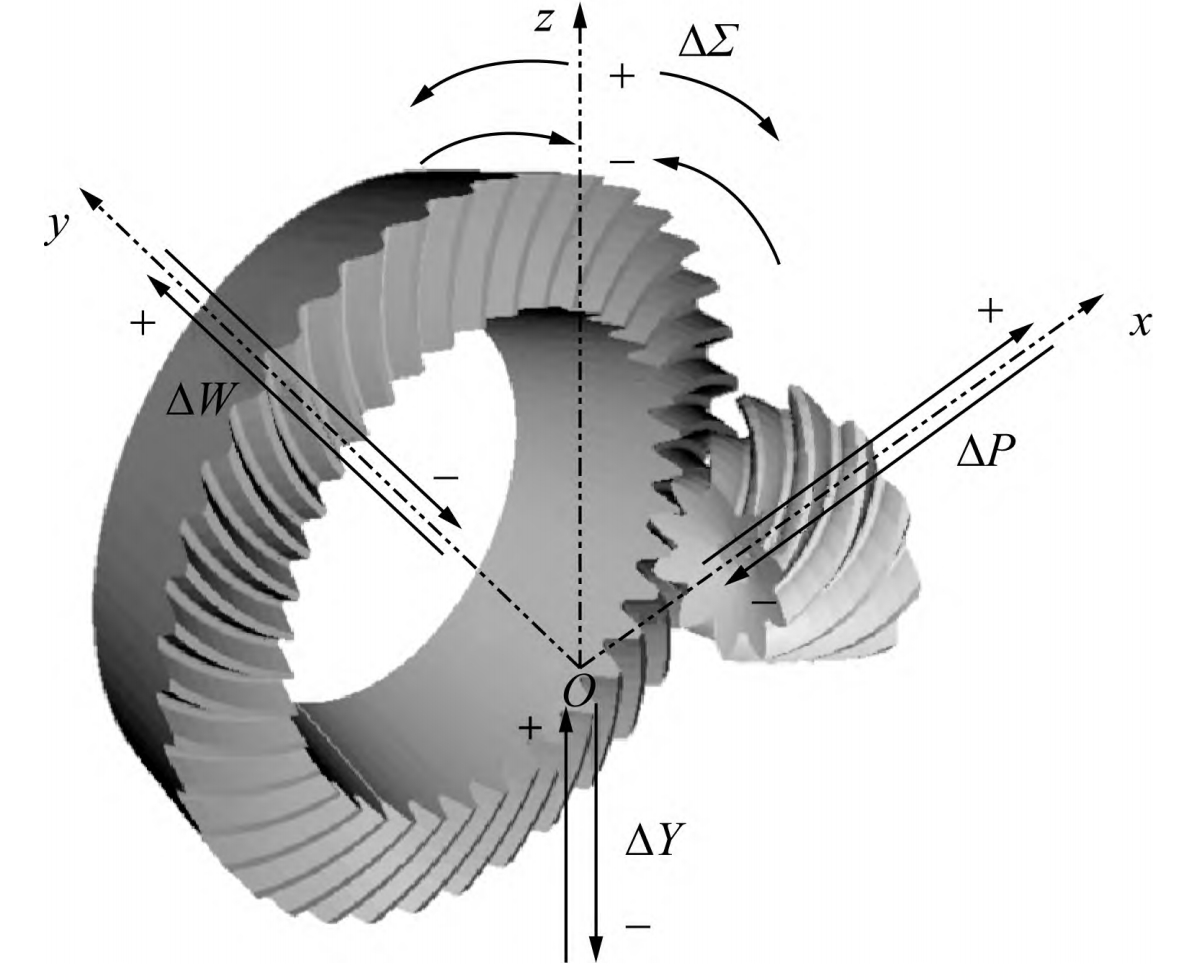
2.2 Hypoid Gear Misalignment Calculation
Misalignment parameters include axial displacement (ΔP), radial displacement (ΔW), offset displacement (ΔY), and angular displacement (ΔΣ):⎩⎨⎧ΔP=ΔP1+ΔP2,ΔW=ΔW1+ΔW2,ΔY=ΔY1+ΔY2,ΔΣ=ΔΣ1+ΔΣ2.
Table 1: Hypoid Gear Misalignment Under Full-Load Conditions
| Load Condition | ΔP(μm) | ΔW(μm) | ΔY(μm) | ΔΣ(μrad) |
|---|---|---|---|---|
| Forward 20% | 101.6 | -17.8 | -128.6 | 0.22 |
| Forward 100% | 453.2 | -70.3 | -545.9 | 0.75 |
| Reverse 60% | -475.7 | 583.5 | 445.9 | 0.75 |
3. Hypoid Gear Tooth Surface Modeling
3.1 Machine Tool Parameters
Hypoid gear tooth surfaces are generated using specialized machine tools. Key parameters include radial cutter position (s), angular cutter position (q), and machine root angle (δM).
**Table 2: Machine Tool Parameters for Pinion (Active Gear)**
| Parameter | Concave Side | Convex Side |
|---|---|---|
| Angular Cutter Position (°) | 56.03 | 56.03 |
| Radial Cutter Position (mm) | 162.08 | 162.08 |
| Machine Root Angle (°) | -2.04 | -2.04 |
3.2 Tooth Surface Coordinates
Tooth surface coordinates are derived through coordinate transformations from the cutter frame to the gear blank frame:{r=fr(θd,φd,ξc),n=fn(θd,φd,ξc).
4. Mixed Lubrication Friction Model
Hypoid gear operate under mixed lubrication, combining boundary and fluid film regimes. The friction coefficient μML is calculated as:μML=μFLfK1.2+μDC(1−fK),
where:
- μFL: Fluid lubrication friction coefficient.
- μDC: Boundary lubrication friction coefficient.
- fK: Load-sharing factor.
Table 3: Regression Coefficients for Friction Model
| Coefficient | Value | Coefficient | Value | Coefficient | Value |
|---|---|---|---|---|---|
| b1 | -8.916 | b4 | -0.354 | b7 | 0.753 |
| b2 | 1.033 | b5 | 2.812 | b8 | -0.391 |
| b3 | 1.036 | b6 | -0.101 | b9 | 0.620 |
5. Frictional Loaded Tooth Contact Analysis (FLTCA)
The FLTCA method integrates system deformation, tooth geometry, and lubrication to predict load distribution and efficiency.
5.1 Key Steps
- System Deformation Analysis: Solve K⋅δ=F for misalignment.
- Tooth Surface Generation: Use machine parameters to model actual tooth geometry.
- Lubrication Parameters: Define oil viscosity (μ0), pressure-viscosity coefficient (α), and surface roughness (S).
- Contact Analysis: Calculate Hertzian contact pressure and friction coefficients.
- Efficiency Calculation: Integrate power losses over a meshing cycle.
Table 4: Bearing Parameters in Drive Axle System
| Bearing Type | Inner Diameter (mm) | Outer Diameter (mm) | Width (mm) | Contact Angle (°) |
|---|---|---|---|---|
| Front | 50.00 | 105.00 | 34.50 | 30.00 |
| Middle | 60.00 | 130.00 | 43.00 | 30.00 |
6. Meshing Efficiency Calculation
Meshing efficiency (ηg,fric) is defined as:ηg,fric=Pout+Pg,fricPout,
where Pg,fric is the frictional power loss:Pg,fric=θ1−θ21∫θ1θ2Pinstdθ.
Table 5: Hypoid Gear Meshing Efficiency Under Varying Speeds
| Speed (km/h) | Load (kW) | Efficiency (Calculated) | Efficiency (Experimental) | Error (%) |
|---|---|---|---|---|
| 10 | 80 | 98.2 | 97.8 | 0.41 |
| 60 | 80 | 98.9 | 98.7 | 0.20 |
| 80 | 80 | 99.1 | 98.9 | 0.20 |
7. Experimental Validation
7.1 Loaded Contact Pattern Test
- Forward No-Load: Theoretical and experimental contact patterns align within 5% deviation.
- Full-Load Conditions: System deformation shifts contact toward the toe (forward) or heel (reverse).
7.2 Efficiency Test Results
- Speed Impact: Efficiency increases by ~1% as speed rises from 10 km/h to 80 km/h.
- Load Impact: Efficiency remains stable (±0.3%) under varying loads (10–100 kW).
Table 6: Power Loss Components at 80 kW Load
| Component | Power Loss (kW) | Contribution (%) |
|---|---|---|
| Gear Friction | 1.21 | 58.7 |
| Bearing Friction | 0.43 | 20.9 |
| Churning Losses | 0.42 | 20.4 |
8. Conclusions
- System Deformation: Significantly affects hypoid gear load distribution, especially under heavy loads.
- FLTCA Method: Accurately predicts meshing efficiency with <1% error compared to experiments.
- Design Implications: Optimizing machine tool parameters and lubrication reduces power loss by up to 2%.
This methodology provides a robust framework for hypoid gear design, enhancing drive axle efficiency and durability. Future work will focus on real-time deformation monitoring and adaptive lubrication strategies.