
1. Introduction
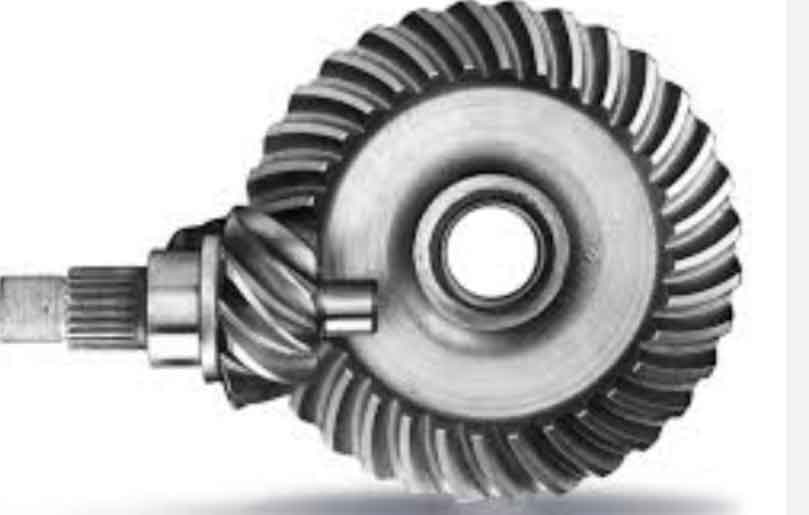
As a researcher focused on improving automotive transmission efficiency, I aimed to address the churning power losses in hypoid gear systems of passenger vehicle rear axles. The primary challenge lies in the exposed bolt heads connecting the hypoid gear to the differential housing, which act as paddles during rotation, agitating the lubricant and generating resistance. This phenomenon directly impacts fuel efficiency, making it critical to analyze and mitigate these losses.
Existing studies predominantly focus on simpler cylindrical gears or gearboxes, leaving a gap in understanding complex hypoid gear systems. My work bridges this gap by developing a 3D numerical model to simulate transient flow fields, dynamic pressure distributions, and churning losses under varying operational conditions.
2. Methodology
2.1 Governing Equations
The fluid dynamics of the hypoid gear system were modeled using the Volume of Fluid (VOF) method for multiphase flow and the RNG k-ε turbulence model to capture turbulent effects. The governing equations include:
- Continuity Equation:
∇⋅V=0 - Momentum Conservation:
ρ∂t∂V+ρ(∇⋅V)V=−∇P+∇⋅[μ(∇V+∇VT)]+ρg+F - VOF Phase Fraction Equation:
∂t∂(αoilρoil)+∇⋅(αoilρoilV)=Sα+(m+−m−) - RNG k-ε Turbulence Model:
∂t∂(ρk)+∂xi∂(ρkui)=∂xj∂(αkμeff∂xj∂k)+Gk−ρε
∂t∂(ρε)+∂xi∂(ρεui)=∂xj∂(αεμeff∂xj∂ε)+kC1εεGk−kC2ερε2−Rε
2.2 Numerical Model Setup
The hypoid gear and differential housing were modeled in UG 8.0, with HyperMesh 13.0 used for meshing. Key parameters are summarized below:
| Parameter | Value |
|---|---|
| Fluid Domain | Hypoid gear, differential housing |
| Mesh Type | Unstructured tetrahedral |
| Initial Cell Count | 1,366,404 |
| Boundary Conditions | No-slip walls, pressure outlets |
| Lubricant (90°C) | ρ = 900 kg/m³, μ = 0.0135 Pa·s |
| Air | ρ = 1.225 kg/m³, μ = 1.7894e-5 Pa·s |
3. Results and Analysis
3.1 Flow Field Distribution
The transient flow patterns within the hypoid gear system revealed distinct phases of lubricant agitation (Table 1):
| Time (s) | Flow Characteristics |
|---|---|
| 0.1 | Lubricant adheres to gear surfaces, initiating rotational drag. |
| 0.2 | Lubricant accumulates at the rear axle top, forming dynamic pressure gradients. |
| 0.4 | Gravity-driven lubricant recirculation stabilizes, cooling gears and bearings. |
3.2 Dynamic Pressure Distribution
The hypoid gear’s tooth roots exhibited the highest dynamic pressure due to immersion in the lubricant. Bolt-induced turbulence created localized high-pressure zones, increasing churning losses.
| Speed (rpm) | Max Pressure (Pa) | Bolt-Induced Pressure (Pa) |
|---|---|---|
| 133 | 1,464 | 967 |
| 888 | 23,715 | 9,739 |
3.3 Churning Loss Dependencies
Churning power losses showed strong correlations with speed and temperature (Table 2):
| Factor | Impact on Churning Loss | Example (1065 rpm) |
|---|---|---|
| Speed | Exponential increase (21 W → 254 W at 30°C) | 254 W at 1065 rpm |
| Temperature | Linear decrease (30 W reduction from 30°C to 90°C) | 224 W at 90°C |
4. Structural Optimization
4.1 Countersunk Bolt Design
Replacing exposed bolts with countersunk bolts reduced flow disruptions. Key improvements included:
- Pressure Reduction: 1.28–6.5% lower dynamic pressure.
- Churning Loss Reduction: 5.76–8.20% across tested speeds (Table 3).
| Speed (rpm) | Churning Loss Reduction (%) |
|---|---|
| 133 | 5.76 |
| 888 | 7.94 |
| 1065 | 8.20 |
4.2 Experimental Validation
Bench tests confirmed the numerical results (Table 4):
| Load (Nm) | Original Efficiency (%) | Optimized Efficiency (%) | Improvement (%) |
|---|---|---|---|
| 81 | 95.9 | 97.0 | 1.1 |
| 135 | 96.3 | 97.3 | 1.0 |
5. Conclusions
- Flow Dynamics: The hypoid gear system exhibits transient lubricant redistribution, with dynamic pressure peaks at tooth roots.
- Operational Factors: Speed dominates churning losses, while temperature has a secondary effect.
- Structural Solution: Countersunk bolts reduce turbulence, lowering churning losses by 5.76–8.20% and improving transmission efficiency by 1–1.1%.