
As a mechanical engineer specializing in gear systems, I recently led a project aimed at enhancing the load-bearing capacity of a worm gear reducer for industrial equipment. The challenge was to achieve a 17% improvement in structural performance without altering the reducer’s external dimensions or material composition. This article details our methodology, analytical process, and results, emphasizing the critical role of mathematical modeling, finite element analysis (FEA), and prototype testing.
1. Introduction
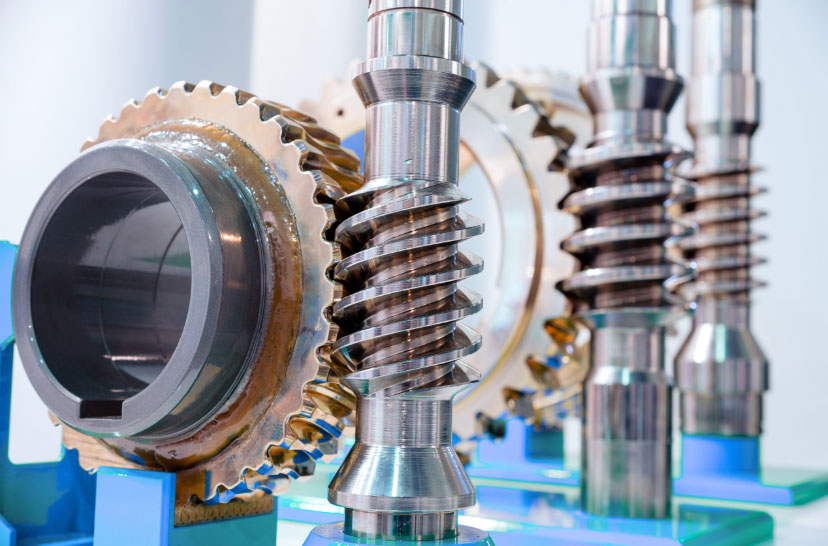
Worm gear reducers are widely used in aerospace, agricultural machinery, and automation systems due to their compact design, high transmission ratios, and smooth operation. However, traditional design methods based on simplified calculations from Gear Transmission Design Manuals often limit the ability to optimize load-bearing capacity. These methods rely heavily on empirical charts and tables, restricting parameter adjustments and hindering systematic optimization.
In this study, we focused on a worm gear reducer with the following specifications:
- Transmission ratio: 35–40
- Rated output torque: ≥2 N·m
- Maximum output torque: ≥20 N·m
- Output speed: ≥60 rpm
Initial prototype testing revealed that the reducer failed at 18 N·m due to tooth fracture and severe wear (Figure 2 in the original document). Our goal was to redesign the gear geometry to enhance bending and contact stress resistance while maintaining the original installation space and material.
2. Pre-Optimization Analysis
2.1 Initial Worm Gear Parameters
The original worm gear pair parameters are summarized in Table 1.
Table 1: Initial Worm Gear Design Parameters
| Parameter | Symbol | Value |
|---|---|---|
| Module (mm) | Mn | 0.5 |
| Worm teeth count | Z1 | 1 |
| Worm gear teeth count | Z2 | 40 |
| Center distance (mm) | a | 13.5 |
| Lead angle (°) | γ | 4.085 |
| Worm pitch diameter (mm) | d1 | 7 |
| Normal pressure angle (°) | αn | 20 |
| Profile shift coefficient | X | 0 |
2.2 Failure Analysis
The root cause of failure was identified as insufficient bending strength of the worm gear teeth. The bending stress formula for worm gears is:
U=mb2Ft2KA≤UP=sF minUlim
where:
- Ft2: Tangential force on the worm gear
- KA: Application factor
- m: Module
- b2: Face width of the worm gear
Conventional solutions, such as increasing the module or using higher-strength materials, were impractical due to space constraints and cost limitations.
3. Optimization Strategy
3.1 Mathematical Model for Bending Strength
We adapted the cylindrical gear bending stress formula to worm gears:
σF=bFmnFtKAKVKFβKFαYFSYβYε
Key coefficients influencing bending stress include:
- KV: Dynamic factor
- KFβ: Face load distribution factor
- KFα: Transverse load distribution factor
- YFS: Form factor
- Yβ: Helix angle factor
- Yε: Contact ratio factor
3.2 Optimization Variables
To reduce bending stress, we focused on increasing the contact ratio (εα) by adjusting the pressure angle and profile shift coefficient. The contact ratio formula is:
εα=mπcosαx21da22−db22+m(1−X2)/sinαx−0.5d2sinαx
Table 2: Optimized Worm Gear Parameters
| Parameter | Symbol | Initial Value | Optimized Value |
|---|---|---|---|
| Worm gear teeth count | Z2 | 40 | 39 |
| Normal pressure angle (°) | αn | 20 | 14.5 |
| Profile shift coefficient | X | 0 | 0.5 |
| Contact ratio | εα | 1.5480 | 3.5855 |
4. Finite Element Analysis (FEA)
4.1 Model Setup
Using ANSYS, we constructed a 3D model of the worm gear reducer and performed static structural analysis. Key steps included:
- Mesh generation: Element size = 0.05 mm (Figure 4 in the original document).
- Boundary conditions: Fixed worm shaft, 20 N·m torque applied to the worm gear.
4.2 Simulation Results
**Table 3: FEA Results Comparison (20 N·m Load)**
| Parameter | Initial Design | Optimized Design | Improvement |
|---|---|---|---|
| Gear tooth contact stress (MPa) | 4,404 | 1,689 | 61.6% |
| Gear root bending stress (MPa) | 2,225 | 1,845 | 17.1% |
| Gear tooth deformation (mm) | 0.0475 | 0.0425 | 10.5% |
| Worm root bending stress (MPa) | 1,923 | 1,862 | 3.2% |
The optimized design reduced bending stress by 17% and contact stress by 61.6%, significantly enhancing load-bearing capacity.
5. Prototype Testing
A prototype was tested under the load spectrum shown in Figure 8 (original document). Key outcomes:
- Maximum torque: 20 N·m sustained for 1 minute without failure.
- Output speed: 65 rpm, exceeding the 60 rpm requirement.
- Post-test inspection: Minor tooth surface wear (Figure 9 in the original document), confirming the FEA predictions.
6. Conclusion
By re-engineering the worm gear geometry and leveraging ANSYS FEA, we achieved a 17% improvement in load-bearing capacity while maintaining the reducer’s original size and material. This approach provides a systematic framework for optimizing worm gear reducers in applications requiring high torque density and reliability.