
1. Introduction
The electric vehicle (EV) gearbox plays a pivotal role in power transmission systems, with gear dynamics directly influencing reliability, NVH (Noise, Vibration, and Harshness) performance, and energy efficiency. As global emphasis on clean energy intensifies, optimizing gear systems for EVs has become critical. This study focuses on vibration reduction and profile modification of a three-speed EV gearbox to enhance operational stability and longevity.
2. Dynamic Modeling of Gear Transmission System
2.1 Structural Configuration
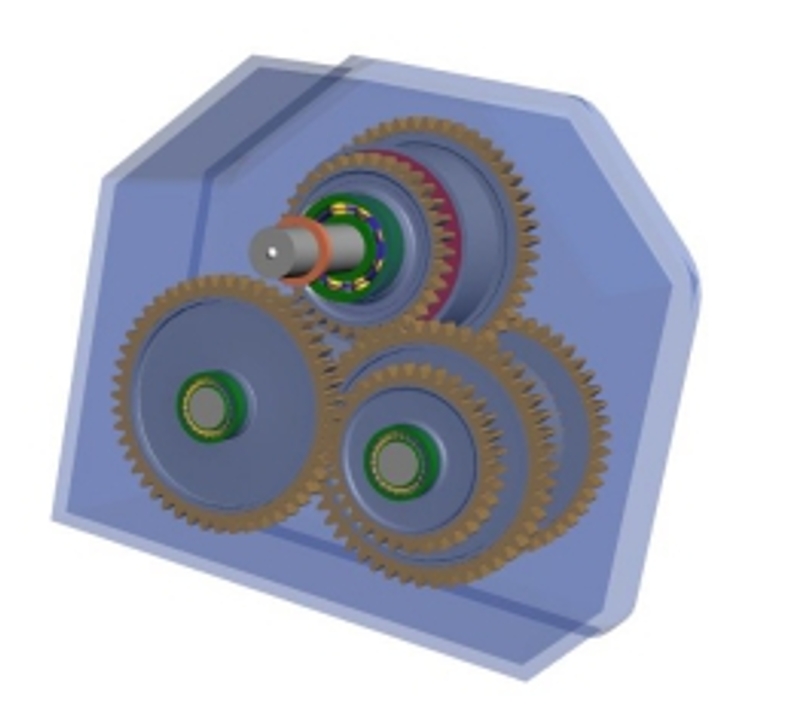
The three-speed EV gearbox comprises input, secondary, tertiary, and output shafts, with four gear pairs enabling torque transmission. Clutch engagement controls gear shifts, as summarized in Table 1.
Table 1: Operational states of three-speed EV gearbox
| Gear Pair 1 | Gear Pair 2 | Gear Pair 3 | Gear Pair 4 | Clutch 1 | Clutch 2 | Clutch 3 |
|---|---|---|---|---|---|---|
| Engaged | Engaged | Engaged | Engaged | Engaged | Disengaged | Disengaged |
| Engaged | Disengaged | Disengaged | Engaged | Disengaged | Engaged | Disengaged |
| Engaged | Disengaged | Disengaged | Disengaged | Disengaged | Disengaged | Engaged |
2.2 Torsional Vibration Model
The torsional dynamics of gear pairs are modeled using:
Ipθ¨p+Rpcm(Rpθ˙p−Rgθ˙g)+Rpkm(Rpθp−Rgθg)=Tp
Igθ¨g+Rgcm(Rgθ˙g−Rpθ˙p)+Rgkm(Rgθg−Rpθp)=−Tg
where Ip,Ig are moments of inertia, Rp,Rg are base radii, and km,cm denote meshing stiffness and damping.
2.3 Helical Gear Coupling Model
For helical gears, axial and bending vibrations are incorporated:
mpy¨p+cpyy˙p+kpyyp=−Fy
Ipθ¨p=−FyRp−Tp
mgy¨g+cgyy˙g+kgyyg=Fy
Igθ¨g=FyRg−Tg
Axial forces Fz are derived from helical angle β:
Fz=Fytanβ
3. Modal Analysis and Transient Dynamics
3.1 Finite Element Modal Analysis
Using ANSYS Workbench, the first 10 natural frequencies of the helical gear system were extracted (Table 2).
Table 2: Natural frequencies of helical gear system
| Mode | Frequency (Hz) | Primary Vibration Mode |
|---|---|---|
| 1 | 1,272 | Circumferential |
| 2 | 1,682.3 | Radial |
| 3 | 1,779.1 | Bending |
| 4 | 2,031.3 | Radial |
| 5 | 2,370.7 | Axial folding |
The meshing frequency fm was calculated for load conditions (25%, 50%, 75%, 100%):
fm=60nz
where n = input speed (1,000–2,000 rpm), z = teeth count. Results confirmed no resonance risks (Table 3).
Table 3: Meshing frequencies under load conditions
| Load | Speed (rpm) | Teeth Count | fm (Hz) |
|---|---|---|---|
| 25% | 1,000 | 33 | 550 |
| 50% | 1,000 | 33 | 550 |
| 75% | 2,000 | 33 | 1,100 |
| 100% | 2,000 | 33 | 1,100 |
3.2 Transient Dynamic Response
Transient analysis revealed stress distribution during meshing. Peak von Mises stress reached 450 MPa at tooth roots, while contact pressure peaked at 1.23 GPa.
4. MASTA-Based Gearbox Simulation
4.1 Static Analysis
Load spectra (Table 4) validated gear safety factors (SF) and damage rates (DR):
Table 4: Load spectrum for three-speed gearbox
| Load | Duration (hr) | Torque (Nm) | Speed (rpm) |
|---|---|---|---|
| 25% | 60 | 400 | 1,000 |
| 50% | 30 | 600 | 1,000 |
| 75% | 60 | 800 | 2,000 |
| 100% | 30 | 1,000 | 2,000 |
Table 5: Gear safety factors (ISO 6336)
| Gear Pair | Contact SF | Bending SF |
|---|---|---|
| 1 | 1.65–1.70 | 1.34–1.38 |
| 2 | 1.47–1.52 | 1.15–1.68 |
| 3 | 1.40–1.45 | 1.41–1.45 |
| 4 | 1.34–1.38 | 1.33–1.38 |
4.2 Transmission Error (TE) Analysis
TE, a key NVH indicator, was reduced through macro-micro optimization:
TE=Rgθg−Rpθp−e(t)
where e(t) accounts for manufacturing errors. Pre-optimization TE peaks reached 9.2 µm, exceeding the 2 µm threshold.
5. Gear Profile Optimization
5.1 Macro-Parameter Optimization
Gear parameters were optimized for maximum contact ratio ε:
ε=εα+εβ=2π1[z1(tanαa1−tanα′)+z2(tanαa2−tanα′)]+πmnbsinβ
Constraints included sliding ratio (η≤3), tip thickness (sa≥0.25mn), and transition curve non-interference.
Table 6: Optimized gear parameters
| Gear Pair | Module | Teeth | Helix Angle (°) | Pressure Angle (°) |
|---|---|---|---|---|
| 1 | 4.5 | 37/52 | 5 | 20 |
| 2 | 4.54 | 36/53 | 5.8 | 20 |
| 3 | 4.6 | 37/56 | 7.5 | 20 |
| 4 | 4.43 | 33/56 | 11.3 | 20 |
5.2 Micro-Crowning
Combined profile and lead crowning minimized TE fluctuations:
- Profile crowning: 3.3–6.9 µm
- Lead crowning: 5.6–10.4 µm
Table 7: Crowning parameters
| Gear Pair | Lead Crowning (µm) | Profile Crowning (µm) |
|---|---|---|
| 1 | 5.6 | 3.3 |
| 2 | 8.5 | 5.7 |
| 3 | 7.2 | 5.2 |
| 4 | 10.4 | 6.9 |
Post-optimization TE peaks dropped by 70–83%, while contact stress uniformity improved by 8–27%.
6. Conclusion
This study demonstrates that macro-micro optimization of the electric vehicle gearbox significantly enhances NVH performance. Key achievements include:
- 70–83% reduction in transmission error fluctuations
- 8–27% improvement in contact stress distribution
- Validation of helical gear dynamics under multi-load conditions
Future work will integrate experimental validation and expand optimization to shafts/bearings for holistic NVH refinement.