
This study investigates the impact of structural parameters and fluid properties on the performance of cylindrical gear flowmeters using computational fluid dynamics (CFD) simulations. A six-degree-of-freedom motion model was developed to analyze leakage characteristics under varying assembly clearances and fluid viscosities.
Theoretical Framework
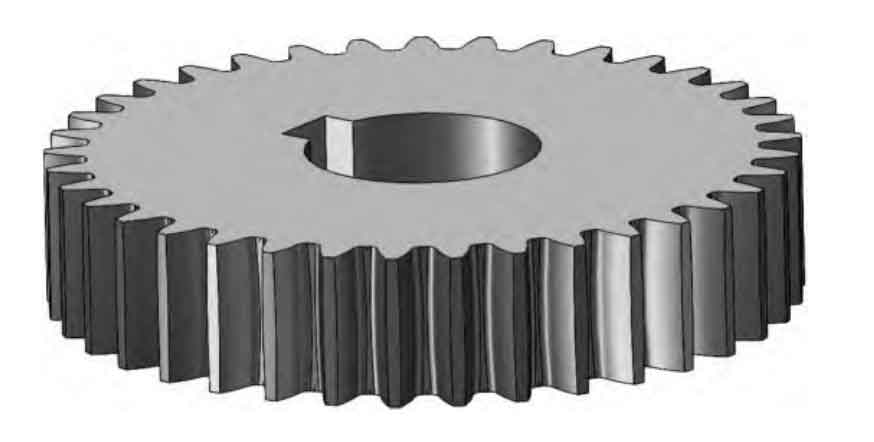
The working principle of cylindrical gear flowmeters relies on the displacement mechanism formed by two meshing gears. The theoretical flow rate \( q_t \) is calculated as:
\[ q_t = 2Nvn \]
where \( N \) represents the number of teeth, \( v \) denotes the unit chamber volume, and \( n \) is the rotational speed. The actual flow measurement \( q_v \) differs due to leakage flows, primarily occurring through three paths:
- Tip clearance leakage
- End clearance leakage
- Meshing point leakage
Numerical Methodology
A 6-DOF dynamic mesh model was implemented to simulate gear rotation and fluid interaction. Key geometric parameters of the DN16 cylindrical gear flowmeter are summarized in Table 1.
| Component | Dimension |
|---|---|
| Inlet/Outlet Pipe Length | 20 mm |
| Tip Clearance (Bilateral) | 180 μm |
| End Clearance (Bilateral) | 140 μm |
| Gear Meshing Clearance | 22.36 μm |
The mesh configuration emphasizes critical leakage paths with 18 layers in clearance regions. The governing equations for fluid motion and gear dynamics include:
\[ \frac{\partial \rho}{\partial t} + \nabla \cdot (\rho \mathbf{u}) = 0 \]
\[ \frac{\partial (\rho \mathbf{u})}{\partial t} + \nabla \cdot (\rho \mathbf{u} \mathbf{u}) = -\nabla p + \nabla \cdot \tau \]
\[ I \cdot \frac{d\omega}{dt} + \omega \times (I \cdot \omega) = T \]
Clearance Effects Analysis
Six configurations with different clearances were simulated to evaluate performance metrics. The linearity error \( E_L \) is defined as:
\[ E_L = \frac{K_{\text{max}} – K_{\text{min}}}{K_{\text{max}} + K_{\text{min}}} \times 100\% \]
| Model | Tip Clearance (μm) | End Clearance (μm) | Average Meter Factor (L⁻¹) | Linearity Error (%) |
|---|---|---|---|---|
| 1 | 180 | 140 | 1074.95 | 0.63 |
| 2 | 170 | 130 | 1068.42 | 0.32 |
| 3 | 160 | 120 | 1066.81 | 0.25 |
| 4 | 150 | 110 | 1065.94 | 0.19 |
| 5 | 140 | 100 | 1064.62 | 0.13 |
| 6 | 120 | 80 | 1063.78 | 0.18 |
The optimal configuration (Model 5) demonstrates minimized leakage through improved sealing while maintaining reasonable pressure losses. The leakage flow rate \( \Delta q \) follows:
\[ \Delta q = q_v – q_t = \frac{\pi \delta^3 \Delta p}{12\mu L} \]
where \( \delta \) represents clearance height, \( \Delta p \) pressure difference, and \( \mu \) dynamic viscosity.
Viscosity Effects Investigation
Simulations with YH-15 hydraulic oil at different temperatures revealed viscosity-dependent characteristics:
| Kinematic Viscosity (mm²/s) | Average Meter Factor (L⁻¹) | Linearity Error (%) |
|---|---|---|
| 5.6 | 1058.74 | 0.87 |
| 7.1 | 1061.35 | 0.65 |
| 9.7 | 1063.02 | 0.49 |
| 13.9 | 1065.18 | 0.31 |
| 22.5 | 1067.43 | 0.15 |
| 42.7 | 1069.11 | 0.03 |
Higher viscosity fluids (42.7 mm²/s) achieve superior linearity (0.03%) due to reduced leakage proportion. The dimensionless leakage coefficient \( C_L \) follows:
\[ C_L = \frac{\Delta q}{q_t} \propto \frac{1}{\sqrt{Re}} \]
where Reynolds number \( Re \) decreases with increasing viscosity.
Conclusions
- Optimal cylindrical gear flowmeter performance occurs at 140 μm tip clearance and 100 μm end clearance
- Linearity error decreases exponentially with increasing fluid viscosity
- CFD simulations effectively predict leakage characteristics and meter factor deviations
- Pressure loss minimization requires balanced clearance reduction and viscous dissipation management
This investigation provides critical guidelines for cylindrical gear flowmeter design optimization and viscosity compensation strategies in practical applications.