
This study investigates the power loss mechanisms in hypoid gear-driven commercial vehicle axles through theoretical modeling and experimental validation. By analyzing geometric parameters, lubrication characteristics, and bearing configurations, we establish a comprehensive efficiency prediction framework with practical correction factors.
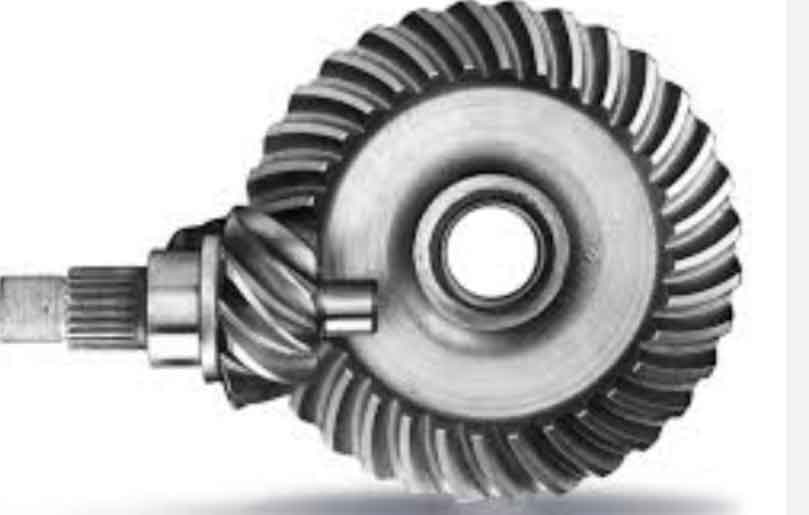
1. Power Loss Mechanisms in Hypoid Gear Systems
The total power loss ($P_{\text{total}}$) in drive axles consists of load-dependent and load-independent components:
$$ P_{\text{total}} = P_L + P_N $$
Where load-dependent losses ($P_L$) include:
$$ P_L = P_G + P_B $$
- $P_G$: Hypoid gear meshing loss
- $P_B$: Bearing friction loss
Load-independent losses ($P_N$) comprise:
$$ P_N = P_S + P_W + P_H $$
- $P_S$: Seal friction
- $P_W$: Windage/churning losses
- $P_H$: Pumping losses
2. Hypoid Gear Efficiency Modeling
The meshing efficiency of hypoid gears is calculated as:
$$ \eta_G = 1 – \frac{T_2}{9549P_{\text{in}}} \left( \frac{\tan\psi_p + \tan\psi_g}{\cos\phi_n} + 0.15\mu\sqrt{\frac{2E}{D_2}} \right) $$
| Parameter | Symbol | Range |
|---|---|---|
| Input torque | $T_2$ | 50-250 Nm |
| Friction coefficient | $\mu$ | 0.01-0.12 |
| Spiral angle | $\psi$ | 25°-45° |
3. Bearing Loss Analysis
Bearing power loss combines load and speed-dependent components:
$$ P_B = \frac{(M_1 + M_2 + M_3)n}{9549} $$
Where:
$$ M_1 = f_1F_\beta d_m $$
$$ M_2 = f_2F_a d_m $$
$$ M_3 = 160 \times 10^{-7}d_m^3 $$
| Bearing Type | $f_1$ | $f_2$ |
|---|---|---|
| Tapered Roller | 0.0002 | 0.0003 |
| Cylindrical Roller | 0.0001 | 0.00015 |
4. Lubrication Effects on Efficiency
Oil viscosity significantly impacts churning losses:
$$ P_W = 3.37 \times 10^{-6}\rho\nu^{0.6}n^{1.8}D_m^{2.8}b^{0.25} $$
Experimental results show:
| Oil Grade | 40°C Viscosity (cSt) | Efficiency Impact |
|---|---|---|
| 75W-90 | 94.2 | -0.8% |
| 85W-140 | 192 | -1.6% |
5. Efficiency Optimization Strategies
Key improvement measures for hypoid gear efficiency:
| Method | Efficiency Gain | Cost Impact |
|---|---|---|
| Surface Finish (Ra 0.8μm) | +0.46% | Medium |
| Low-Friction Bearings | +0.42% | High |
| Oil Level Reduction | +0.12% | Low |
6. Power Loss Correction Model
The empirical correction factor ($K_{\text{loss}}$) for different operating conditions:
$$ K_{\text{loss}} = 6e^{-0.4x} – 4e^{-0.7x} + e^{-0.4x^2} – 0.013x + 1.6 $$
Where $x$ represents input power percentage (50-250kW).
7. Experimental Validation
Test results show strong correlation between theoretical and measured efficiency:
| Speed Ratio | Input Power (kW) | Theoretical | Measured |
|---|---|---|---|
| 3.9:1 | 200 | 95.2% | 94.8% |
| 3.4:1 | 200 | 96.1% | 95.7% |
The developed models enable accurate prediction of hypoid gear efficiency with less than 1% deviation across operating conditions, providing valuable insights for energy-efficient drivetrain design.