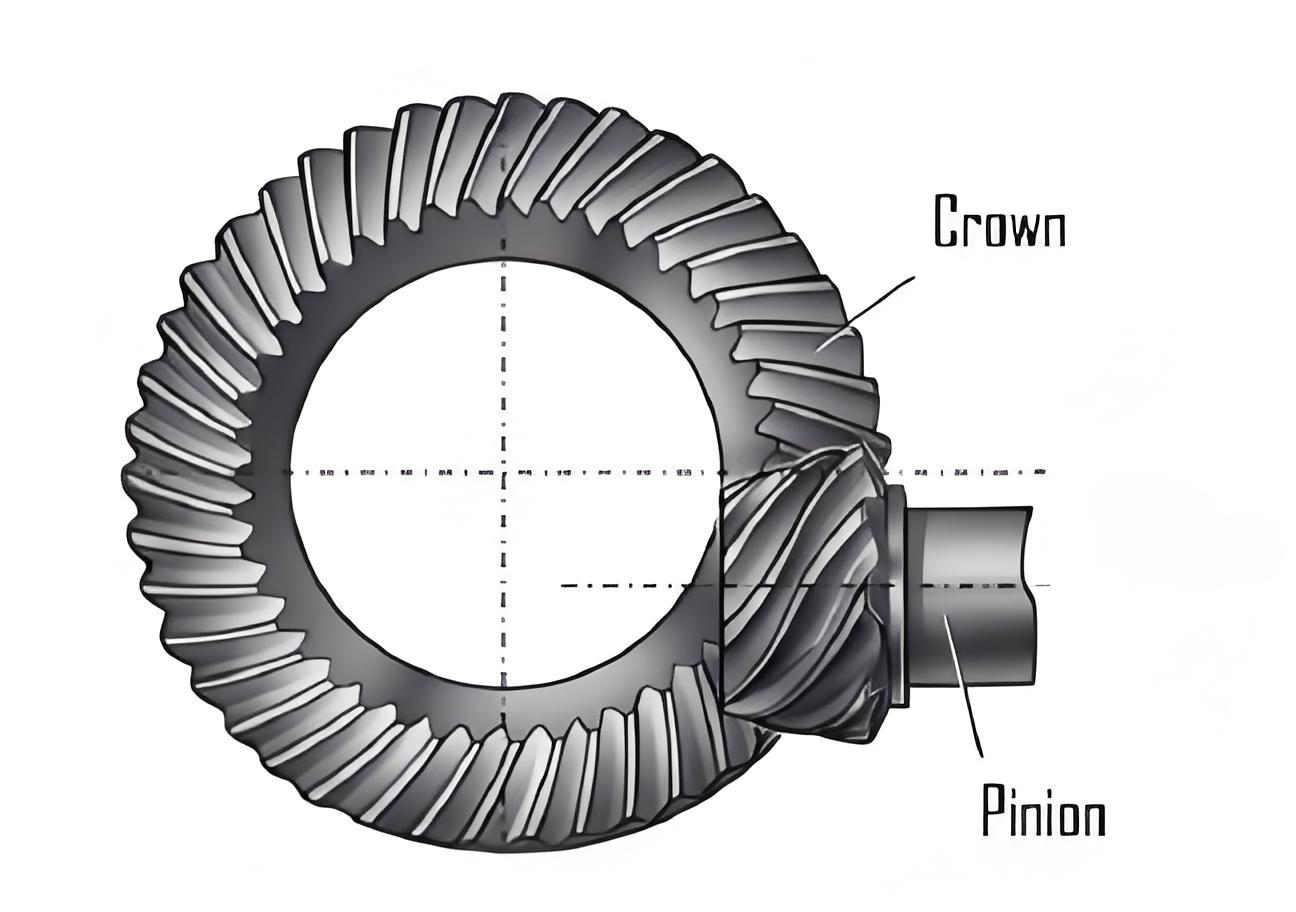
This study investigates the dynamic meshing characteristics of high-reduction hypoid gears (HRH) through geometric modeling, kinematic simulation, finite element analysis, and experimental validation. By integrating advanced topological modification techniques and precision manufacturing processes, the research establishes a systematic methodology for optimizing hypoid gear performance in high-load, high-precision transmission systems.
1. Mathematical Modeling of Hypoid Gear Tooth Surfaces
The geometric design of HRH gears follows the hypoid gear meshing principle with modified pitch cone configuration. The longitudinal displacement coefficient $k_p$ modifies the pitch cone relationship:
$$ \Delta R = \frac{b_2 k_p}{R_2} $$
$$ d_{e2} = d_2 – b_2(1 – k_p)\tan\delta_2 $$
Critical geometric parameters for a 3:60 hypoid gear pair are summarized in Table 1.
| Parameter | Pinion | Gear |
|---|---|---|
| Number of teeth | 3 | 60 |
| Spiral angle (°) | 72 | 32.8983 |
| Pitch cone angle (°) | 10.9919 | 75.8605 |
| Outer diameter (mm) | 27.9074 | 145 |
| Whole depth (mm) | 3.614 | 3.614 |

2. Topological Modification of Point-Contact Tooth Surfaces
The cutter profile modification for gear manufacturing combines bidirectional curvature correction:
$$ w_c = 0.5a_1(u_c – u_0)^2 $$
$$ \alpha_2(u_c) = \alpha_0 + \arctan(w’_c) $$
The ease-off surface model reveals meshing characteristics through differential geometry analysis:
$$ z_d = 0.5k_a x_d^2 + 0.5k_b y_d^2 $$
$$ \lambda = \arctan\left(\frac{k_a – k_b}{2\tau}\right) $$
| Parameter | Pinion | Gear |
|---|---|---|
| Cutter radius (mm) | 37.6 | 37.4 |
| Pressure angle (°) | 20.5 | 19.0 |
| Radial setting (mm) | 51.9712 | 53.1513 |
| Machine center (mm) | -0.2667 | 5.3428 |
3. Kinematic Simulation Analysis
The dynamic model in ADAMS reveals vibration characteristics under different operating conditions. The impact force function calculates meshing forces:
$$ F_{impact} = k(q_1 – q)^e – c_{max}\dot{q}\text{step}(q,q_1 – d,1,q_1,0) $$
Key vibration amplitudes at different speeds and loads are compared:
| Harmonic Order | 710rpm/50Nm | 710rpm/200Nm | 2100rpm/200Nm |
|---|---|---|---|
| 1× | 953.6 | 226.3 | 698.1 |
| 2× | 2896.6 | 591.2 | 1183.3 |
| 3× | 788.7 | 312.7 | 565.9 |
4. Finite Element Contact Analysis
The ABAQUS model calculates time-varying contact stresses and bending stresses:
$$ \sigma_H = \sqrt{\frac{F_n}{\pi b}\left(\frac{1}{\rho_1} + \frac{1}{\rho_2}\right)} $$
$$ \sigma_F = \frac{F_t}{b m_n}\left(0.25 + 0.75\frac{h_a}{m_n}\right) $$
Maximum stress values under different loads demonstrate load-sharing characteristics:
| Load (Nm) | Contact Stress (MPa) | Bending Stress (MPa) |
|---|---|---|
| 100 | 1295.26 | 280.24 |
| 200 | 1459.34 | 466.25 |
| 300 | 1674.82 | 634.04 |
5. Experimental Validation
Vibration testing reveals meshing frequency components and transmission efficiency trends:
$$ \eta = \left(1 – \frac{P_{in} – P_{out}}{P_{in}}\right) \times 100\% $$
Key experimental results include:
| Speed (rpm) | 1500 | 1800 | 2400 |
|---|---|---|---|
| Peak Efficiency (%) | 81.35 | 82.09 | 80.88 |
| Minimum Efficiency (%) | 76.97 | 78.55 | 76.80 |
The research establishes a complete methodology for hypoid gear design and performance prediction, demonstrating good consistency between simulation and experimental results. The proposed topological modification strategy effectively improves load distribution while maintaining high transmission efficiency in hypoid gear systems.
