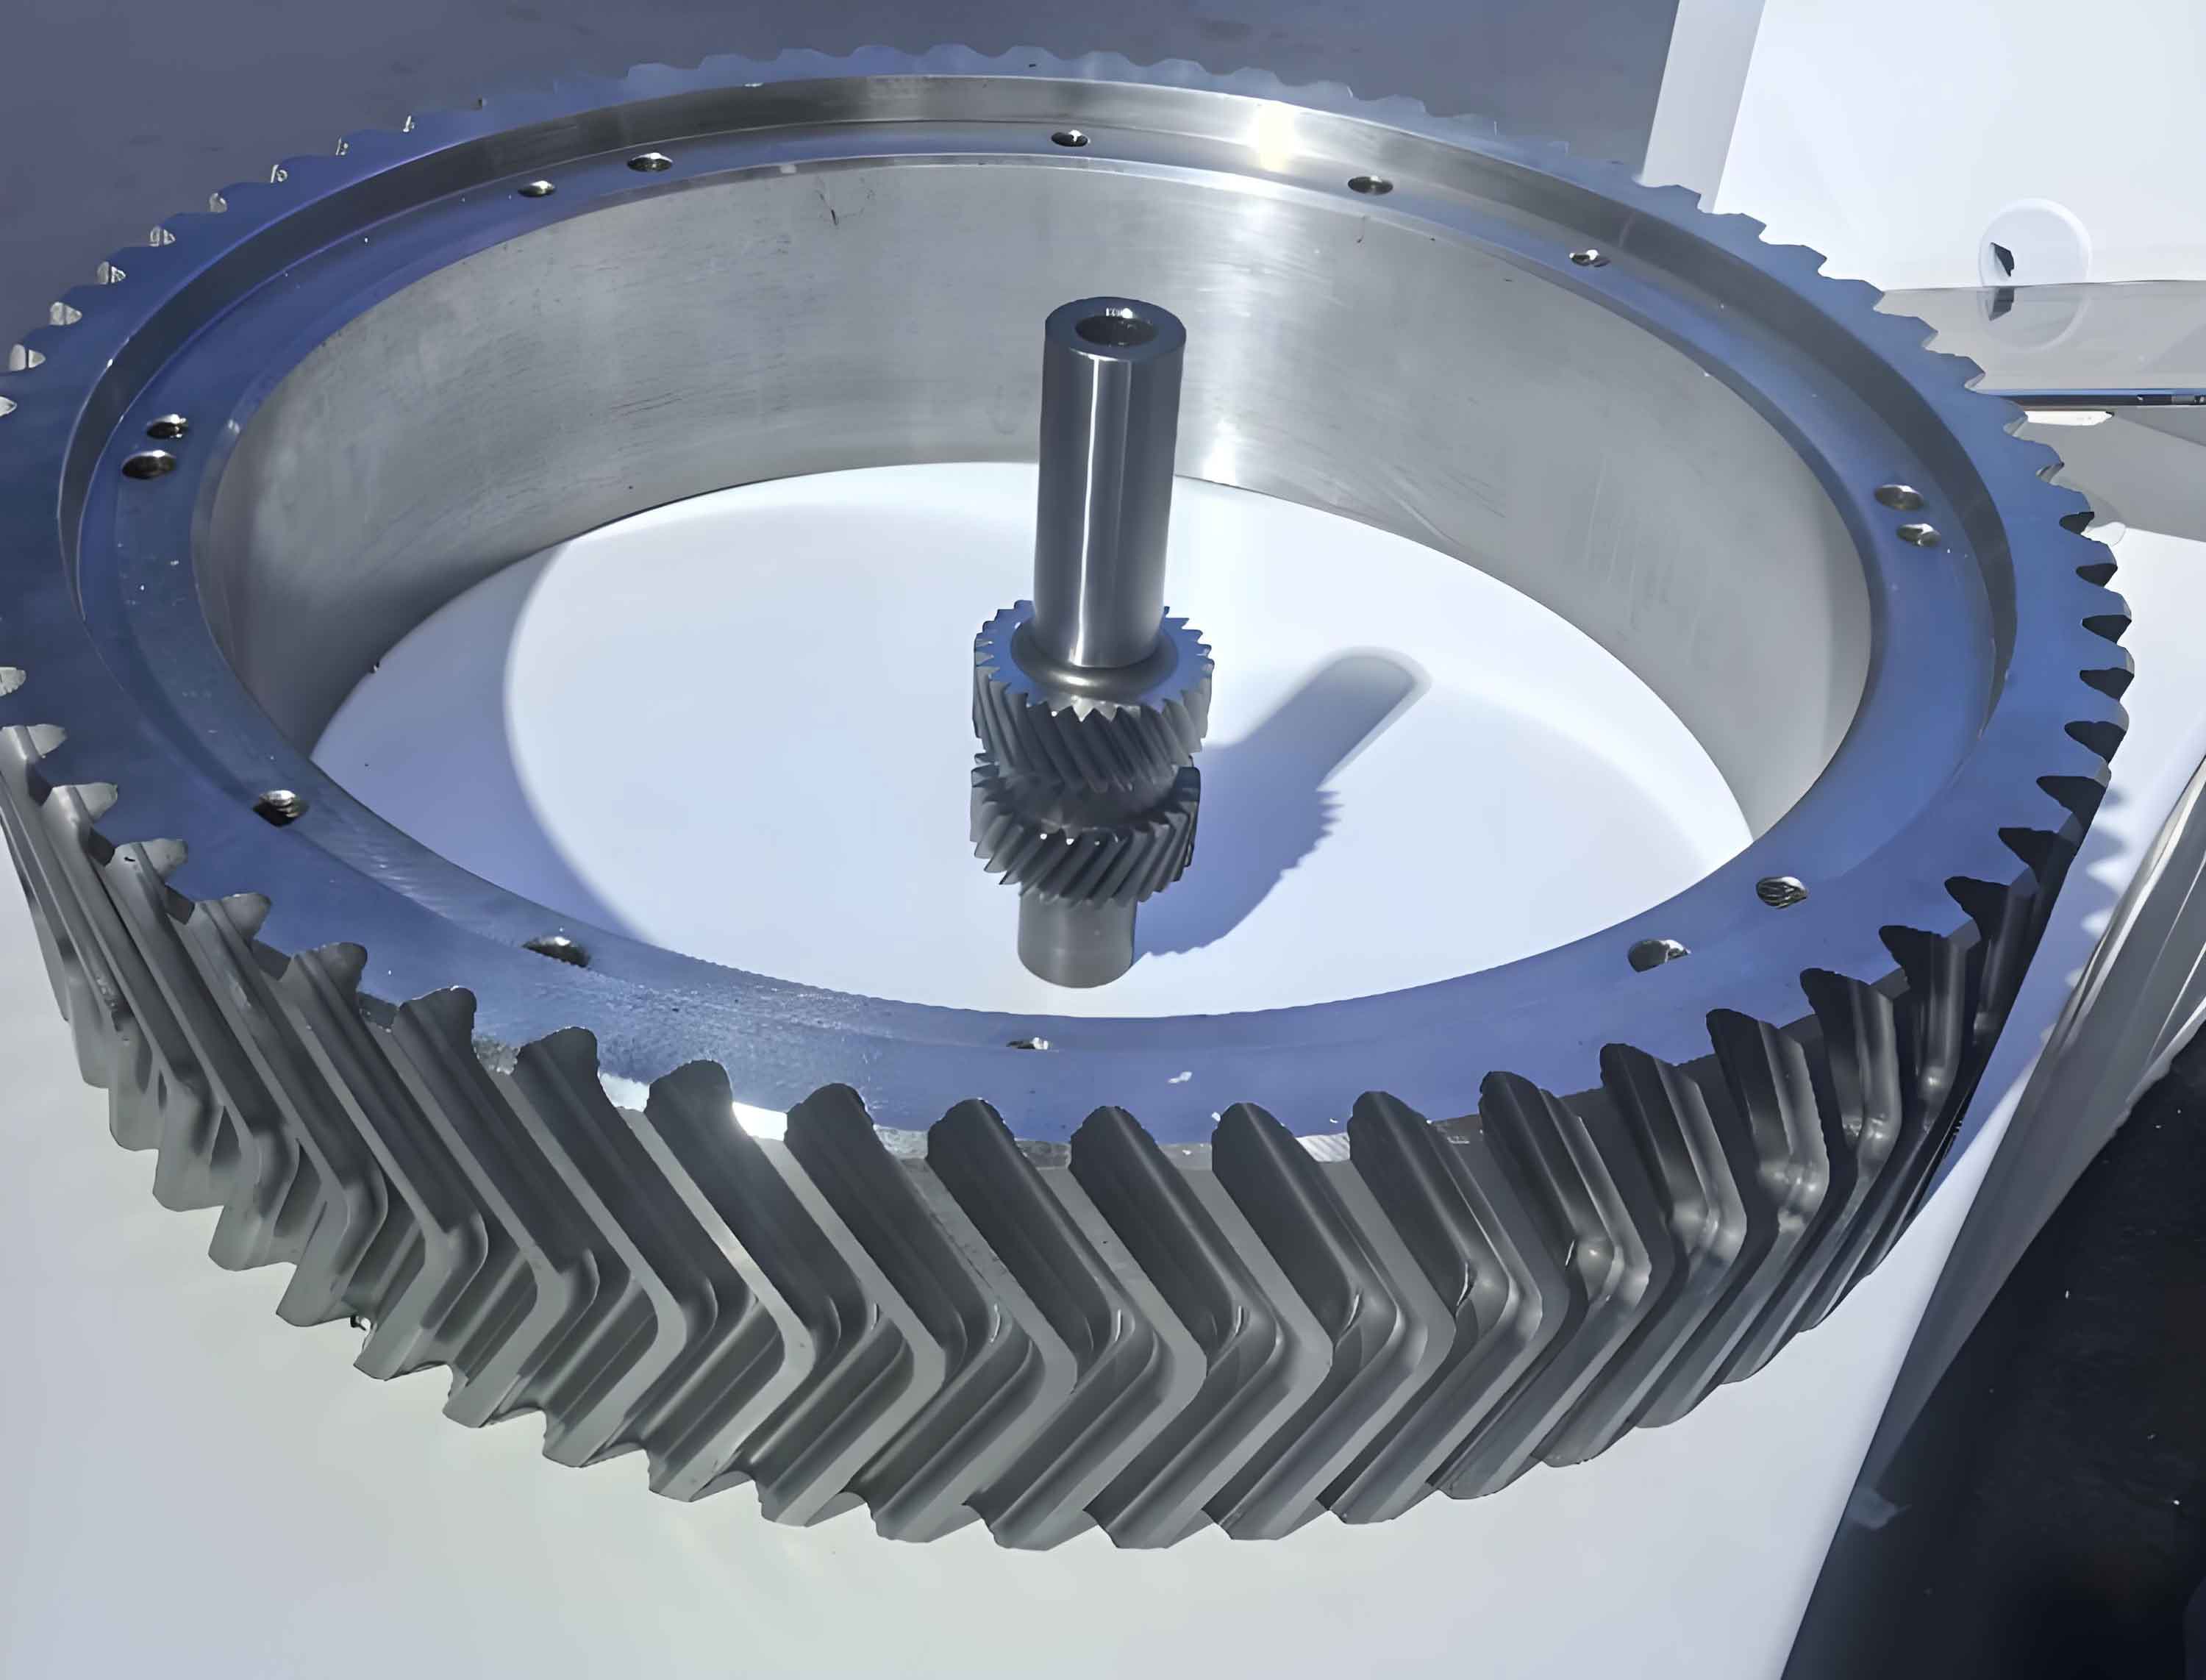
Herringbone gears, composed of two mirrored helical gears and a central relief groove, are widely used in high-power transmissions due to their superior load capacity and stability. However, manufacturing-induced symmetry errors between left and right helical segments critically affect vibration, noise, and load distribution. This study systematically investigates the impact of symmetry errors on meshing characteristics through theoretical modeling, finite element analysis (FEA), and experimental validation.

1. Mathematical Modeling of Herringbone Gear Meshing
The tooth surface equation for helical gears is derived using rack-type tool geometry. For a herringbone gear pair, the meshing coordinate system combines left and right helical segments:
$$
\begin{cases}
\mathbf{r}_f^{(1)}(u_1, \theta_1, \phi_1) = \mathbf{r}_f^{(2)}(u_2, \theta_2, \phi_2) \\
\mathbf{n}_f^{(1)}(u_1, \theta_1, \phi_1) = \mathbf{n}_f^{(2)}(u_2, \theta_2, \phi_2)
\end{cases}
$$
Where \( \mathbf{r}_f \) and \( \mathbf{n}_f \) represent position vectors and unit normals in fixed coordinate system \( S_f \). The loaded tooth contact analysis (LTCA) model considers displacement compatibility and force equilibrium:
$$
\begin{cases}
\mathbf{F}_k\mathbf{P}_k + \mathbf{w}_k = \mathbf{Z}_k + \mathbf{d}_k \\
\sum_{k=I}^{IV} \sum_{j=1}^n p_{jk} = P_L + P_R = P
\end{cases}
$$
| Parameter | Pinion | Gear |
|---|---|---|
| Teeth | 27 | 81 |
| Module (mm) | 3.5 | |
| Pressure Angle | 20° | |
| Helix Angle | 30° | |
| Face Width (mm) | 30×2 | |
2. Symmetry Error Definition and Compensation
Symmetry error \( \Delta T \) is defined as the deviation between actual and theoretical intersection points of left/right helices:
$$
\Delta T = \frac{a \cdot r}{\tan \beta}
$$
Where \( a \) is angular displacement and \( r \) is pitch radius. A tooth-direction compensation method effectively reduces load imbalance:
$$
\Delta w_{\text{comp}} = \begin{cases}
w_k + \Delta T \tan \beta & (k=I,II) \\
w_k – \Delta T \tan \beta & (k=III,IV)
\end{cases}
$$
| ΔT (mm) | Left Load (%) | Right Load (%) |
|---|---|---|
| 0.00 | 50.0 | 50.0 |
| 0.01 | 58.7 | 41.3 |
| 0.02 | 67.4 | 32.6 |
| 0.03 | 76.1 | 23.9 |
3. Finite Element Validation
A 3D FE model with 2.4 million elements verifies LTCA results. Contact patterns show excellent agreement between methods:
$$
\sigma_H = \sqrt{\frac{FE}{2\pi R} \cdot \frac{1}{\cos^2 \beta}}
$$
| Parameter | LTCA | FEA | Error (%) |
|---|---|---|---|
| Left TE (arcsec) | 8.659 | 10.711 | 3.12 |
| Right TE (arcsec) | 7.537 | 9.332 | 5.21 |
| Mesh Stiffness (N/m) | 6.37×10⁸ | 6.53×10⁸ | 2.48 |
4. Experimental Verification
A closed-loop test rig with CNC gear measuring center validates theoretical predictions:
$$
\delta_{\text{axial}} = \frac{1}{2\pi} \int_0^t v_{\text{vibration}} dt
$$
| Condition | Simulation (μm) | Experiment (μm) |
|---|---|---|
| ΔT=0.01mm | 5.2-6.5 | 4.5-6.0 |
| ΔT=0.02mm | 7.8-9.1 | 7.2-8.5 |
| ΔT=0.03mm | 10.3-12.7 | 9.8-11.9 |
5. Conclusion
This investigation establishes that symmetry errors significantly impact herringbone gear performance:
1. Each 0.01mm symmetry error increases load imbalance by 8-9%
2. Compensation modification reduces transmission error fluctuation by 32.8%
3. Floating pinion design decreases axial displacement by 18-22%
The proposed LTCA methodology provides an efficient tool for herringbone gear design optimization, particularly in aerospace and marine applications where precision requirements are stringent.
