
This study presents a comprehensive methodology for optimizing the dynamic robustness of high-speed herringbone gear transmission systems. By integrating finite element modeling, 6σ robust design principles, and experimental validation, we establish a systematic framework to minimize vibration responses while ensuring structural reliability.
1. Dynamic Modeling of Herringbone Gear Systems
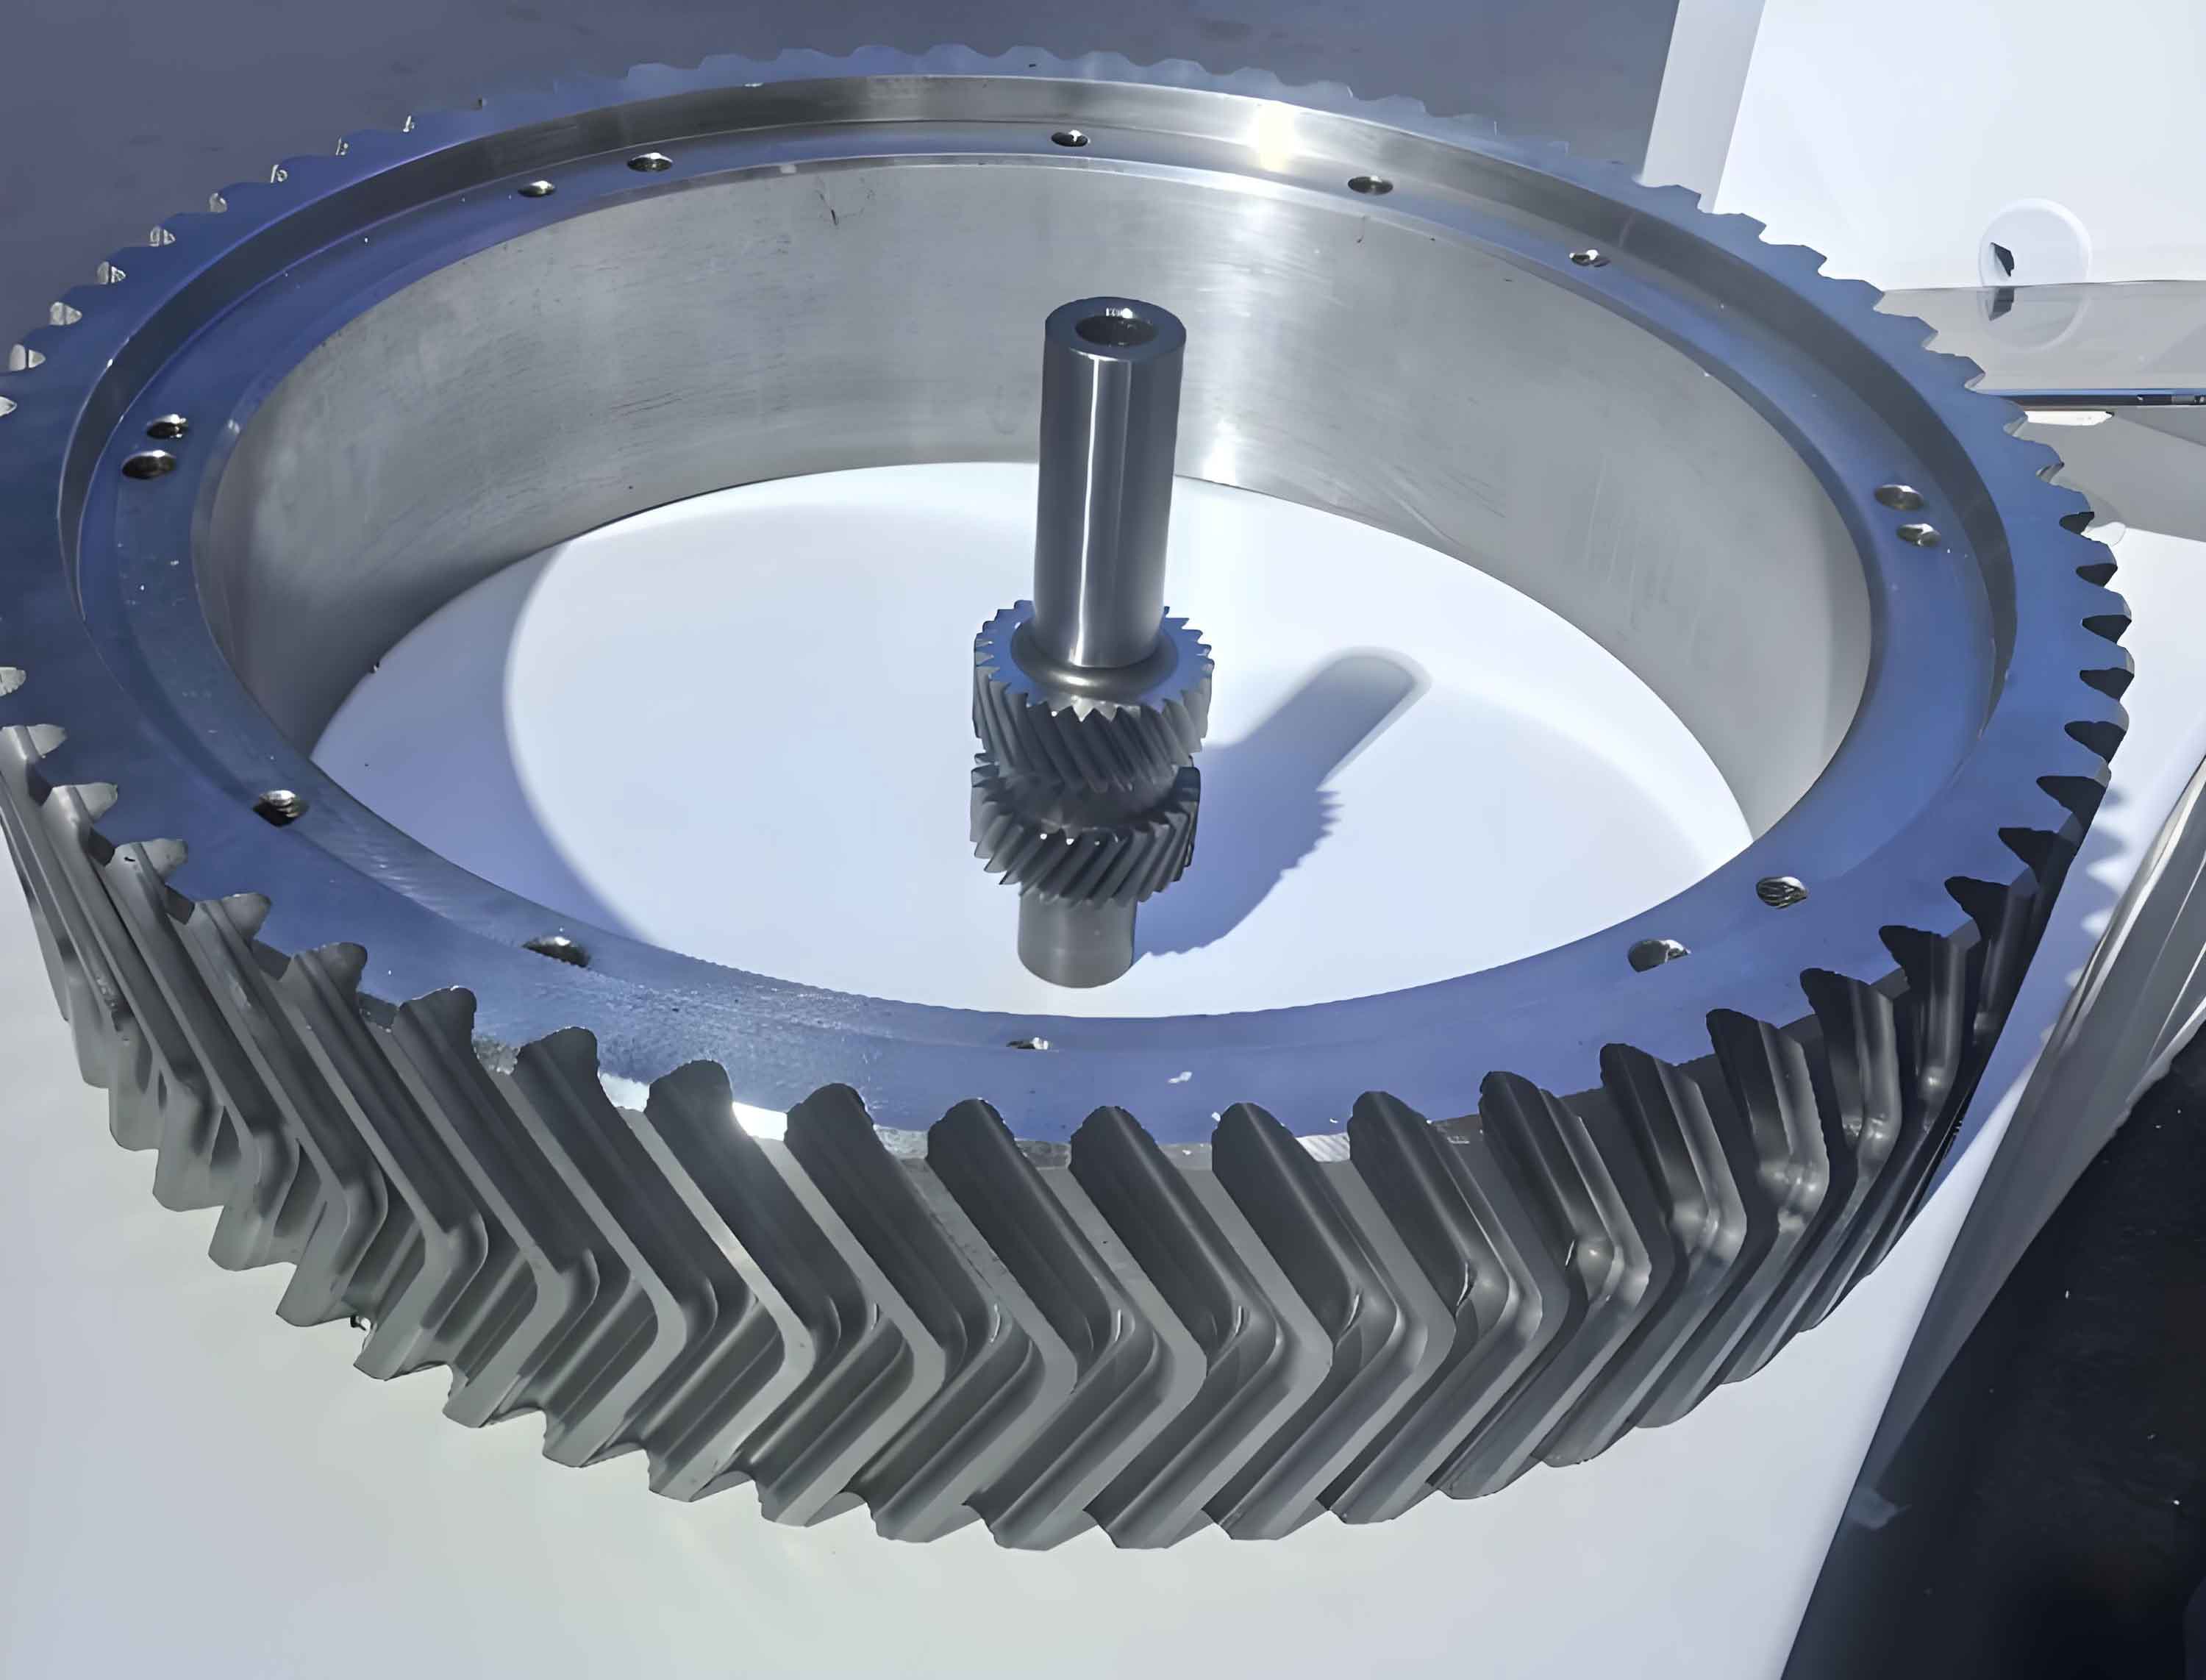
The dynamic model incorporates time-varying mesh stiffness calculated through finite element analysis. For a herringbone gear pair with parameters shown in Table 1, the equivalent mesh stiffness is derived as:
$$K_n = \frac{F_n}{\delta_n}$$
where $F_n$ represents normal load and $\delta_n$ denotes normal deformation. The time-varying torsional stiffness is expressed as:
$$K_T = \frac{T}{Delta\theta}$$
with $T$ being torque and $\Delta\theta$ the angular displacement. The comprehensive mesh stiffness combines individual gear stiffness components:
$$\frac{1}{K} = \frac{1}{K_1} + \frac{1}{K_2}$$
| Parameter | Value |
|---|---|
| Teeth (High-speed) | 92 |
| Teeth (Low-speed) | 46 |
| Module (mm) | 7 |
| Helix Angle (°) | 23.38 |
| Face Width (mm) | 30 |
2. 6σ Robust Optimization Methodology
The optimization framework addresses seven critical design variables affecting herringbone gear system dynamics:
| Variable | Description | Range (mm) |
|---|---|---|
| $x_1$ | Baseplate Thickness | 9-19 |
| $x_3$ | Reinforcement Thickness | 5-15 |
| $x_7$ | Cover Thickness | 9-19 |
The optimization objective minimizes vibration acceleration RMS:
$$f(x) = \frac{1}{n}\sum_{i=1}^n \alpha_i$$
where $\alpha_i$ represents acceleration RMS at measurement points. The 6σ constraints ensure reliability:
$$X_{LSH} + 6\sigma_x \leq \mu_x \leq X_{USH} – 6\sigma_x$$
3. Optimization Results and Validation
Key natural frequencies before and after optimization demonstrate effective resonance avoidance:
| Mode | Original (Hz) | Optimized (Hz) |
|---|---|---|
| 1 | 131.16 | 131.20 |
| 2 | 164.98 | 164.90 |
| 3 | 202.49 | 202.50 |
Vibration reduction achieved through optimization is quantified as:
$$\Delta\alpha = \frac{\alpha_{orig} – \alpha_{opt}}{\alpha_{orig}} \times 100\%$$
| Location | X-axis (%) | Y-axis (%) | Z-axis (%) |
|---|---|---|---|
| Point 1 | 45.2 | 33.7 | 30.4 |
| Point 4 | 42.6 | 41.1 | 26.1 |
4. Reliability Analysis
The probability density distributions of optimized variables confirm enhanced robustness:
$$R = \Phi\left(\frac{X_{USH}-\mu_x}{\sigma_x}\right) – \Phi\left(\frac{X_{LSH}-\mu_x}{\sigma_x}\right)$$
where $\Phi$ denotes standard normal distribution. Reliability results exceed 97.1% for all critical parameters, demonstrating the effectiveness of the robust optimization approach.
5. Experimental Verification
Prototype testing under 6,000 RPM conditions validated the simulation results:
| Measurement | X (mm/s²) | Y (mm/s²) | Z (mm/s²) |
|---|---|---|---|
| Point 1 | 2,960.4 | 2,745.9 | 2,653.6 |
| Point 2 | 2,750.4 | 2,582.6 | 2,329.1 |
This comprehensive study establishes a validated methodology for optimizing herringbone gear systems, achieving significant vibration reduction while maintaining operational reliability. The integration of finite element analysis with robust design principles provides a practical framework for high-performance gear transmission development.