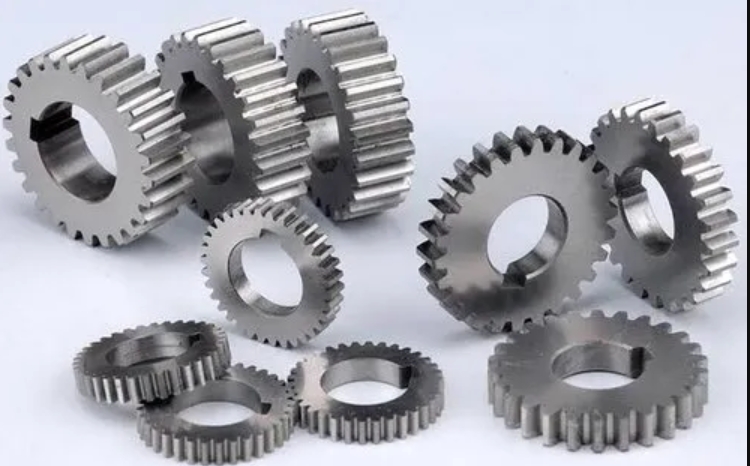
Spur gears remain fundamental components in modern machinery due to their simplicity, high load capacity, and precise motion transmission. However, their operational reliability is frequently compromised by compound faults like crack-pitting interactions under harsh working conditions. This study establishes an enhanced analytical framework for evaluating time-varying mesh stiffness (TVMS) and dynamic responses of spur gears with combined faults.
Improved TVMS Calculation for Healthy Spur Gears
The energy method forms the basis for calculating TVMS by considering Hertzian contact, bending, shear, and axial compression deformations. For gears with fewer than 42 teeth, the tooth profile between the base and root circles is modeled as:
$$h_x = \begin{cases}
R_b \sin\alpha, & 0 \leq x \leq d_1 \\
R_b[\alpha + \sin(\alpha_1 – \alpha)] – R_r \sin\alpha_3, & d_1 < x \leq d
\end{cases}$$
Gear body deflection is calculated using modified Sainsot’s formula with correction factor λ for double-tooth engagement phases:
$$K_f = \begin{cases}
k_f, & \text{Single-tooth} \\
k_f/\lambda, & \text{Double-tooth}
\end{cases}$$
| Parameter | Value |
|---|---|
| Module | 3.175 mm |
| Pressure Angle | 20° |
| Young’s Modulus | 206.8 GPa |
| Poisson’s Ratio | 0.3 |

Single-Fault TVMS Characteristics
For cracked spur gears, the effective moment of inertia varies with crack depth (q):
$$I_{x}^{crack} = \frac{L}{12} \left[ h_x^3 – (h_x – q)^3 \right]$$
Pitting damage reduces effective contact width and tooth stiffness:
$$\Delta L_x = \begin{cases}
2\sqrt{r^2 – (x – u)^2}, & x \in [u-r, u+r] \\
0, & \text{otherwise}
\end{cases}$$
| Fault Type | Stiffness Reduction |
|---|---|
| 10% Crack | 12.7% |
| 30% Crack | 29.4% |
| 4 Pits | 8.3% |
| 14 Pits | 23.6% |
Compound Fault Interaction Mechanism
The coupled effect of crack-pitting damage modifies local stiffness through superposition:
$$k_{total} = \left( \sum_{i=1}^n \frac{1}{k_{hi} + k_{bi} + k_{si}} \right)^{-1}$$
Three interaction phases are identified:
- Partial overlap: $a_p > a_{h1}$
- Full overlap: $a_p \leq a_{h1}$
- Crack dominance: $q \geq 50\%$
| Fault Combination | FEM Error |
|---|---|
| 10% Crack + 4 Pits | 2.1% |
| 50% Crack + 7 Pits | 3.4% |
| 70% Crack + 14 Pits | 4.7% |
Dynamic Response Analysis
The 8-DOF dynamic model considers translational and rotational motions:
$$m\ddot{x} + c\dot{x} + kx = F_m \cos(\omega t)$$
$$I\ddot{\theta} + c_t\dot{\theta} + k_t\theta = T(\phi)$$
Key vibration indicators show progressive degradation:
| Fault Level | Displacement (μm) | Acceleration (m/s²) |
|---|---|---|
| Healthy | 0.06 | 8.43 |
| 30% Crack + 7 Pits | 0.25 | 29.49 |
| 70% Crack + 14 Pits | 1.20 | 62.90 |
Fault Diagnosis Using Statistical Indicators
Three statistical parameters effectively distinguish compound faults:
$$Crest\ Factor = \frac{X_{peak}}{X_{RMS}}$$
$$Skewness = \frac{\sum(x_i – \bar{x})^3}{(N-1)\sigma^3}$$
$$Sideband\ Index = \frac{1}{M}\sum_{k=1}^M X(f_m \pm kf_r)$$
| Fault Type | Crest Factor | Sideband Index |
|---|---|---|
| 10% Crack + 4 Pits | 1.07 | 0.002 |
| 70% Crack + 14 Pits | 3.26 | 0.032 |
This comprehensive analysis methodology enables accurate condition monitoring and remaining life prediction for spur gear transmission systems operating under complex fault conditions.
