
In modern road transportation, trucks play a pivotal role, with heavy-duty variants demanding increasingly high performance standards. The transmission system, as a core component of heavy trucks, significantly influences overall vehicle efficiency and reliability. Among its elements, helical gears are critical due to their ability to transmit power smoothly and quietly. However, in practical applications, these helical gears often suffer from root cracks and fractures due to overloads, primarily caused by assembly errors. Current assembly tolerances are often determined based on empirical knowledge rather than rigorous theoretical or technical foundations. This study addresses this gap by conducting a comprehensive finite element simulation to analyze the mechanical performance of helical gears in heavy truck transmissions, thereby establishing permissible assembly errors to guide real-world assembly processes.
The focus is on helical gears, which are widely used for their superior load distribution and noise reduction compared to spur gears. The specific parameters of the helical gear pair under investigation are summarized in Table 1. These parameters include the number of teeth, pressure angle, module, face width, and helix angle, which are essential for accurate modeling and simulation.
| Parameter | Driving Gear | Driven Gear |
|---|---|---|
| Number of Teeth | 14 | 35 |
| Pressure Angle (°) | 20 | 20 |
| Module (mm) | 5 | 5 |
| Face Width (mm) | 20 | 20 |
| Helix Angle (°) | 15 | 15 |
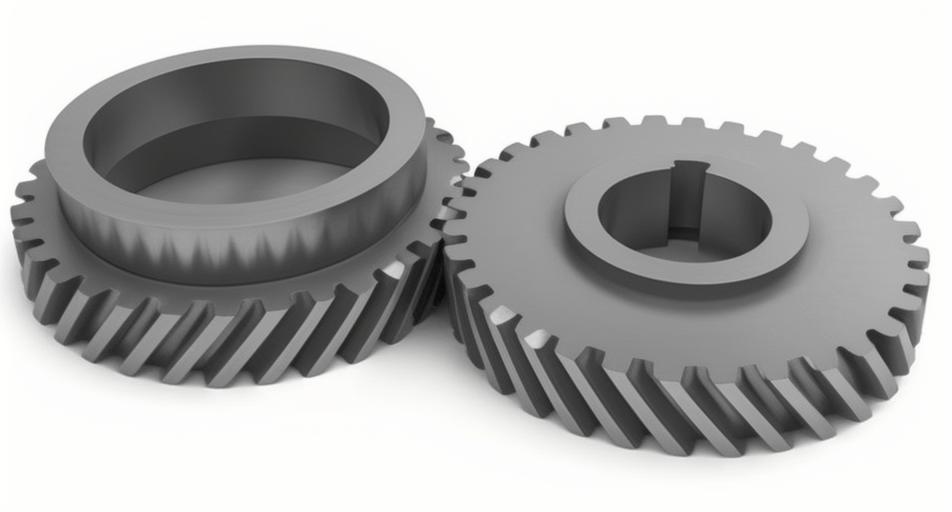
To construct the three-dimensional model, Pro/E software was employed, leveraging its robust parametric design capabilities. The model was built by inputting the key structural parameters from Table 1, ensuring geometric accuracy for subsequent simulations. The helix angle, in particular, was carefully incorporated to reflect the inclined tooth geometry characteristic of helical gears, which affects contact patterns and stress distribution. The resulting Pro/E simulation model, as illustrated in the figure below, serves as the foundation for both static and dynamic analyses. This model enables the investigation of two primary assembly errors: shaft non-parallelism and tooth flank clearance, which are common in real-world scenarios and can lead to premature failure if not properly controlled.
In the static analysis phase, the contact stress and its distribution on the helical gears were evaluated under fixed meshing positions. This involves applying the Hertzian contact theory, which provides a fundamental framework for understanding stress in contacting surfaces. For helical gears, the contact stress can be approximated using the formula for elliptical contact, given by:
$$ \sigma_H = \sqrt{ \frac{F}{\pi} \cdot \frac{1 – \nu_1^2}{E_1} + \frac{1 – \nu_2^2}{E_2} } \cdot \frac{1}{b} $$
where \( \sigma_H \) is the maximum contact stress, \( F \) is the normal load, \( \nu_1 \) and \( \nu_2 \) are Poisson’s ratios, \( E_1 \) and \( E_2 \) are Young’s moduli of the gear materials, and \( b \) is the face width. This equation highlights how material properties and geometry influence stress levels in helical gears. For the shaft non-parallelism analysis, the driving gear shaft was outwardly twisted by angles ranging from 0.2° to 0.6°, based on measurements from actual assemblies. The simulation model was modified accordingly, and a finite element mesh with 18,642 nodes was generated to ensure computational accuracy. The contact stresses for the driving and driven helical gears were computed and analyzed, revealing a clear trend: as the non-parallelism angle increases, the contact stress rises, potentially exceeding the material’s allowable limit of 1 GPa. For instance, at 0.6°, the stress approaches this threshold, necessitating a safety margin. Thus, from static considerations, the shaft non-parallelism should be limited to ≤0.4°.
Similarly, for tooth flank clearance, which refers to the deviation from the ideal meshing position, simulations were conducted for clearances of 0.2 mm, 0.4 mm, and 0.6 mm. The contact stress results, plotted against clearance values, show a near-linear increase. The relationship can be expressed as:
$$ \sigma_c = k \cdot c + \sigma_0 $$
where \( \sigma_c \) is the contact stress due to clearance, \( c \) is the clearance magnitude, \( k \) is a proportionality constant derived from simulation data, and \( \sigma_0 \) is the baseline stress under ideal conditions. At 0.6 mm clearance, the stress remains below 1 GPa, leading to a static tolerance of ≤0.6 mm. However, these static analyses do not account for dynamic effects, which are crucial for real-world operating conditions.
Transitioning to dynamic analysis, the helical gears were subjected to transient simulations to evaluate impact stresses under operational loads. The dynamic contact stress, which includes inertial and damping effects, can be modeled using the equation of motion for gear systems:
$$ m \ddot{x} + c \dot{x} + k x = F(t) $$
where \( m \) is the equivalent mass, \( c \) is the damping coefficient, \( k \) is the stiffness, and \( F(t) \) is the time-varying meshing force. For shaft non-parallelism, dynamic simulations at 0.2° and 0.4° twists showed significant stress increases compared to static results—up to 12.8% for the driving gear and 22% for the driven gear. This is summarized in Table 2, where the dynamic contact stresses exceed the allowable limit at 0.4°, indicating a need for stricter control. Therefore, the dynamic analysis recommends a non-parallelism angle of ≤0.2°.
| Condition | Driving Gear (GPa) | Driven Gear (GPa) |
|---|---|---|
| 0.2° Twist | 0.8 | 0.9 |
| 0.4° Twist | 0.9 | 1.1 |
For tooth flank clearance, dynamic simulations revealed even more pronounced effects, with stress values escalating under impact loads. The results, detailed in Table 3, demonstrate that at 0.6 mm clearance, the dynamic contact stress surpasses 1 GPa, rendering it unacceptable. The driven gear experiences higher stresses due to its larger size and load distribution characteristics. Consequently, the dynamic tolerance for tooth flank clearance is set at ≤0.4 mm.
| Clearance (mm) | Driving Gear (GPa) | Driven Gear (GPa) |
|---|---|---|
| 0.2 | 0.6 | 0.8 |
| 0.4 | 0.75 | 0.9 |
| 0.6 | 0.95 | 1.2 |
In-depth discussion on the behavior of helical gears under these errors involves the concept of load distribution along the tooth face. The helix angle introduces axial forces, which can be calculated as:
$$ F_a = F_t \cdot \tan(\beta) $$
where \( F_a \) is the axial force, \( F_t \) is the tangential force, and \( \beta \) is the helix angle. This axial component exacerbates misalignment effects, leading to uneven stress concentrations. For shaft non-parallelism, the angular deviation causes edge loading, where contact is localized at the gear ends, increasing the risk of pitting and fatigue. The contact pattern shift can be quantified using gear geometry relations, such as the effective face width reduction:
$$ b_{\text{eff}} = b – \Delta \theta \cdot R $$
where \( \Delta \theta \) is the non-parallelism angle in radians, and \( R \) is the pitch radius. This reduction in effective width elevates stress levels, as confirmed by the simulations.
For tooth flank clearance, the issue revolves around backlash and its impact on meshing stiffness. The dynamic transmission error, a key factor in noise and vibration, can be modeled as:
$$ \epsilon = \Delta c \cdot \sin(\omega t) $$
where \( \epsilon \) is the transmission error, \( \Delta c \) is the clearance, and \( \omega \) is the meshing frequency. This error induces冲击 loads during engagement, explaining the higher dynamic stresses observed. The material properties of the helical gears, typically alloy steels with high strength, were considered with a yield strength of approximately 1 GPa, but fatigue limits necessitate lower operational stresses.
To further validate the findings, parametric studies could involve varying the helix angle or module. For example, the contact ratio for helical gears is given by:
$$ C_r = \frac{\sqrt{(r_a^2 – r_b^2)} + \sqrt{(R_a^2 – R_b^2)} – C \sin(\phi)}{p_b} $$
where \( r_a \) and \( r_b \) are the addendum and base radii of the driving gear, \( R_a \) and \( R_b \) are for the driven gear, \( C \) is the center distance, \( \phi \) is the pressure angle, and \( p_b \) is the base pitch. A higher contact ratio, common in helical gears, generally improves load sharing but can be compromised by errors.
In conclusion, the integration of static and dynamic finite element analyses provides a robust framework for determining assembly tolerances for helical gears in heavy truck transmissions. The helical gears’ performance is highly sensitive to shaft non-parallelism and tooth flank clearance, with dynamic conditions imposing stricter limits than static ones. Based on the simulations, the recommended assembly tolerances are shaft non-parallelism ≤0.2° and tooth flank clearance ≤0.4 mm. These guidelines, derived from comprehensive modeling of helical gears, aim to mitigate root cracks and fractures, enhancing transmission reliability and longevity. Future work could explore thermal effects or lubricant interactions to further optimize helical gear designs.