
In mechanical power transmission systems, the durability of components under cyclic loading is a paramount concern. Among these, worm gear sets, prized for their high reduction ratios, compactness, and smooth operation, are frequently subjected to complex stress states that can lead to premature fatigue failure. This failure not only halts machinery but can also lead to significant safety hazards and economic losses. Therefore, a profound understanding of their stress behavior and fatigue life is critical for reliable design. In this analysis, we investigate the fatigue performance of a worm gear system by employing a sequential simulation methodology that integrates dynamic multibody simulation with advanced fatigue life prediction techniques.
The core challenge in analyzing worm gears lies in accurately capturing the dynamic interaction between the worm and the worm wheel. Traditional static or purely rigid-body dynamic analyses often fall short, as they neglect the local deformations and transient contact forces that drive fatigue. To address this, we adopt a co-simulation framework. First, a rigid-flexible coupled dynamic analysis is performed to obtain the time-history stress and strain fields on the gear teeth under operational loading. Subsequently, these dynamic load histories, combined with material fatigue properties, are fed into a dedicated fatigue analysis software to predict the life cycle and identify critical failure locations. This integrated approach allows us to move beyond simplified assumptions and gain insights into the real-world fatigue behavior of worm gears.
1. Fundamentals of Worm Gear Geometry and Modeling
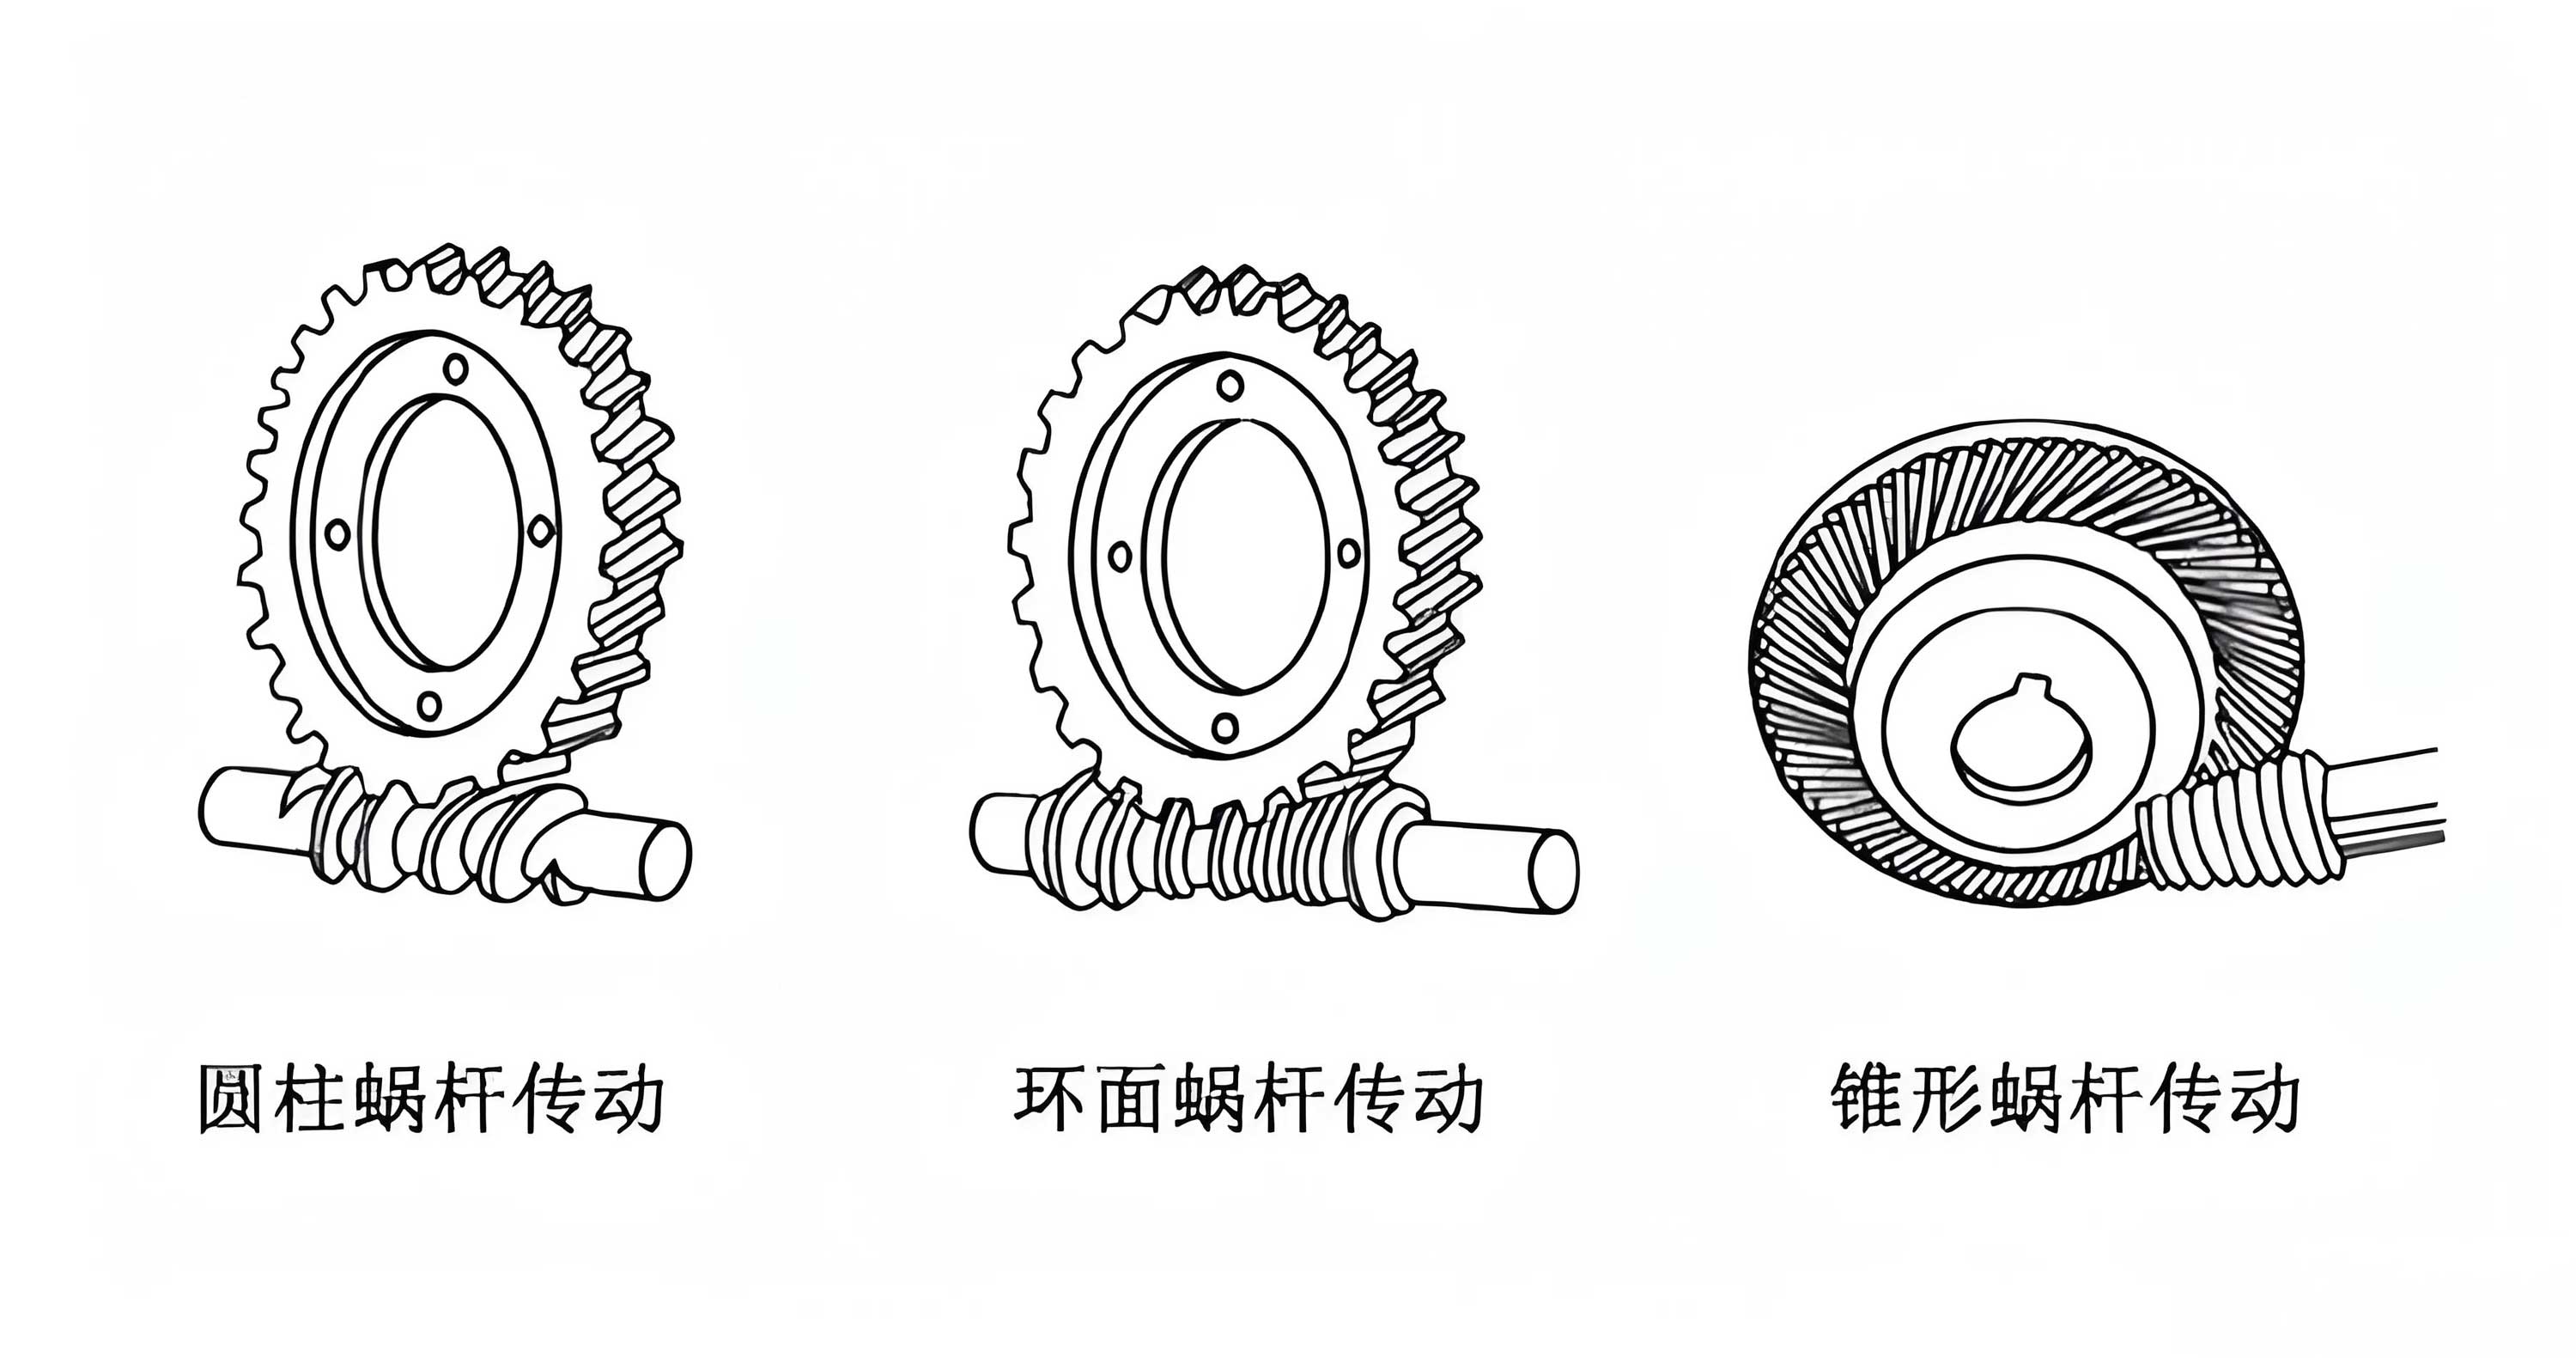
Worm gear drives are used to transmit motion and power between non-intersecting, perpendicular shafts. The unique geometry involves a threaded screw (the worm) meshing with a gear (the worm wheel, often made with a concave shape to envelop the worm). The tooth surface of a worm is a complex helicoid generated by a line or curve performing a screw motion. Common types of cylindrical worms are classified by the geometry of their axial or normal section:
- ZA (Archimedes) Worm: Straight-sided profile in the axial plane.
- ZI (Involute) Worm: Involute profile in a plane tangent to the base cylinder.
- ZN (Straight-Sided Normal) Worm: Straight-sided profile in the normal plane.
- ZK (Convolute) Worm: Generated by a conical grinding wheel.
For this study, a ZN-type worm gear set is analyzed due to its specific manufacturing and performance characteristics. The primary design parameters for the modeled set are summarized in Table 1.
| Parameter | Worm | Worm Wheel |
|---|---|---|
| Module (mm) | 1 | 1 |
| Number of Threads/Teeth | 2 (Starts) | 43 |
| Pressure Angle (°) | 12 (Normal) | 12 (Normal) |
| Lead Angle (°) | 6° 22′ 6″ | 11° 18′ 36″ (Helix Angle) |
| Accuracy Grade | 8 | 8 |
A precise 3D solid model of this ZN worm and worm wheel pair was created using CATIA software, ensuring accurate tooth geometry for subsequent analyses. The worm is typically made from high-strength steel, while the worm wheel is often made from a softer material like bronze or, in this case, nylon, to reduce friction and wear. The material properties assigned for the simulation are critical inputs and are listed in Table 2.
| Component | Material | Yield Strength, $\sigma_y$ (MPa) | Young’s Modulus, $E$ (GPa) | Poisson’s Ratio, $\nu$ |
|---|---|---|---|---|
| Worm | 40Cr Steel | 785 | 210 | 0.30 |
| Worm Wheel | Nylon | 150 | 6.0 | 0.40 |
2. Rigid-Flexible Coupled Dynamic Analysis
2.1. Development of the Flexible Multibody Model
To accurately simulate the dynamic stresses within the worm gears, a rigid-flexible coupled model is essential. A fully flexible model of the entire system would be computationally prohibitive. Therefore, a pragmatic and effective approach is adopted: the component most susceptible to bending and contact stress (initially the worm) is converted into a flexible body, while its mating part (the worm wheel) remains rigid, and vice versa. This allows for capturing the critical stress concentrations without overwhelming computational cost.
The process begins by importing the CAD assembly into RecurDyn, a multibody dynamics software. Kinematic joints are defined to constrain the worm and worm wheel appropriately (typically a revolute joint for the worm wheel and a cylindrical joint for the worm to allow rotation and translation if applicable). A rotational motion is applied to the worm input shaft to simulate driving conditions. The flexible component is created using the RecurDyn/F-Flex module. This module employs a component mode synthesis (CMS) technique, where the geometry is discretized into a finite element mesh, and its dynamic behavior is represented by a reduced set of vibration mode shapes. This results in a highly efficient yet accurate representation of flexibility within the multibody environment. Boundary conditions for the flexible body are defined at the connection points (e.g., bearing locations). The final coupled model consists of the flexible worm (or wheel) interacting dynamically with the rigid counterpart.
2.2. Stress Analysis from Dynamic Simulation
A transient dynamic simulation is run for a specified period (e.g., 12 seconds with 200 steps) to capture several meshing cycles. The solver calculates the time-varying deformation, velocity, acceleration, and crucially, the stress and strain at every node of the flexible body throughout the simulation.
The analysis of the flexible worm reveals that the highest dynamic stresses do not occur uniformly but are concentrated in specific regions. At a critical instant (e.g., t=0.06s), the maximum von Mises stress is observed to be approximately 126 MPa, located near the tooth tip region. While this value is well below the yield strength of the steel worm (785 MPa), it signifies a point of significant stress concentration. Concurrently, another region of elevated stress is identified at the root fillet of the worm teeth. This pattern is characteristic of gear contact where bending stresses at the root and contact (Hertzian) stresses near the surface interplay.
Similarly, when the worm wheel is modeled as flexible, the stress concentration shifts. The maximum stress, around 109 MPa for the nylon wheel, is predominantly found at the tooth root fillet of the worm wheel. This is the classic location for bending-induced fatigue failure in gear teeth. The contact footprint between the worm and worm wheel is relatively small and moves rapidly, subjecting these localized areas to repeated high-impact loads with each mesh cycle. The stress history extracted from these simulations, often called a load spectrum or duty cycle, forms the essential input for the subsequent fatigue life assessment. It provides the amplitude and frequency of the stress cycles experienced by every point on the gear teeth.
The dynamic stress $\sigma(t)$ at any node can be considered a superposition of mean stress $\sigma_m$ and alternating stress $\sigma_a$:
$$\sigma(t) = \sigma_m + \sigma_a \cdot \sin(\omega t + \phi)$$
where $\omega$ is the meshing frequency and $\phi$ is a phase shift. The simulation directly provides this $\sigma(t)$ data.
3. Methodology for Fatigue Life Prediction of Worm Gears
3.1. Theoretical Background on Fatigue
Fatigue is the process of progressive, localized permanent structural change occurring in a material subjected to fluctuating stresses and strains. Fatigue life ($N_f$) is defined as the number of stress cycles a component can endure before failure occurs. Based on the number of cycles to failure, fatigue is categorized as:
- High-Cycle Fatigue (HCF): Occurs when stress levels are relatively low (below yield strength) and failure happens after a high number of cycles ($N_f > 10^4-10^5$). Life is commonly characterized by the stress-life (S-N) approach.
- Low-Cycle Fatigue (LCF): Occurs with high stress levels (often plastic deformation) and failure occurs in a low number of cycles ($N_f < 10^4-10^5$). Life is characterized by the strain-life (ε-N) approach.
For worm gears operating under normal loads, high-cycle fatigue is the predominant concern. The fundamental relationship is described by the S-N curve (Wöhler curve), which plots the cyclic stress amplitude ($S_a$) against the number of cycles to failure ($N_f$). For many steels, a logarithmic-linear relationship exists in the high-cycle region, often expressed as:
$$S_a = \sigma_f’ (2N_f)^b$$
where $\sigma_f’$ is the fatigue strength coefficient and $b$ is the fatigue strength exponent (Basquin’s equation). For non-ferrous metals like nylon, the S-N curve typically shows a continuous slope without a distinct endurance limit.
Component fatigue life differs from material S-N data due to various modifying factors, accounted for by the corrected endurance limit $S_e$:
$$S_e = k_a \cdot k_b \cdot k_c \cdot k_d \cdot k_e \cdot S_e’$$
where $S_e’$ is the rotary-beam specimen endurance limit, and $k_a$ (surface finish), $k_b$ (size), $k_c$ (reliability), $k_d$ (temperature), and $k_e$ (miscellaneous effects) are derating factors.
For variable amplitude loading (as from our dynamic simulation), the cumulative damage is estimated using Miner’s rule (Palmgren-Miner linear damage hypothesis):
$$D = \sum_{i=1}^{n} \frac{n_i}{N_i}$$
where $D$ is the total damage, $n_i$ is the number of cycles at a given stress level $i$, and $N_i$ is the number of cycles to failure at that stress level (from the S-N curve). Failure is predicted when $D \geq 1$.
3.2. Integrated Fatigue Analysis Workflow
This study employs a two-step software-integrated workflow to predict the fatigue life of the worm gears:
- Dynamic Load Generation: Using RecurDyn, we perform the rigid-flexible coupled analysis as described. The output includes:
- The flexible body file (containing the FE mesh and mode shapes).
- The time-history results files containing stress/strain tensors for all nodes over the simulation time.
- Fatigue Post-Processing: The flexible body mesh and the dynamic stress results are imported into FEMFAT, a specialized fatigue analysis software. The software performs the following:
- Cycle Counting: It applies a cycle counting algorithm (like Rainflow counting) to the irregular stress-time history at each node to extract the series of stress ranges ($\Delta \sigma$) and mean stresses ($\sigma_m$).
- Mean Stress Correction: It corrects the stress amplitude to an equivalent fully reversed stress amplitude (e.g., using Goodman, Gerber, or Soderberg relations). The Goodman relation is common:
$$S_{ar} = \frac{S_a}{1 – \frac{S_m}{S_{ut}}}$$
where $S_{ar}$ is the equivalent fully reversed stress amplitude, $S_a$ is the applied stress amplitude, $S_m$ is the mean stress, and $S_{ut}$ is the ultimate tensile strength. - Damage Calculation: For each stress cycle identified, it calculates the damage using the material’s S-N curve (input for steel and nylon) and the chosen mean stress correction theory.
- Life Prediction: It sums the damage from all cycles according to Miner’s rule and inverts the total damage to calculate the life in blocks or total cycles to failure ($N_f = 1/D$ for the analyzed load block).
- Safety Factor Mapping: It also computes a local safety factor ($SF$) for each node, defined as the ratio of the allowable stress (from the S-N curve for a target life) to the actual equivalent stress. A safety factor less than 1 indicates a finite life less than the target.
4. Results: Fatigue Life and Safety of Worm Gears
The fatigue analysis, based on the dynamic loads from the coupled simulation, yields comprehensive life and safety factor maps for both the worm and the worm wheel. The target life for the analysis is typically set to a standard high-cycle value (e.g., $1 \times 10^6$ cycles), and a survival probability (reliability) of 97.5% is assumed in the S-N curve data.
4.1. Fatigue Life of the Steel Worm
The analysis for the steel worm predicts a calculated life based on the simulated load spectrum. The distribution of safety factors across the worm’s surface is the most informative output. The results can be summarized as follows:
- A vast majority of the nodes on the worm (e.g., 99.99%) exhibit a safety factor greater than 1. This indicates that these areas possess an infinite fatigue life (for the defined target) under the applied loading and are not critical.
- However, a small fraction of nodes (e.g., 0.01%) are identified with a safety factor less than 1. These are the critical nodes where fatigue failure is predicted to initiate.
- The spatial mapping of the safety factor clearly shows that these critical nodes are concentrated in two primary regions: the tip of the worm threads and the root fillet of the threads. This directly correlates with the stress concentration zones identified in the dynamic stress cloud plots. The predicted life at these critical locations is finite, for instance, on the order of $4.88 \times 10^5$ cycles for the most severe node.
The stress state at the tip is dominated by high contact pressures, while the root is dominated by bending stresses. The combination of high stress concentration and cyclic loading makes these regions the Achilles’ heel of the worm from a fatigue perspective.
4.2. Fatigue Life of the Nylon Worm Wheel
The fatigue analysis for the polymeric worm wheel follows the same principle, though the material’s S-N curve has a different slope and no true endurance limit. The results show a similar pattern but with nuances due to material and geometry:
- Again, most of the worm wheel’s volume (e.g., 99.97% of nodes) shows a safety factor above 1 for the target life.
- The population of critical nodes (SF < 1) is slightly larger, at approximately 0.03%. This is consistent with the lower strength and different fatigue characteristics of nylon compared to steel.
- The critical nodes are overwhelmingly concentrated in the root fillet region of the worm wheel teeth. The contact stresses on the face of the nylon tooth are often alleviated by its compliance, but the bending stresses at the root remain a primary driver for crack initiation. The predicted minimum life for the worm wheel might be similar or slightly different, e.g., $5.03 \times 10^5$ cycles.
The consistency between the high-stress zones from the dynamic simulation and the low-safety-factor zones from the fatigue analysis validates the integrated approach. It confirms that stress concentration under load is the primary initiator of fatigue damage in worm gears.
| Component | Material | Max Dynamic Stress (MPa) | Critical Location | Predicted Minimum Life (Cycles) | % Nodes with SF < 1 |
|---|---|---|---|---|---|
| Worm | 40Cr Steel | ~126 | Tooth Tip & Root | 4.88e5 | 0.01% |
| Worm Wheel | Nylon | ~109 | Tooth Root | 5.03e5 | 0.03% |
5. Conclusions and Implications for Design
The integrated analysis combining rigid-flexible coupled dynamics and spectral fatigue methods provides a powerful tool for assessing the durability of worm gear drives. The key findings of this investigation are:
- Identification of Critical Zones: The dynamic simulation successfully pinpointed the areas of maximum stress concentration in both the worm and the worm wheel. For the steel worm, these are the thread tips and roots. For the nylon worm wheel, the primary concern is the tooth root fillet. These are the regions most susceptible to fatigue crack initiation.
- Quantitative Fatigue Life Prediction: The subsequent fatigue analysis translated these dynamic stress histories into quantitative life estimates and safety factor distributions. It confirmed that while the bulk of both components has a theoretically infinite life under the given loads, the identified critical zones have finite lives in the range of several hundred thousand cycles.
- Root Cause: The analysis definitively establishes that the localized stress concentrations resulting from the meshing contact and bending loads are the fundamental cause of potential fatigue failure in worm gears. This is not merely a material strength issue but a consequence of the component’s geometry and loading conditions.
These results have significant implications for the design and optimization of worm gears:
- Targeted Reinforcement: Design efforts can be focused on modifying the geometry in the critical zones. This could involve optimizing the root fillet radius, applying specific tip relief, or modifying the lead curve to improve load distribution.
- Material Selection and Treatment: The choice of material and surface treatments can be guided by the analysis. For the worm, case hardening can significantly improve the surface fatigue resistance at the tip. For the worm wheel, selecting a nylon composite with higher fatigue strength or considering bronze could extend life.
- Validation and Refinement: This simulation-based approach serves as a cost-effective virtual validation tool during the design phase, reducing reliance on physical prototype testing. It allows engineers to rapidly iterate and evaluate design changes aimed at enhancing the fatigue performance of worm gears.
In conclusion, the methodology presented herein offers a robust framework for understanding and improving the fatigue life of worm gear systems. By bridging dynamic system simulation with advanced fatigue theory, it enables a proactive design strategy that targets durability from the outset, ultimately leading to more reliable and longer-lasting power transmission solutions.