
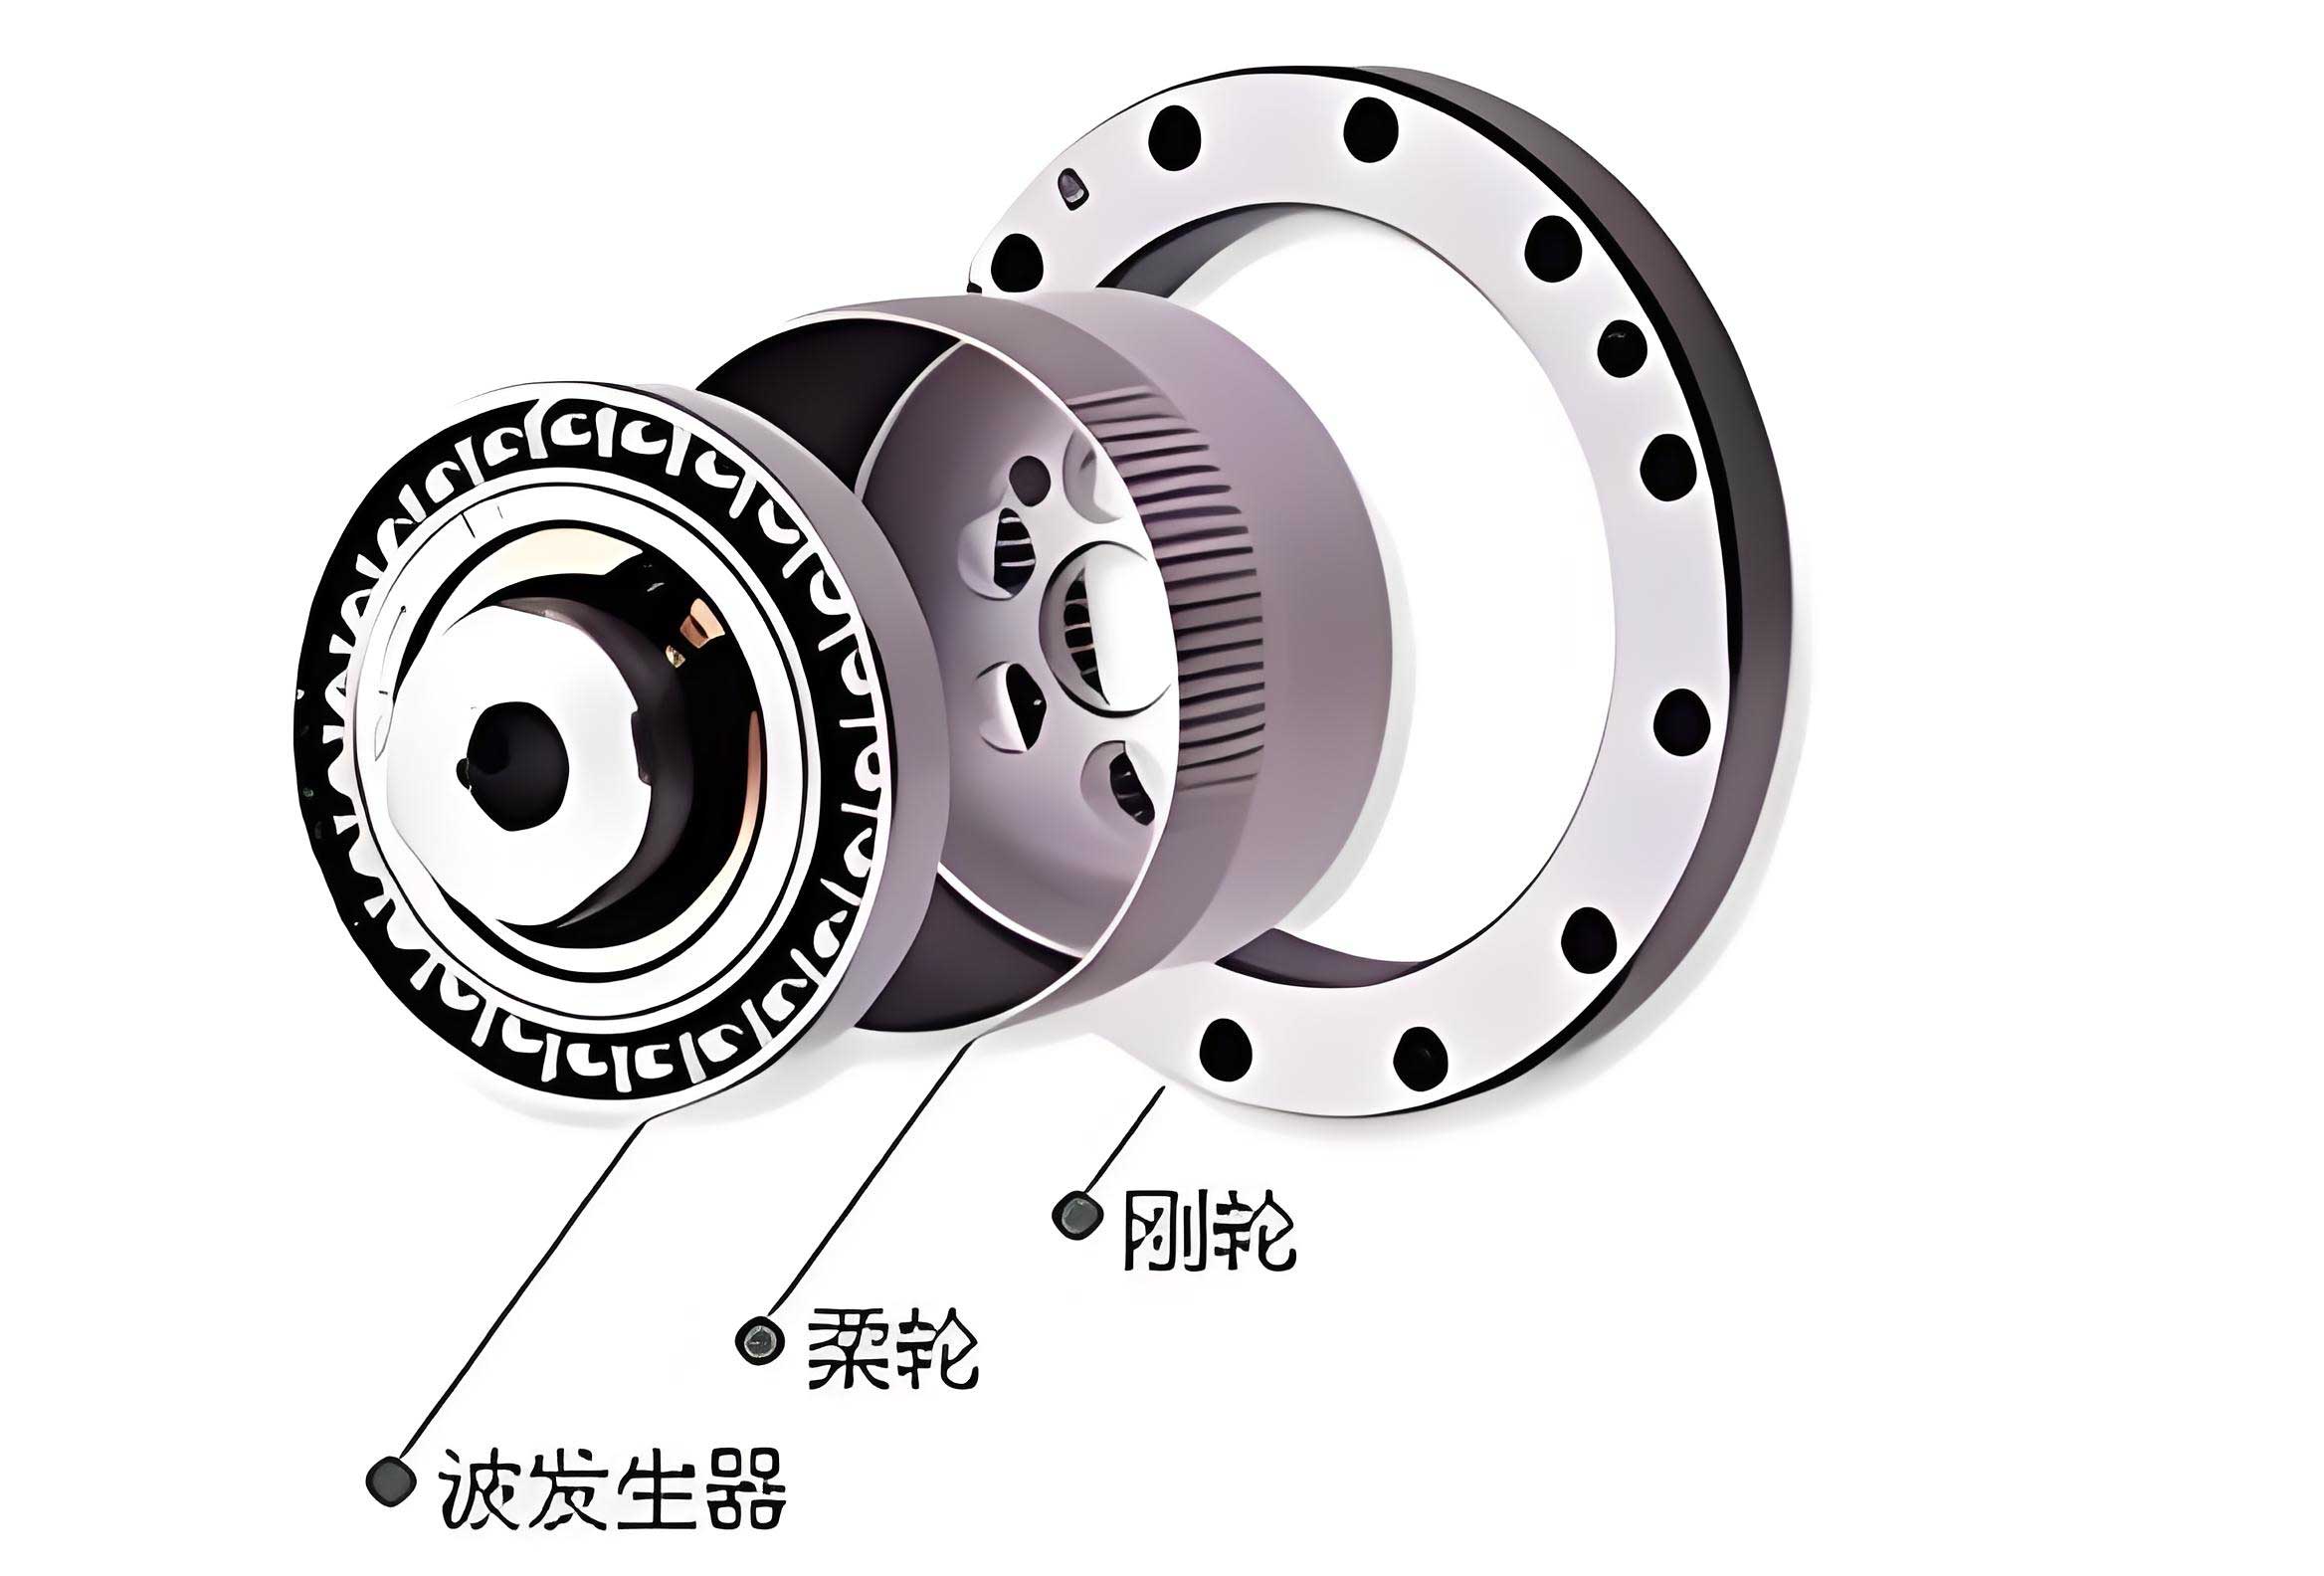
Strain wave gears, also known as harmonic drives, are renowned in precision motion control for their exceptional positional accuracy, high torque density, and near-zero backlash. This unique performance stems from their fundamental operating principle, which involves the elastic deformation of a flexible spline (the “Flexspline”) by a wave generator, engaging it with a rigid circular spline (the “Circular Spline”). The slight difference in the number of teeth between these two splines creates a high reduction ratio. The inherent flexibility of the Flexspline and the multi-tooth engagement provide a degree of error averaging, leading to superior transmission accuracy compared to many other gear types. Consequently, strain wave gears have become indispensable in high-performance servo mechanisms, particularly in robotics and aerospace applications, where precision and reliability are paramount.
Despite their advantages, the transmission error (TE) – the deviation between the actual and theoretically commanded output position – remains a critical performance indicator for strain wave gears. This error directly impacts the positioning accuracy and repeatability of the entire system. As applications demand ever-higher precision, a deeper understanding of the sources and characteristics of TE in strain wave gears becomes essential for design optimization and performance improvement. Traditional time-domain analysis of the TE signal, while useful, often obscures the underlying periodic contributors. A frequency-domain approach, however, can effectively disentangle these contributors, linking specific spectral components to physical error sources within the gear assembly, such as eccentricities of the wave generator or geometric errors in the splines.
This article presents a comprehensive analysis of transmission error in strain wave gears through the lens of main frequency component reconstruction. I will first establish the theoretical foundation by identifying the primary error frequencies inherent to the kinematics and potential imperfections of a strain wave gear. I will then construct a mathematical model of TE as a superposition of cosine waves at these fundamental frequencies. Following this, I will detail an experimental methodology for measuring bi-directional TE and employ Fast Fourier Transform (FFT) to extract the actual spectral components from the measured data. A core part of this work involves reconstructing the TE curve using these extracted main frequency cosine waves to validate the proposed model. Finally, I will conduct a comparative analysis between two different wave generator designs – an integrated cam and a slider-based cam – to investigate their influence on TE magnitude and hysteresis error, revealing insights into the phase shifts between forward and reverse operation spectra.
Theoretical Foundation: Error Sources and Their Spectral Signatures
The transmission error in a strain wave gear is not a random signal; it is a deterministic function influenced by the periodic motions and inherent imperfections of its three main components: the Wave Generator (WG), the Flexspline (FS), and the Circular Spline (CS). The frequency of these error contributions is directly tied to their rotational or engagement cycles. For a standard configuration with a fixed Circular Spline, the Wave Generator is the input, and the Flexspline is the output, with a gear ratio of $$ i = \frac{z_{FS}}{z_{CS} – z_{FS}} $$, where $$ z_{FS} $$ and $$ z_{CS} $$ are the number of teeth on the Flexspline and Circular Spline, respectively. For a two-wave strain wave gear, $$ z_{CS} – z_{FS} = 2 $$.
The primary error frequencies can be categorized as follows:
| Error Source Category | Description | Theoretical Frequency (for 2-wave gear) | Symbol |
|---|---|---|---|
| Wave Generator-Related | Errors due to eccentricity or imperfection of the cam profile. This includes “following” eccentricity ($$e_1$$) that rotates with the cam and “directional” eccentricity ($$e_2$$) of the WG axis. | $$ f_{WG} $$ (WG rotation frequency) $$ 2f_{WG} $$ |
$$ f_2 $$ |
| Flexspline-Related | Errors from FS manufacturing imperfections (e.g., geometric eccentricity, cumulative pitch error). These errors repeat with FS rotation and with its full engagement cycle relative to the CS. | $$ 2f_{WG} / z_{FS} $$ (FS rotation frequency) $$ 2f_{WG} \cdot z_{CS} / z_{FS} $$ (FS meshing frequency) |
$$ f_1 $$ $$ f_4 $$ |
| Circular Spline-Related | Errors from CS manufacturing imperfections (e.g., geometric eccentricity). The error cycle repeats every half revolution of the WG due to the two-wave symmetry. | $$ 2f_{WG} $$ (CS meshing frequency) | $$ f_3 $$ |
Thus, for a two-wave strain wave gear, the four fundamental theoretical frequencies are:
$$ f_1 = \frac{2 f_{WG}}{z_{FS}}, \quad f_2 = f_{WG}, \quad f_3 = 2 f_{WG}, \quad f_4 = 2 f_{WG} \cdot \frac{z_{CS}}{z_{FS}} $$
High-frequency errors like individual tooth profile deviations or bearing ball-pass frequencies are typically negligible due to the multi-tooth engagement averaging effect in a strain wave gear.
Mathematical Model: TE as a Superposition of Cosine Waves
Based on the periodic nature of the error sources, the overall transmission error, $$ E(t) $$, can be mathematically modeled as a constant bias plus the superposition of a finite number of cosine waves, each representing a dominant frequency component. The general expression is:
$$ E(t) = E_0 + \sum_{q=1}^{Q} A_q \cos(2\pi f_q t + \phi_q) $$
where $$ E_0 $$ is the constant component (often related to assembly clearance or steady-state deflection), $$ A_q $$, $$ f_q $$, and $$ \phi_q $$ are the amplitude, frequency, and initial phase of the $$ q $$-th cosine component, respectively, and $$ Q $$ is the total number of significant components considered.
To understand the combined effect, let’s analyze the superposition characteristics of these theoretical frequencies. Assume a strain wave gear with $$ z_{CS}=162 $$, $$ z_{FS}=160 $$, and a wave generator input speed corresponding to $$ f_{WG} = 0.5 \, \text{Hz} $$. The fundamental frequencies are:
$$ f_1 \approx 0.00625\, \text{Hz}, \quad f_2 = 0.5\, \text{Hz}, \quad f_3 = 1.0\, \text{Hz}, \quad f_4 \approx 1.0125\, \text{Hz} $$
Setting all amplitudes $$ A_q = 1” $$ (arcsecond) and phases $$ \phi_q = \pi $$ for illustration, we can observe key patterns:
- Beat Frequency Phenomenon: The superposition of frequencies that are not integer multiples of each other creates characteristic “beat” patterns. For instance, $$ C_2(f_2) + C_4(f_4) $$ produces a wavy beat, while $$ C_3(f_3) + C_4(f_4) $$ creates a spindle-shaped beat due to their very close frequencies ($$ 1.0 $$ Hz vs. $$ 1.0125 $$ Hz).
- Size-Wave Phenomenon: The superposition of frequencies with an exact integer ratio (e.g., $$ f_3 = 2f_2 $$) leads to a periodic pattern of alternating larger and smaller amplitude waves within the primary cycle.
The combination of all three mid-frequency components ($$ f_2, f_3, f_4 $$) results in a complex beat pattern that is a hybrid of wavy and spindle shapes, repeating twice per Flexspline revolution (once per $$ f_1 $$ cycle). In a real strain wave gear, the actual amplitudes and phases are determined by the magnitude and angular orientation of the physical error sources (e.g., the direction of eccentricity).
Spectral Analysis Methodology: From Sampled Data to Frequency Components
Experimentally measured TE is a discrete-time signal. To decompose it into its constituent cosine waves, we employ spectral analysis via the Discrete Fourier Transform (DFT). The continuous TE model can be expanded into a Fourier series:
$$ E(t) = \frac{a_0}{2} + \sum_{n=1}^{N} \left[ a_n \cos\left(\frac{2\pi n}{T}t\right) + b_n \sin\left(\frac{2\pi n}{T}t\right) \right] $$
where $$ T $$ is the period of the signal, and the coefficients are given by:
$$ a_n = \frac{2}{T} \int_{t_0}^{t_0+T} E(t) \cos\left(\frac{2\pi n}{T}t\right) dt, \quad b_n = \frac{2}{T} \int_{t_0}^{t_0+T} E(t) \sin\left(\frac{2\pi n}{T}t\right) dt $$
For a discretely sampled sequence $$ E_k $$ ($$ k = 1, 2, …, N $$) sampled at frequency $$ f_s $$, we apply the Fast Fourier Transform (FFT) algorithm to compute the complex coefficients $$ F_n $$:
$$ F_n = \sum_{k=1}^{N} E_k \cdot e^{-i 2\pi (k-1)(n-1) / N} $$
The corresponding frequency for $$ F_n $$ is $$ f = (n-1) \cdot \frac{f_s}{N} $$. The amplitude $$ A_m $$ and phase $$ \phi_m $$ of the $$ m $$-th frequency component (where $$ m = n-1 $$) are then derived from $$ F_n $$:
$$ A_m = \frac{2}{N} |F_n| = \frac{2}{N} \sqrt{\text{Re}(F_n)^2 + \text{Im}(F_n)^2} $$
$$ \phi_m = \arg(F_n) = \tan^{-1}\left(\frac{\text{Im}(F_n)}{\text{Re}(F_n)}\right) $$
Here, $$ F_1 $$ corresponds to the DC component ($$ f=0 $$), whose value is the constant $$ E_0 $$. This process transforms the time-domain TE signal into a frequency-domain spectrum, clearly revealing the dominant frequencies $$ f_q $$, their amplitudes $$ A_q $$, and phases $$ \phi_q $$.
Experimental Validation and Waveform Reconstruction
To validate the theoretical framework, I conducted dynamic TE measurements on a commercial strain wave gear (model ZSHF-17-80-2SO, ratio 80:1). The test setup utilized a high-precision rotary test bench with optical encoders on both the input (wave generator) and output (flexspline) shafts. Data was acquired at a sampling frequency of $$ f_s = 10 $$ Hz. The gear was run under a constant input speed of 30 RPM ($$ f_{WG} = 0.5 $$ Hz) and a light load. Bi-directional TE was measured by running the input shaft forward for over one output revolution, then immediately reversing direction.
The first test used an integrated cam wave generator. The raw bi-directional TE data in the angular domain showed clear separation between forward and reverse curves, defining the hysteresis error (backlash). Performing FFT on the reverse motion TE data yielded the amplitude spectrum. The dominant peaks were identified and are summarized below alongside the theoretical predictions.
| Frequency Identification | Measured Freq. (Hz) | Measured Amp. (arcsec) | Theoretical Freq. (Hz) | Theoretical Source |
|---|---|---|---|---|
| Constant ($$E_0$$) | 0.000 | 13.98 | 0.000 | Assembly/Deflection |
| Flexspline Rotation ($$f_1$$) | 0.00622 | 2.29 | 0.00625 | FS Geometric Error |
| Wave Generator ($$f_2$$ region) | 0.55935 | 2.37 | 0.50000 | WG Eccentricity |
| Circular Spline Meshing ($$f_3$$) | 1.00062 | 4.31 | 1.00000 | CS/WG Directional Error |
| Flexspline Meshing ($$f_4$$) | 1.01305 | 2.37 | 1.01250 | FS Geometric Error |
| Second Harmonic of $$f_3$$ | 2.00124 | 4.86 | 2.00000 | Non-linear interaction |
The close match between measured and theoretical frequencies confirms the origin analysis. Notably, the largest alternating component was not at $$ f_2 $$ or $$ f_3 $$, but at $$ 2f_3 $$, indicating significant non-linear effects or modulation.
The core validation step was reconstructing the TE curve. Two reconstructions were performed:
Reconstruction I: Using only the four theoretical base frequencies ($$ f_1, f_2, f_3, f_4 $$) with their measured amplitudes and phases.
Reconstruction II: Using all significant measured frequency components from the table above (including $$ 2f_3 $$ and the shifted $$ f_2 $$).
The results were striking. Reconstruction I successfully captured the overall long-period beat pattern of the original TE signal, proving that the theoretical model captures the essential dynamics. However, it failed to match the exact amplitude and finer waveform details. Reconstruction II, incorporating the actual dominant spectral components, produced a curve that overlapped almost perfectly with the original measured TE, accurately reproducing both the macro-beat pattern and the micro-level fluctuations. This conclusively demonstrates that the TE of a strain wave gear can be accurately represented as a sum of a limited number of main frequency cosine waves.
Influence of Wave Generator Design and Bi-Directional Error Analysis
A key mechanical factor influencing TE is the wave generator design. The integrated cam’s eccentricities directly translate into $$ f_2 $$ and $$ 2f_2 $$ errors. A slider-type cam wave generator incorporates a cross-slider mechanism between the input hub and the cam. This design acts as an Oldham coupling, allowing the cam to self-center within the Flexspline bore, thereby mitigating the translational eccentricities (both $$ e_1 $$ and $$ e_2 $$) of the cam itself.
Repeating the experiment with an otherwise identical strain wave gear fitted with a slider-type wave generator yielded significantly different results. The TE magnitude reduced, and the spectral signature changed markedly, as shown in the comparative table below.
| Frequency (Hz) | Integrated Cam Amp. (arcsec) | Slider Cam Amp. (arcsec) | Change | Interpretation |
|---|---|---|---|---|
| ~0 ($$E_0$$, Forward) | 2.92 | 1.96 | -0.96 (-33%) | Reduced steady-state offset. |
| ~0 ($$E_0$$, Reverse) | 13.98 | 23.51 | +9.53 | Increased clearance effect in reverse. |
| ~0.559 ($$f_2$$ region) | 2.37 | ~0 | ~ -2.37 (-100%) | Effective elimination of WG cam eccentricity error. |
| 1.000 ($$f_3$$) | 4.31 | 3.16 | -1.15 (-27%) | Reduction in CS/WG directional error component. |
| 2.001 ($$2f_3$$) | 4.86 | 3.38 | -1.48 (-30%) | Reduction in non-linear harmonic. |
The slider design successfully suppressed the spectral component around the wave generator rotation frequency $$ f_2 $$ and reduced components at $$ f_3 $$ and its harmonic. This confirms the theoretical premise that the wave generator’s mechanical imperfections are a major contributor to specific TE frequencies in a strain wave gear.
Analyzing the bi-directional TE data in the frequency domain provides profound insight into the nature of hysteresis error. While the dominant frequencies remain identical between forward and reverse motion, their amplitudes and, more importantly, their phases change. The phase difference for the main components between forward and reverse operation is not zero or $$ \pi $$; it takes on various values, as exemplified below for the integrated cam case:
$$ \Delta \phi_{f_3} = \phi_{f_3, reverse} – \phi_{f_3, forward} \approx 1.493 – (-2.922) \approx 4.415 \, \text{rad} \, (\text{mod } 2\pi) $$
This significant phase shift, combined with the change in the constant component $$ E_0 $$ (largely due to mechanical clearance), is the fundamental reason why the forward and reverse TE curves do not simply mirror each other but are separated, creating the observed hysteresis loop. The phase shift alters the constructive and destructive interference pattern of the cosine waves when the direction of motion (and thus the sequence of tooth engagement) reverses.
Conclusion
Through a combination of theoretical modeling and experimental spectral analysis, this work decodes the complex signal of transmission error in strain wave gears. The key findings are:
- The TE of a strain wave gear can be accurately modeled and reconstructed as the sum of a constant and a limited set of cosine waves at specific main frequencies. These frequencies are determined by the kinematics ($$ f_{WG}, z_{FS}, z_{CS} $$) and correspond to physical error sources in the wave generator, flexspline, and circular spline.
- Beat phenomena (wavy and spindle-shaped) observed in the TE waveform are direct results of the superposition of closely spaced frequencies such as the circular spline meshing frequency ($$ 2f_{WG} $$) and the flexspline meshing frequency ($$ 2f_{WG} \cdot z_{CS}/z_{FS} $$).
- Spectral analysis via FFT is a powerful tool for diagnosing the root causes of TE. The amplitude of components at $$ f_{WG} $$ and $$ 2f_{WG} $$ directly indicates the severity of wave generator eccentricities.
- The mechanical design of the wave generator critically impacts TE. A slider-type design that allows cam self-centering can effectively suppress error components related to cam eccentricity, leading to a reduction in overall TE magnitude.
- Hysteresis error (backlash) in strain wave gears arises not merely from a constant angular gap but from a directional shift in the phase of the main frequency cosine wave components, coupled with a change in the constant offset $$ E_0 $$. This phase shift changes the interference pattern of the error waves upon reversal.
This frequency-domain reconstruction approach provides a clear, physics-based framework for understanding, diagnosing, and ultimately improving the transmission accuracy of strain wave gears. Future work could focus on establishing the precise relationship between the phase angles of the spectral components and the physical angular orientation of individual component errors (eccentricity vectors), enabling predictive compensation and active error correction in high-precision servo systems utilizing strain wave gears.