
In the field of mechanical power transmission, particularly within automotive and heavy machinery sectors, the helical gear stands as a critical component due to its superior load-bearing capacity and smoother, quieter operation compared to spur gears. The dynamic performance of a helical gear, characterized by its natural frequencies and mode shapes, is a fundamental determinant of its operational stability, noise emission, and fatigue life. Resonance, occurring when an excitation frequency coincides with a natural frequency, can lead to catastrophic failures. Therefore, a thorough modal analysis is indispensable for the design and validation phase. This article presents a detailed, first-person account of a complete modal investigation for a specific helical gear, integrating advanced Computer-Aided Engineering (CAE) tools with experimental validation to ensure accuracy and provide actionable engineering insights.
The core of any structural dynamic analysis lies in understanding its governing equations. For a multi-degree-of-freedom system like a helical gear, the general equation of motion under forced vibration is given by:
$$[M]\{\ddot{x}(t)\} + [C]\{\dot{x}(t)\} + [K]\{x(t)\} = \{F(t)\}$$
where $[M]$, $[C]$, and $[K]$ are the global mass, damping, and stiffness matrices, respectively. The vectors $\{\ddot{x}(t)\}$, $\{\dot{x}(t)\}$, and $\{x(t)\}$ represent nodal acceleration, velocity, and displacement, while $\{F(t)\}$ is the external force vector. For modal analysis—the study of inherent dynamic properties—we consider the free, undamped vibration. This simplifies the problem as damping has negligible effect on natural frequencies and mode shapes for most metallic structures like a helical gear. Setting $\{F(t)\} = \{0\}$ and $[C]=[0]$, we obtain the free-vibration equation:
$$[M]\{\ddot{x}(t)\} + [K]\{x(t)\} = \{0\}$$
Assuming a harmonic solution of the form $\{x(t)\} = \{\phi\} e^{i \omega t}$, where $\{\phi\}$ is the mode shape vector and $\omega$ is the circular natural frequency, leads to the classic eigenvalue problem:
$$([K] – \omega^2 [M]) \{\phi\} = \{0\}$$
For a non-trivial solution ($\{\phi\} \neq \{0\}$), the determinant must vanish: $|[K] – \omega^2 [M]| = 0$. Solving this eigenvalue problem yields $n$ eigenvalues, $\omega_i^2$ (where $i=1$ to $n$, and $n$ is the number of degrees of freedom), and their corresponding eigenvectors $\{\phi_i\}$. The $i$-th natural frequency $f_i$ is then $f_i = \omega_i / (2\pi)$. This theoretical framework forms the foundation for both the numerical finite element analysis and the experimental modal analysis conducted on the helical gear.
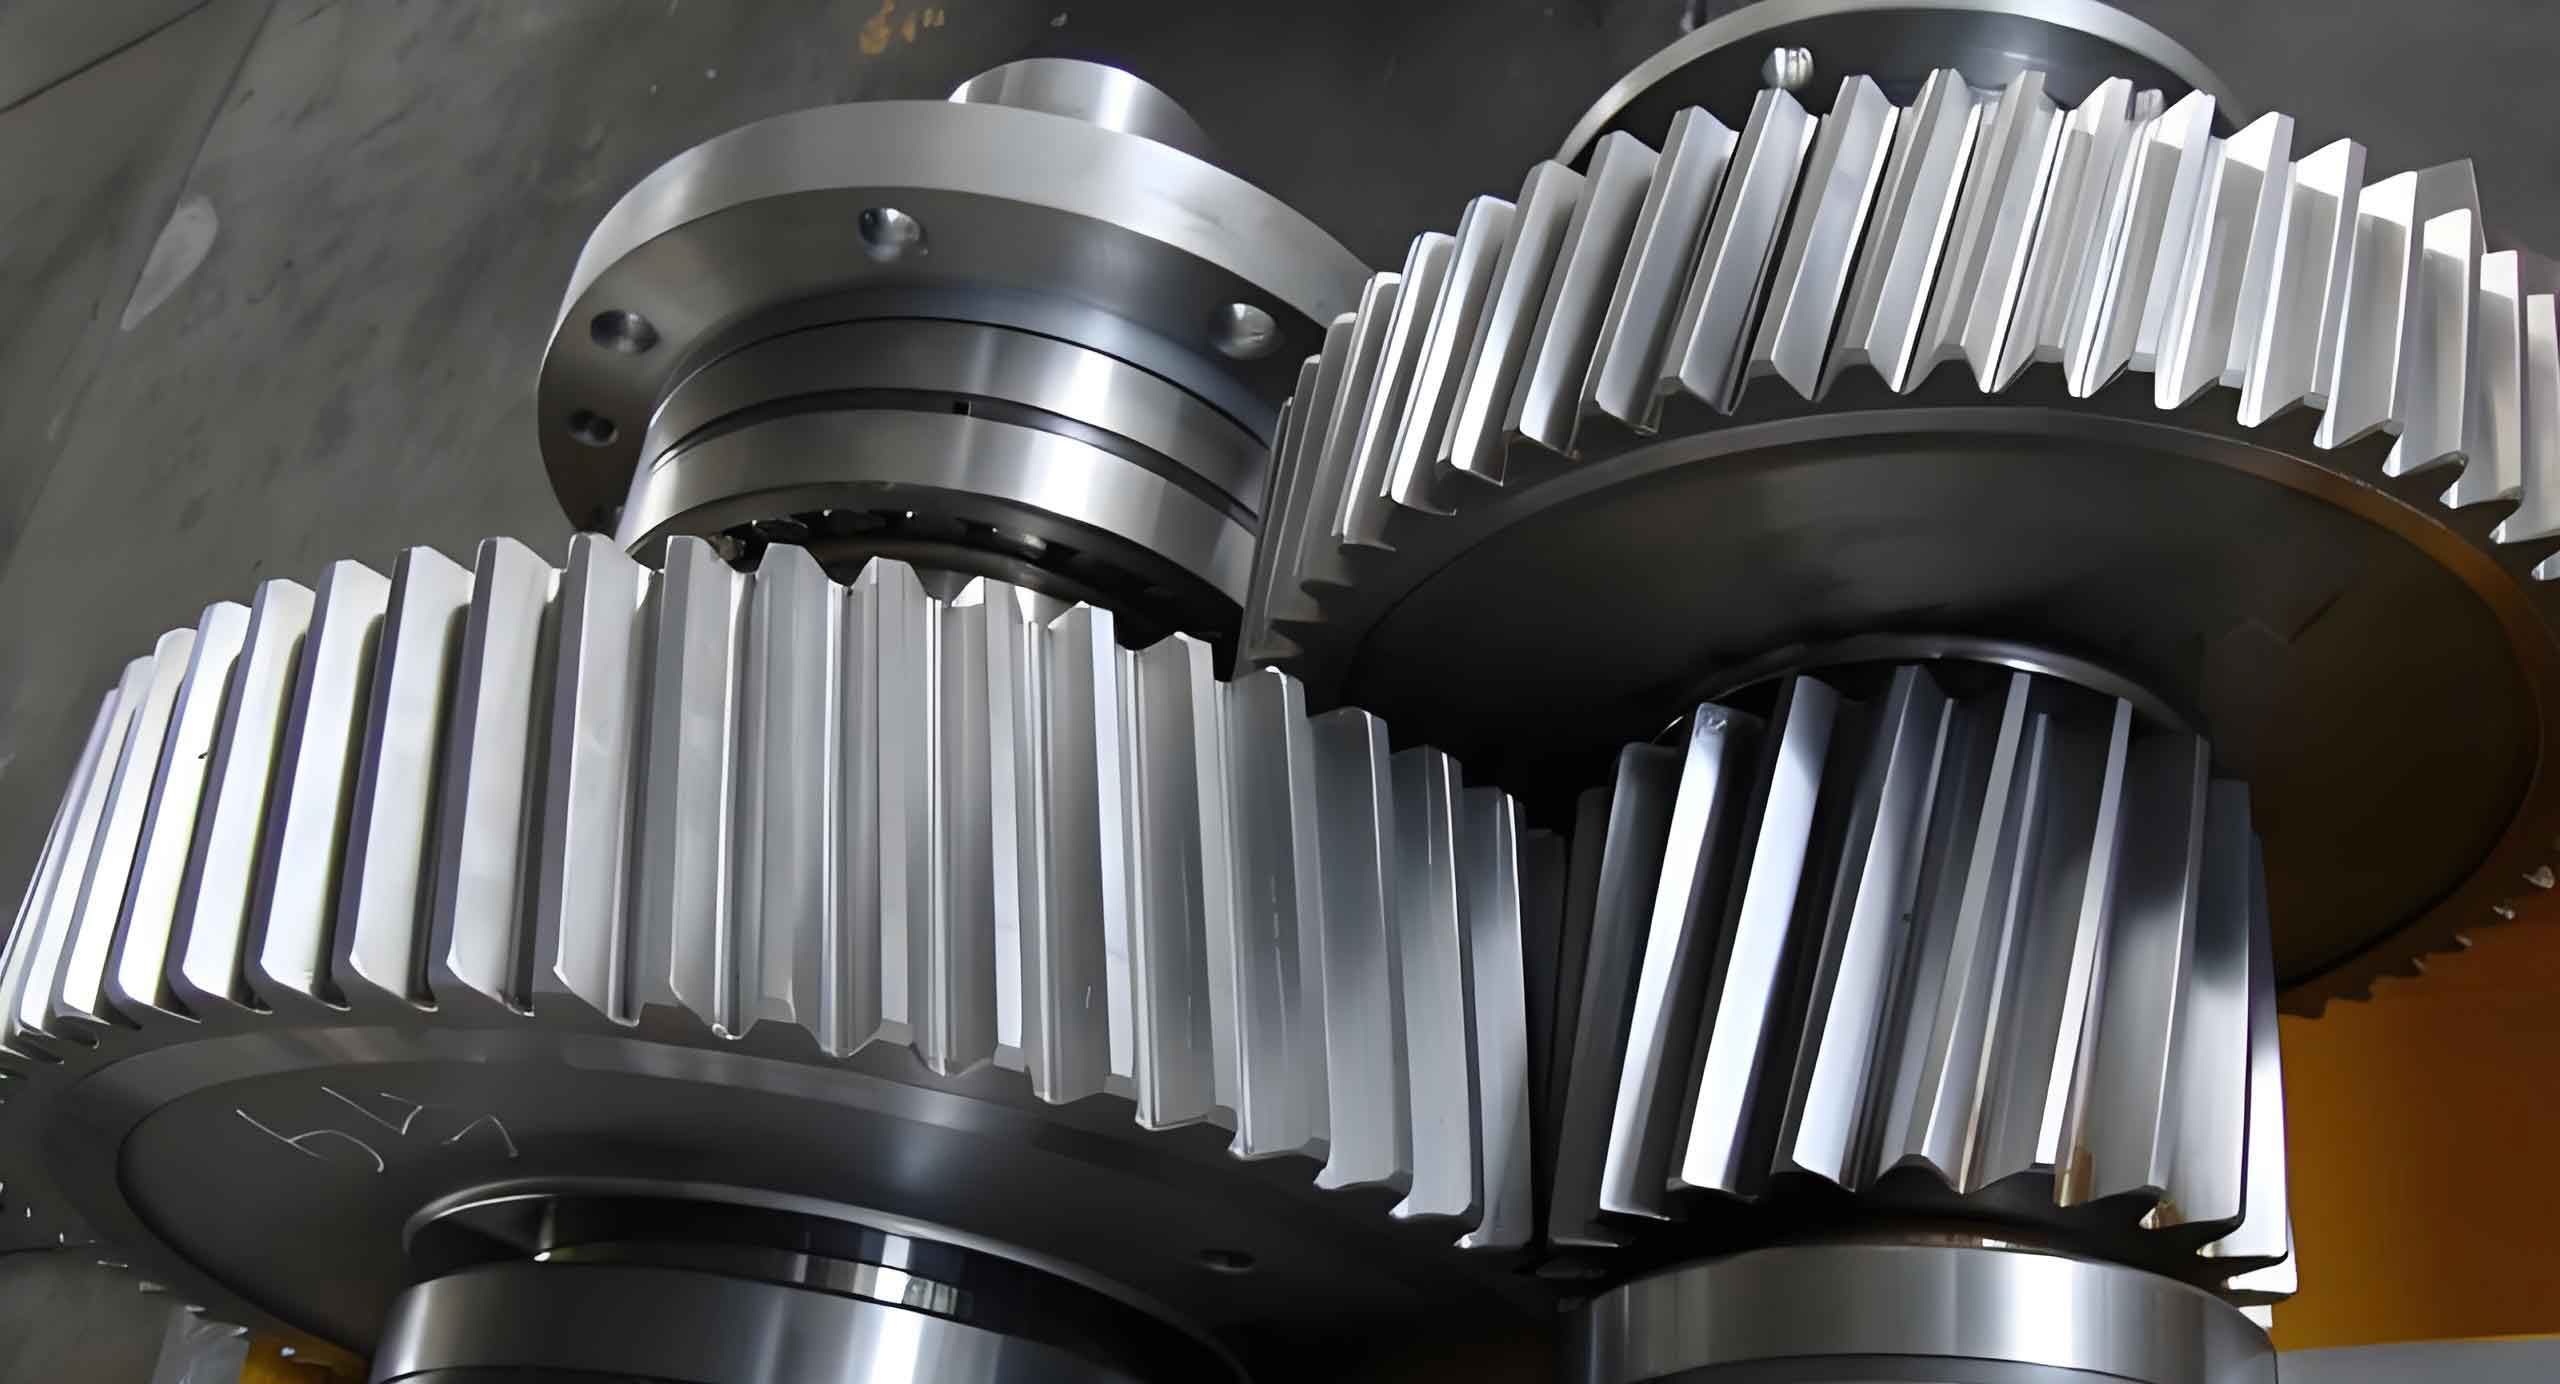
The first step in the numerical analysis was the creation of an accurate digital twin of the physical helical gear. The gear in question is an input shaft helical gear from a truck transmission, featuring a main helical section and a smaller synchronizer engagement ring. Using CATIA software, a parametric 3D solid model was constructed. This approach ensures that any future design modifications can be efficiently propagated. The key geometric parameters defining the helical gear are summarized in the table below.
| Component | Parameter | Symbol | Value |
|---|---|---|---|
| Main Helical Gear | Number of Teeth | $Z_h$ | 29 |
| Normal Module | $m_n$ | 5.5 mm | |
| Pressure Angle | $\alpha$ | 20° | |
| Helix Angle | $\beta$ | 23° | |
| Face Width | $b$ | 46 mm | |
| Synchronizer Ring | Number of Teeth | $Z_s$ | 39 |
| Module | $m_s$ | 2 mm | |
| Face Width | $b_s$ | 7 mm |
The transition from a geometric model to an analyzable finite element model is a critical step that dictates solution accuracy and computational cost. The CATIA model was imported directly into HyperMesh, a powerful pre-processor. The complex geometry of the helical gear was discretized using a predominantly tetrahedral element mesh. A global element size of 2 mm was specified to balance detail and computational efficiency. The meshing process involved careful topology cleanup and local refinement in regions with high curvature, such as the tooth root fillets and the transition between the main gear body and the synchronizer ring, to capture stress concentrations and dynamic behavior accurately. The final FE model of the helical gear consisted of 232,066 solid elements and 52,462 nodes. Material properties for standard alloy steel were assigned: Young’s Modulus $E = 2.0 \times 10^{11}$ Pa, Poisson’s ratio $\nu = 0.3$, and density $\rho = 7850$ kg/m³.
The finite element model was then solved in ANSYS Workbench using the Block Lanczos eigenvalue extraction algorithm. A free-free boundary condition was applied, meaning the helical gear was unconstrained—this simulates its natural vibration state and allows for the identification of rigid body modes. The analysis focused on extracting modes within the 0-10 kHz range, as higher-order modes typically have diminishing influence on the dynamic response in such applications. The first six modes had frequencies near zero, corresponding to the six rigid-body degrees of freedom (three translations and three rotations). These were ignored for the structural analysis. The first ten flexible natural frequencies and their associated mode shapes are presented below.
| Mode Order (Flexible) | Natural Frequency (Hz) – FEA | Primary Mode Shape Description |
|---|---|---|
| 1 (7th overall) | 2233.6 | Circumferential bending, max displacement at synchronizer ring. |
| 2 (8th overall) | 2339.6 | Circumferential bending, orthogonal to Mode 1. |
| 3 (9th overall) | 3526.3 | Axial “breathing” or shell-type deformation. |
| 4 (10th overall) | 3539.0 | Axial “breathing”, slightly different nodal pattern. |
| 5 (11th overall) | 5736.2 | Higher-order circumferential bending/warping. |
| 6 (12th overall) | 5736.7 | Higher-order circumferential bending/warping, orthogonal pair. |
| 7 (13th overall) | 8938.1 | Complex combined bending (circumferential and axial). |
| 8 (14th overall) | 8938.3 | Complex combined bending, orthogonal pair. |
| 9 (15th overall) | 9806.0 | High-frequency localized deformation on teeth. |
| 10 (16th overall) | 9836.5 | High-frequency localized deformation, orthogonal pair. |
A key observation from the FEA results is the presence of closely spaced or identical frequency pairs (e.g., Modes 1 & 2, 3 & 4, 5 & 6, 7 & 8, 9 & 10). This is a direct consequence of the near-cylindrical symmetry of the helical gear body. Slight differences arise from the helical teeth and the attached synchronizer ring, which break perfect symmetry. The mode shapes evolve from global body bending at lower frequencies to more complex shell-like deformations and finally to localized tooth flexure at higher frequencies. Understanding this progression is vital for predicting which parts of the helical gear are most susceptible to vibration under different excitation sources.
To validate the finite element model and results, an Experimental Modal Analysis (EMA) was performed using an impact hammer test. The physical helical gear was suspended freely using soft elastic cords to simulate free-free boundary conditions. A tri-axial accelerometer was fixed at a single reference point on the gear body. An instrumented impact hammer was then used to excite the helical gear at 48 distinct measurement points defined on a wireframe geometry model. The force input (from the hammer) and acceleration response (from the fixed sensor) signals were acquired simultaneously using a multi-channel data acquisition system running LMS Test.Lab software.
The Frequency Response Functions (FRFs) between each input point and the response point were calculated. The set of 48 FRFs forms the experimental basis for modal parameter identification. The PolyMAX algorithm, known for its robust stabilization diagram generation, was employed within the LMS software to extract the modal parameters (frequency, damping, and mode shape) from the measured FRFs. The experimental natural frequencies for the first nine flexible modes are listed in the comparison table below.
| Mode Order | Natural Frequency – Test (Hz) | Natural Frequency – FEA (Hz) | Absolute Error (Hz) | Relative Error (%) |
|---|---|---|---|---|
| 1 | 2215.3 | 2233.6 | 18.3 | 0.83 |
| 2 | 2235.0 | 2339.6 | 104.6 | 4.68 |
| 3 | 3556.8 | 3526.3 / 3539.0 | ~30 / ~18 | ~0.85 / ~0.51 |
| 4 | 5703.0 | 5736.2 | 33.2 | 0.58 |
| 5 | 5757.5 | 5736.7 | 20.8 | 0.36 |
| 6 | 9030.5 | 8938.1 | 92.4 | 1.02 |
| 7 | 9045.3 | 8938.3 | 107.0 | 1.18 |
| 8 | 9901.0 | 9806.0 | 95.0 | 0.96 |
| 9 | 9933.6 | 9836.5 | 97.1 | 0.98 |
The correlation between the FEA and experimental results is excellent, with relative errors generally below 1.5% for most modes. The slightly higher error for Mode 2 can be attributed to the sensitivity of this specific mode shape to small geometric imperfections or boundary condition discrepancies that are perfectly modeled in FEA but present in the real helical gear. Sources of the minor discrepancies universally include:
1. Idealization in FEA: The finite element model discretizes a continuous system, introduces geometric simplifications for meshing, and assumes perfectly homogeneous material properties.
2. Test Conditions: True free-free conditions are difficult to achieve; residual stiffness from the suspension and minor damping (neglected in the eigenvalue solution) affect measured frequencies.
3. Parameter Identification: The curve-fitting process in experimental modal analysis has its own inherent estimation errors.
The close agreement validates the fidelity of the finite element model of the helical gear, establishing it as a reliable tool for further dynamic simulations (e.g., forced response, noise radiation) and design optimization.
The ultimate purpose of a modal analysis is to inform design decisions and prevent failures. For this specific helical gear, which is mounted on the input shaft of a truck transmission, the primary excitation sources are the engine firing orders and the meshing frequency with its mating gear. The meshing frequency $f_m$ is calculated as:
$$f_m = \frac{N \times n}{60}$$
where $N$ is the number of teeth on the helical gear (29) and $n$ is the rotational speed in RPM. The first critical speed, corresponding to the first natural frequency $f_1 \approx 2230$ Hz, is:
$$n_{critical} = \frac{60 \times f_1}{N} = \frac{60 \times 2230}{29} \approx 4614 \text{ RPM}$$
Since this helical gear is used with a diesel engine whose maximum operational speed is typically below 3500 RPM, and considering the meshing frequency at this max speed is $f_m = (29 \times 3500)/60 \approx 1692$ Hz, which is also safely below the first natural frequency, there is a significant margin against resonance. The analysis confirms that the design of this helical gear is dynamically robust for its intended application.
This comprehensive study successfully demonstrates an integrated approach to modal analysis of a critical helical gear component. By leveraging CATIA for precise geometry creation, HyperMesh for high-fidelity finite element modeling, ANSYS for numerical simulation, and LMS Test.Lab for experimental validation, a high degree of confidence in the dynamic characteristics was achieved. The identified natural frequencies and mode shapes provide a crucial map of the helical gear’s dynamic behavior. This information is foundational for:
1. Resonance Avoidance: Ensuring operational speeds and excitation frequencies do not coincide with the identified natural frequencies.
2. Forced Response Prediction: Using the modal basis to predict vibration levels under operational loads.
3. Design Optimization: Guiding modifications to the helical gear’s geometry (e.g., web thickness, bore size, tooth profile) to shift natural frequencies away from excitation bands or alter mode shapes to reduce acoustic radiation.
The established workflow and validated model serve as a powerful template for the dynamic analysis and design refinement of helical gears and similar rotational components across various engineering disciplines.