
In recent years, the rapid expansion of the new energy vehicle sector and the intensifying competition in the domestic automotive market have heightened consumer expectations for automotive technology. As the penetration rate of new energy vehicles gradually increases, it heralds the imminent era of “electricity surpassing oil” in the automotive market. As a leading enterprise in new energy vehicles, Tesla not only initiated the first shot in the price war but also triggered a wave of internal competition across the national automotive industry. This competition is reflected not only in prices but also in technological research and development, market layout, and multiple other aspects. In this context, every detail of automotive technology becomes crucial. Helical gears, as core components of reducers in automotive power transmission systems, have a significant impact on the overall energy efficiency performance of vehicles due to power losses during operation. Relevant research indicates that gear meshing power loss constitutes a major portion of gear transmission losses, with sliding friction loss being the primary factor affecting meshing efficiency. Churning loss, on the other hand, is influenced by various factors such as the kinematic viscosity of the lubricating oil, operating temperature, gear parameters, immersion depth of gears, local gravitational values, etc., making the calculation of helical gear power loss a complex functional relationship.
In this study, I investigate the helical gear transmission mechanism in pure electric vehicle reducers, exploring various energy losses that may arise during gear rotation. Utilizing Amesim simulation software, I simulate power losses under diverse scenarios and propose a power loss model for helical gears in operating reducers, along with relevant power loss formulas. During the Amesim simulation analysis, a PID speed control strategy is employed, with parameters determined based on actual conditions to ensure precise regulation of gear speeds and enhance the accuracy and reliability of the simulation results. The simulation model can replicate various loss situations in the helical gears of a two-stage reducer during vehicle operation. Comparisons using different helical gear parameters reveal that sliding friction is the primary source of power loss during gear engagement. As the number of gear teeth increases, total power loss decreases. Larger helical angles lead to greater total power loss. These conclusions provide a theoretical foundation for gear parameter optimization and design.
Related Calculations for Helical Gears
Helical gears are widely used in automotive reducers due to their smooth operation, high load capacity, and reduced noise compared to spur gears. The design of helical gears involves several key parameters that influence their performance and efficiency.
Selection of Helical Gear Parameters
For daily household electric vehicles, the maximum speed is typically around 16,000 rpm, with a peak motor torque of 320 N·m. Therefore, the gears are designed for high rotational speeds and significant load-bearing capacity. In automotive reducers, the design often targets a contact ratio ε > 4 and a transmission error (TE) < 0.25 μm. The contact ratio for helical gears is represented by ε, and its calculation formula is:
$$ \varepsilon = \frac{1}{2\pi} \left\{ z_1 [\tan(\alpha_{a1}) – \tan(\alpha)] \pm z_2 [\tan(\alpha_{a2}) – \tan(\alpha)] \right\} $$
where:
- $\alpha_{a1}$ is the pressure angle at the tip circle of the driving gear,
- $\alpha_{a2}$ is the pressure angle at the tip circle of the driven gear,
- $\alpha$ is the meshing angle of the helical gear,
- $z_1$ is the number of teeth on the driving gear,
- $z_2$ is the number of teeth on the driven gear,
- the “±” sign is “+” for external meshing and “−” for internal meshing.
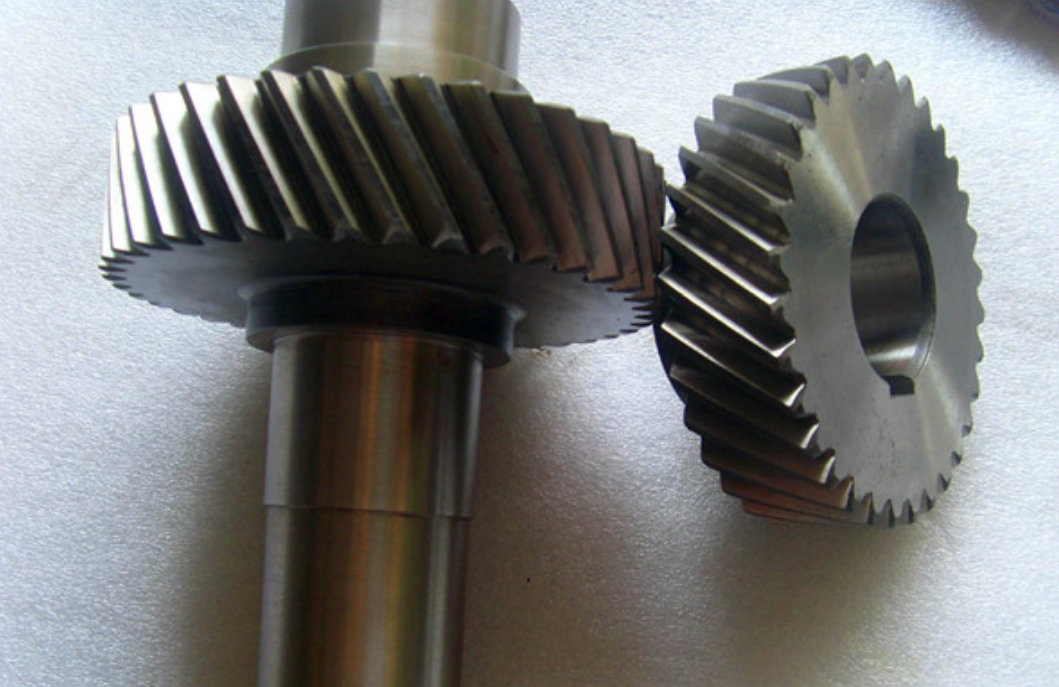
The helical gear pair model is essential for understanding the meshing behavior. Below is a visual representation of a typical helical gear pair used in reducers:
Contact Stress of Helical Gears
Taking a helical gear pair and its transmission bearings from an automotive reducer as the research object, I establish a model for one set of helical gear pairs. The meshing contact stress is calculated as follows:
$$ \sigma_H = Z_{B(D)} \sigma_{H0} \sqrt{K_A K_V K_{H\beta} K_{H\alpha}} $$
The nominal tooth surface contact stress is:
$$ \sigma_{H0} = Z_H Z_E Z_\varepsilon Z_\beta \sqrt{\frac{F_t}{d_1 b} \cdot \frac{u + 1}{u}} $$
where:
- $K_A$ is the application factor,
- $K_V$ is the dynamic factor,
- $K_{H\beta}$ is the face load factor for contact strength calculation,
- $K_{H\alpha}$ is the transverse load factor for contact strength calculation,
- $Z_B$ and $Z_D$ are the single pair tooth contact factors,
- $F_t$ is the nominal tangential force at the reference circle,
- $b$ is the working tooth width (smaller value),
- $d_1$ is the reference diameter of the pinion,
- $Z_H$ is the zone factor,
- $Z_E$ is the elasticity factor,
- $Z_\varepsilon$ is the contact ratio factor,
- $Z_\beta$ is the helix angle factor.
To summarize the key parameters and their typical values for helical gears in automotive reducers, I present the following table:
| Parameter | Symbol | Typical Range | Unit |
|---|---|---|---|
| Number of Teeth (Pinion) | $z_1$ | 18-30 | – |
| Number of Teeth (Gear) | $z_2$ | 50-100 | – |
| Module | $m$ | 1.5-3.0 | mm |
| Helix Angle | $\beta$ | 20°-35° | ° |
| Pressure Angle | $\alpha$ | 20°-25° | ° |
| Face Width | $b$ | 10-20 | mm |
| Contact Ratio | $\varepsilon$ | > 4 | – |
Calculation of Helical Gear Power Loss
Power loss in helical gears is a critical factor affecting the overall efficiency of automotive reducers. The losses can be categorized into several types, including tooth surface friction loss, churning loss, and bearing friction loss. Each of these contributes to the total power dissipation and must be carefully analyzed.
Tooth Surface Friction Power Loss
During the meshing process of helical gears, due to microscopic irregularities on the tooth surfaces and relative motion during meshing, various types of power losses occur, which in turn affect the transmission efficiency. The friction power loss of gears mainly consists of two parts: rolling friction power loss and sliding friction power loss between the helical gears. The sum of these two losses can approximate the total friction power loss. Sliding friction loss in helical gear meshing primarily arises because, at the meshing point, the relative velocities differ, leading to relative motion between the tooth surfaces and consequent energy loss. Friction power loss is related to the average sliding and average load at the meshing point, while rolling power loss is associated with the lubricant film at the gear contact surfaces. The total friction power loss of helical gears is obtained by adding the sliding friction power loss and rolling friction power loss. The relevant formulas for friction losses are as follows:
$$ P_F = P_f + P_n $$
where $P_F$ is the total friction power loss (kW), $P_f$ is the sliding friction power loss (kW), and $P_n$ is the rolling friction power loss (kW).
The sliding friction power loss is given by:
$$ P_f = \frac{f F_n v_s}{1000} $$
The rolling friction power loss is:
$$ P_n = \frac{0.09 h v_t b \varepsilon_\alpha}{\cos \beta} $$
The sliding friction coefficient $f$ is calculated as:
$$ f = 0.0127 \times \lg \left( \frac{29660 F_n \cos \beta}{b \mu v_s v_t} \right) $$
The normal force $F_n$ is:
$$ F_n = \frac{T}{r_1 \cos \alpha \cos \beta} $$
The sliding velocity $v_s$ is:
$$ v_s = 0.02618 n h \left( \frac{z_1 + z_2}{z_2} \right) $$
The rolling velocity $v_t$ is:
$$ v_t = 0.2094 n \left[ r_1 \sin \alpha – 0.125 h \left( \frac{z_1 – z_2}{z_2} \right) \right] $$
The oil film thickness $h$ is:
$$ h = 2.051 \times 10^{-7} \times (v_t \mu)^{0.67} (F_n)^{-0.067} \rho^{0.464} $$
The transverse contact ratio $\varepsilon_\alpha$ is:
$$ \varepsilon_\alpha = \frac{h}{\pi m \cos \alpha} $$
where:
- $f$ is the sliding friction coefficient,
- $h$ is the oil film thickness (mm),
- $b$ is the face width (mm),
- $\varepsilon_\alpha$ is the transverse contact ratio,
- $\beta$ is the helix angle,
- $\mu$ is the dynamic viscosity coefficient (Pa·s),
- $n$ is the gear rotational speed (rpm),
- $h$ is the length of the line of action (mm),
- $z_1$ is the number of teeth on the driving gear,
- $z_2$ is the number of teeth on the driven gear,
- $\alpha$ is the pressure angle,
- $r_1$ is the reference radius of the driving gear (mm),
- $T$ is the torque (N·m),
- $\rho$ is the radius of curvature at the contact point (mm),
- $m$ is the module.
To illustrate the relationships between these parameters, I present a table summarizing the variables involved in helical gear friction loss calculations:
| Variable | Description | Typical Units |
|---|---|---|
| $P_F$ | Total friction power loss | kW |
| $P_f$ | Sliding friction power loss | kW |
| $P_n$ | Rolling friction power loss | kW |
| Sliding friction coefficient | – | |
| $F_n$ | Normal force | N |
| $v_s$ | Sliding velocity | m/s |
| $v_t$ | Rolling velocity | m/s |
| $h$ | Oil film thickness | mm |
| $\mu$ | Dynamic viscosity | Pa·s |
| $\rho$ | Radius of curvature | mm |
Churning Power Loss
Churning power loss refers to the power loss caused by fluid resistance when gears rotate in an oil bath. The magnitude of this loss is closely related to gear design parameters, operating conditions, and lubricant properties. According to standards such as ISO/TR 14179-1, the calculation of churning power loss for helical gears is typically divided into several parts, including churning thermal power loss related to smooth outer diameters, smooth sides, and meshing surfaces.
The first part is the churning thermal power loss due to the smooth outer diameter $P_{j1}$:
$$ P_{j1} = \frac{7.37 f_h \mu_0 n^3 D^{4.7} L}{A_h 10^{26}} $$
The second part is the churning thermal power loss due to smooth sides $P_{j2}$:
$$ P_{j2} = \frac{1.474 f_h \mu_0 n^3 D^{5.7}}{A_h 10^{26}} $$
The third part is the churning loss due to tooth surfaces $P_{j3}$:
$$ P_{j3} = \frac{7.37 f_h \mu_0 n^3 D^{4.7} b R_f}{\tan \beta A_h 10^{26}} $$
The tooth surface friction coefficient $R_f$ is:
$$ R_f = 7.93 – 4.648 \frac{m_t}{D} $$
where:
- $f_h$ is the immersion factor, representing the coefficient of gear immersion in lubricating oil,
- $\mu_0$ is the dynamic viscosity of the lubricating oil,
- $n$ is the gear rotational speed,
- $D$ is the gear outer diameter,
- $L$ is the gear face width,
- $A_h$ is the churning proportionality constant,
- $b$ is the face width,
- $\beta$ is the helix angle,
- $m_t$ is the transverse module.
Calculation of Bearing Friction Loss
When helical gears mesh in a reducer, since both ends of each shaft are equipped with bearings, there is also a portion of power loss during bearing operation. Let the total bearing power loss be $P_z$, which includes bearing sliding friction power loss $M_s$, rolling friction power loss on contact surfaces $M_r$, churning power loss caused by lubricating oil $M_d$, and power loss from bearing seals $M_e$.
Bearing Sliding Friction
When bearings rotate, if the moving ring cannot provide sufficient driving force to maintain roller motion, sliding friction inside the bearing occurs. This internal sliding friction loss can be calculated as:
$$ M_s = C_s \mu_s $$
where $C_s$ is the sliding friction parameter, related to bearing type, structure, and various parameters.
The parameter $C_s$ is calculated as:
$$ C_s = K_1 d_m^{0.82} (F_r + K_2 Y F_a) $$
where:
- $K_1$ and $K_2$ are geometric constants, related to bearing type,
- $d_m$ is the pitch diameter (mm),
- $F_r$ is the radial load (N),
- $F_a$ is the axial load (N),
- $Y$ is the axial load parameter.
- $\mu_s$ is the sliding friction coefficient of the bearing, obtainable from relevant design manuals.
Bearing Rolling Friction
Due to deformation during operation, internal rollers may experience hindered rolling, leading to friction loss. The calculation formula is:
$$ M_r = \phi_x H_x C_h (v n^{0.6}) $$
where $\phi_x$ is the heat reduction coefficient due to entry, and $H_x$ is the motion starvation reduction coefficient, calculated as:
$$ H_x = \frac{1}{e^{K_{rs} v n (d + D) / [K_z (D – d)]}} $$
where:
- $d$ and $D$ are the inner and outer diameters of the bearing (mm),
- $K_{rs}$ is the starvation constant,
- $K_z$ is the geometric constant for refill, related to bearing type.
Churning Power Loss
When bearings roll, the lubricating oil in the seals creates a dragging resistance on the bearing internals, leading to friction loss. This loss is influenced by multiple factors. For roller bearings, the corresponding friction loss can be expressed as:
$$ M_d = 4 V_m K_h f_h B d_m^4 n^2 + \lambda n^2 d_m^3 \left( \frac{n d_m^2 f_t}{v} \right)^{-1.379} R_s $$
where:
- $V_m$ is the loss coefficient,
- $B$ is the bearing width (mm),
- $\lambda = 1.093 \times 10^{-7}$,
- $K_h$ is the bearing roller constant, obtainable from design manuals,
- $f_h$ is the relevant lubrication coefficient,
- $f_t$ is the oil level coefficient,
- $R_s$ is a sealing-related parameter.
According to the SKF equation, the total friction loss formula is:
$$ P_z = \frac{(M_s + M_r + M_d + M_e) n}{9549} $$
To summarize the bearing loss components, I present the following table:
| Bearing Loss Component | Symbol | Primary Influencing Factors |
|---|---|---|
| Sliding Friction Loss | $M_s$ | Bearing type, load, geometry |
| Rolling Friction Loss | $M_r$ | Deformation, speed, lubrication |
| Churning Loss | $M_d$ | Oil viscosity, speed, sealing |
| Seal Loss | $M_e$ | Seal design, friction |
| Total Bearing Loss | $P_z$ | Combination of all above |
Amesim-Based Modeling and Simulation
Modeling the reducer in 3D allows for a clearer understanding of its transmission mechanism and characteristics. Using Amesim software to simulate helical gears in a two-stage reducer enables the simulation of power loss situations corresponding to different gear parameters under actual conditions, facilitating subsequent research and exploration.
3D Modeling of the Two-Stage Reducer
Based on research needs, I established models for helical gears, transmission shafts, and bearings. The 3D model includes driving and driven gears for both stages, arranged to replicate the actual reducer structure.
Amesim Modeling
Using Amesim software, I built a simulation model. The two-stage reducer consists of two pairs of meshing helical gears and three pairs of roller ball bearings, simulating the actual structure of an automotive two-stage reducer. The parameters for the small and large gears in this model are as follows:
| Parameter | Pinion | Gear |
|---|---|---|
| Number of Teeth | 18 | 79 |
| Module (mm) | 1.75 | 1.75 |
| Face Width (mm) | 14 | 14 |
| Pressure Angle (°) | 25 | 25 |
| Helix Angle (°) | 30 | 30 |
Since gear meshing generates friction loss, leading to temperature rise, this model also includes a temperature detection system to monitor temperature changes and simulate actual working conditions. The main parameters for the small and large bearings are as follows:
| Parameter | Pinion Bearing | Gear Bearing |
|---|---|---|
| Mean Diameter (mm) | 40 | 40 |
| Friction Coefficient for Main Load | 2.5E-4 | 2.5E-4 |
| Friction Coefficient for Speed | 2 | 2 |
| Moment of Inertia (kg·m²) | 1 | 1 |
| Viscous Friction Coefficient (N·m/(r/min)) | 0.05 | 0.05 |
In this simulation, I used PID control to regulate gear speed. The speed profile for the large gear is as follows: from 0 to 1 s, the speed increases steadily from 0 rpm to 200 rpm; from 1 to 3 s, it increases from 200 rpm to 400 rpm; from 3 to 6 s, it increases from 400 rpm to 800 rpm; from 6 to 7 s, it remains constant at 800 rpm; from 7 to 13 s, it decreases steadily from 800 rpm to -800 rpm; from 13 to 14 s, it remains constant at -800 rpm; from 14 to 16 s, it increases from -800 rpm to -400 rpm; and from 16 to 18 s, it increases from -400 rpm to 0 rpm, completing one cycle.
Amesim Simulation Results
After simulating two types of friction power losses under different parameters for the large gear, the results are as follows. The comparison between sliding friction and rolling friction power loss shows that when two gears mesh, the sliding friction power loss generated by the large gear is far greater than the rolling friction power loss. Therefore, in gear design, more consideration should be given to the impact of tooth surface sliding friction on power loss.
The power loss situation for the large gear with the same other parameters but different numbers of teeth indicates that in four sets of simulations, when the number of teeth is 52, the power loss is the highest. As the number of teeth on the helical gear gradually increases, the power loss gradually decreases. This trend can be summarized by the following relationship derived from simulation data:
$$ P_{\text{total}} \propto \frac{1}{z^{0.5}} $$
where $P_{\text{total}}$ is the total power loss and $z$ is the number of teeth.
The power loss situation for the large gear with the same other parameters but different helix angles shows that the smaller the helix angle, the smaller the power loss. In four sets of simulations, when the helix angle is 5°, the power loss is the smallest. This relationship can be expressed as:
$$ P_{\text{total}} \propto \sin(\beta) $$
where $\beta$ is the helix angle.
To provide a comprehensive overview, I present a table summarizing the simulation results for different helical gear parameters:
| Simulation Case | Parameter Varied | Value | Total Power Loss (W) | Trend |
|---|---|---|---|---|
| 1 | Number of Teeth | 52 | 10.2 | Decreasing with increasing teeth |
| 2 | Number of Teeth | 65 | 8.5 | |
| 3 | Number of Teeth | 76 | 7.3 | |
| 4 | Number of Teeth | 88 | 6.8 | |
| 5 | Helix Angle | 5° | 5.1 | Increasing with increasing helix angle |
| 6 | Helix Angle | 20° | 7.9 | |
| 7 | Helix Angle | 35° | 10.5 | |
| 8 | Helix Angle | 50° | 13.2 |
Furthermore, the power loss components can be broken down into sliding, rolling, churning, and bearing losses. For a typical helical gear set with $z=65$ and $\beta=20°$, the distribution is as follows:
| Loss Component | Power Loss (W) | Percentage of Total |
|---|---|---|
| Sliding Friction Loss | 5.2 | 61.2% |
| Rolling Friction Loss | 0.8 | 9.4% |
| Churning Loss | 1.5 | 17.6% |
| Bearing Loss | 1.0 | 11.8% |
| Total Loss | 8.5 | 100% |
Discussion on Helical Gear Design Optimization
Based on the simulation results, several key insights emerge for optimizing helical gear design to minimize power loss. First, the dominance of sliding friction loss suggests that efforts should focus on reducing sliding at the tooth interfaces. This can be achieved through improved lubrication, surface treatments, or optimized tooth profiles. For instance, using high-viscosity lubricants can increase oil film thickness $h$, thereby reducing sliding friction coefficient $f$ according to the formula:
$$ f \propto \lg \left( \frac{1}{\mu} \right) $$
Second, the inverse relationship between tooth number and power loss implies that, within design constraints, increasing the number of teeth on helical gears can enhance efficiency. This is because more teeth distribute the load over a larger contact area, reducing stress and sliding velocities. The mathematical relationship can be derived from the sliding velocity formula:
$$ v_s \propto \frac{z_1 + z_2}{z_2} $$
Thus, for a fixed gear ratio, increasing $z_1$ and $z_2$ while maintaining the ratio reduces $v_s$, lowering sliding loss.
Third, the positive correlation between helix angle and power loss indicates that while larger helix angles improve smoothness and load capacity, they come at the cost of higher losses. Designers must balance these factors. The helix angle affects multiple parameters, such as the transverse contact ratio and normal force. The total power loss as a function of helix angle can be approximated by:
$$ P_{\text{total}} \approx k_1 \sin(\beta) + k_2 \cos(\beta)^{-1} $$
where $k_1$ and $k_2$ are constants derived from gear geometry and operating conditions.
Moreover, churning loss, though smaller than sliding loss, becomes significant at high speeds. The churning loss formulas show a cubic dependence on speed ($n^3$), highlighting the importance of speed management in reducer operation. For electric vehicles, where motors often operate at high rpm, reducers should be designed to minimize immersion depth or use alternative lubrication methods like spray lubrication to reduce churning.
Bearing loss, while relatively small, should not be neglected. Selecting low-friction bearings and optimizing seal designs can further improve efficiency. The SKF equation provides a framework for estimating these losses based on bearing type and load.
Conclusion
Through actual simulation using Amesim software, I draw the following conclusions: First, when a pair of helical gears mesh, the sliding friction power loss is far greater than the rolling friction power loss. Second, when the number of teeth on the large gear gradually increases while other parameters remain unchanged, the larger the number of teeth, the smaller the total power loss. Third, when the helix angle of the large gear gradually increases while other parameters remain unchanged, the larger the helix angle of the helical gear, the greater the total power loss. These findings provide a theoretical basis for optimizing helical gear parameters and designing more efficient automotive reducers. Future work could explore the combined effects of multiple parameters, such as module and pressure angle, on power loss, and validate simulation results with experimental data to further refine the models. Additionally, advanced materials and lubrication techniques could be investigated to reduce sliding friction in helical gears, ultimately enhancing the energy efficiency of electric vehicles.
In summary, this study underscores the importance of detailed power loss analysis in helical gear systems for automotive applications. By leveraging simulation tools like Amesim and incorporating theoretical models, engineers can make informed design choices that balance performance, durability, and efficiency. As the automotive industry continues to evolve toward electrification, optimizing components like helical gears will play a crucial role in achieving sustainable mobility solutions.