
In modern high-speed and heavy-duty transmission systems, such as those found in compressors, turbines, and automotive applications, helical gears are a fundamental component. Their inherent advantages, including high contact ratio, smooth meshing characteristics, and low vibration and noise, make them indispensable. However, as power densities and operational speeds increase, accurately predicting the fatigue life of these helical gears becomes a critical and challenging task in the design phase. Traditional design approaches often rely on simplified models or empirical formulas, which may not adequately capture the complex dynamic loads and stress states experienced by the gears in service, potentially leading to either over-design or unexpected failures. Therefore, a more precise and systematic methodology for fatigue life assessment and subsequent optimization is essential for ensuring reliability and longevity.
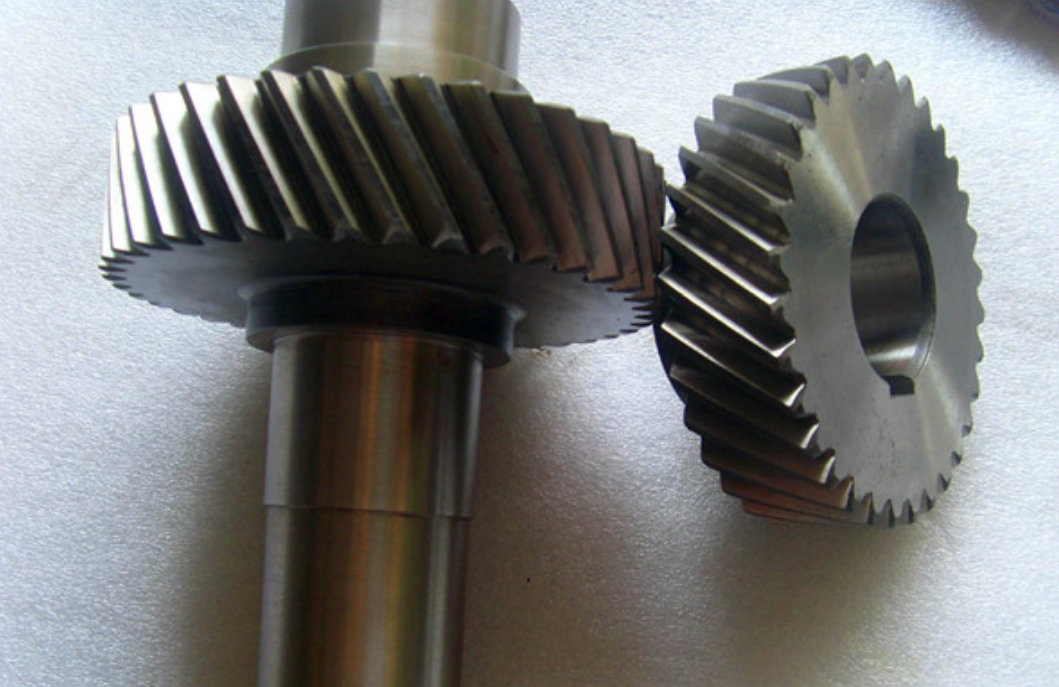
This study presents a comprehensive workflow that integrates multi-body dynamics, finite element analysis (FEA), and fatigue life simulation to address this challenge. Our primary objective is to develop a robust framework for the fatigue life prediction of helical gears and, based on the insights gained, propose a novel, data-driven modification method. We move beyond conventional, experience-based modification shapes towards a methodology guided by the actual deformation patterns of the gear teeth under load.
1. Methodology for Fatigue Life Prediction
The analysis of high-cycle fatigue, which is typical for helical gears in most operational regimes, is effectively performed using the nominal stress method. This approach is well-established and relies on the material’s S-N curve, which defines the relationship between applied stress amplitude and the number of cycles to failure. The core principle involves calculating the stress history at critical locations, typically derived from a combination of dynamic loading and detailed stress analysis, and then applying a cumulative damage rule, such as the Palmgren-Miner linear rule, to estimate the total life.
The S-N curve for a material is generally expressed by the following power-law relationship:
$$ m \lg \sigma + \lg N = \lg G $$
where $$ N $$ is the number of cycles to failure, $$ \sigma $$ is the stress amplitude, and $$ m $$ and $$ G $$ are material constants determined from fatigue testing. For the high-strength alloy steel 20CrMnMo, commonly used for high-performance gears after case-hardening, these constants for a 99% reliability level are $$ m = 15.29 $$ and $$ G = 3.68 \times 10^{56} $$. This curve forms the foundation for our subsequent fatigue life calculation within the nCode DesignLife software.
The overall workflow can be summarized in several key steps:
- Perform dynamic simulation to obtain the realistic time-domain contact force history between the meshing helical gears.
- Conduct a detailed static finite element contact analysis of the helical gear pair to establish the stress distribution and deformation field for a unit load.
- Combine the dynamic load history (load spectrum) with the unit-load FEA results to generate a full stress tensor history at every node of the model.
- Apply the material’s S-N curve and a chosen cumulative damage model to compute the fatigue life at all points, identifying the location with the minimum predicted life.
2. Dynamic and Static Simulation of the Helical Gear Pair
2.1. Dynamic Analysis for Load Spectrum Generation
We begin by modeling the dynamics of the helical gear transmission. The geometric parameters of the studied gear pair are critical inputs and are summarized below.
| Parameter | Pinion / Gear Value |
|---|---|
| Number of Teeth, Z | 112 / 63 |
| Normal Module, $$ m_n $$ (mm) | 2.5 |
| Normal Pressure Angle, $$ \alpha_n $$ (°) | 20 |
| Helix Angle, $$ \beta $$ (°) | 12.429 |
| Center Distance, $$ a $$ (mm) | 224 |
| Face Width, $$ b $$ (mm) | 80 |
| Profile Shift Coefficient, $$ x $$ | 0.1 / -0.1 |
| Input Speed (rpm) | 11,000 |
A three-dimensional model was created and imported into a multi-body dynamics software (Adams). The meshing interaction was defined using a contact-impact force algorithm based on a nonlinear spring-damper model (IMPACT function). The contact stiffness $$ K $$, a crucial parameter, is derived from Hertzian contact theory for cylindrical surfaces:
$$ K = \frac{4}{3} \sqrt{ \frac{R_1 R_2}{R_1 + R_2} } \cdot \frac{E_1 E_2}{E_2(1-\mu_1^2) + E_1(1-\mu_2^2)} $$
where $$ E_1, E_2 $$ are the elastic moduli, $$ R_1, R_2 $$ are the equivalent radii of curvature at the contact point, and $$ \mu_1, \mu_2 $$ are the Poisson’s ratios for the pinion and gear, respectively. For the steel pair, $$ K $$ was calculated to be $$ 1.56 \times 10^7 \, \text{N/mm}^{1.5} $$. The dynamic simulation was run with the pinion driven at 11,000 rpm and a resisting torque of 1,465 N·m applied to the gear.
The resulting time-domain contact force curve is the primary output. It exhibits periodic fluctuations around a mean value, directly corresponding to the variation in meshing stiffness as the number of tooth pairs in contact changes. This force history, exported as a “.dac” file, serves as the authentic operational load spectrum for the fatigue analysis, far more representative than a constant load assumption.
2.2. Static Finite Element Contact Analysis
To obtain detailed stress and deformation fields, a static nonlinear contact analysis was performed using the Finite Element Method (FEM). A segment of the helical gear pair (9 teeth on the pinion, 8 on the gear) was modeled to reduce computational cost while maintaining accuracy in the meshing zone. The model was discretized with a structured hexahedral mesh, known for its superior accuracy and convergence behavior compared to tetrahedral elements.
The contact was defined as frictional, and appropriate boundary conditions were applied to simulate the torque transmission. The analysis solved for the stress and displacement fields under a unit load condition. The results showed a maximum contact stress of approximately 603 MPa located near the tooth tip of the driven gear. More importantly, the analysis provided a full-field map of elastic strain and deformation, which is critical for the subsequent modification strategy. The total contact ratio for these helical gears was calculated to be nearly 4, indicating very smooth load sharing among multiple teeth.
3. Fatigue Life Analysis Results
The dynamic load spectrum and the static FEA results were integrated within the nCode DesignLife software. The software maps the time-varying loads onto the finite element model to create a complete stress history for every node. Using the material S-N curve for 20CrMnMo (99% reliability) and the Goodman mean stress correction method combined with the Rainflow cycle counting algorithm, the software computes the fatigue damage and life.
The fatigue life contour plot revealed the minimum life location. The predicted minimum life was $$ 7.35 \times 10^7 $$ cycles of the applied 10-second load spectrum. This translates to a total predicted fatigue life for the component under these specific operating conditions of approximately $$ 1.44 \times 10^{13} $$ cycles. The critical location with the shortest life was identified at the tooth tip region of the driven gear, correlating perfectly with the region of highest contact stress from the static analysis. This validates the consistency of the simulation chain.
4. Development of a Node-Displacement-Guided Modification Method
Gear modification, or micro-geometry optimization, is a standard practice to improve load distribution, reduce stress concentration, and dampen meshing impacts. Traditional methods often apply simple linear or parabolic profile modifications based on empirical rules or simplified deflection calculations. While beneficial, these may not be optimal for complex loaded conditions. We propose a novel, strain-analysis-guided method that directly uses the deformation field from the FEA to derive the modification curve.
4.1. Traditional Linear Modification
For benchmarking, a common linear profile modification was applied. This involves removing a small amount of material from the tip and root of the tooth profile, typically in a straight-line fashion, to prevent edge loading. For our gear parameters, a tip relief of 0.015 mm, a root relief of 0.015 mm, and a central modification of 0.005 mm were specified. Re-running the fatigue analysis with this modified geometry showed a life improvement to $$ 1.59 \times 10^{13} $$ cycles, a 10.42% increase over the unmodified baseline. This confirms the general benefit of modification but leaves room for further optimization.
4.2. Proposed Node Displacement Method
Our method is based on the principle that an ideal modification should compensate for the elastic deformation of the tooth under load, aiming to achieve a more uniform pressure distribution along the potential contact line. The procedure is as follows:
- Data Extraction: The tooth flank of the critical gear (the driven gear in our case) is virtually sliced into 10 equally-spaced longitudinal sections along the face width. On each section curve, 13 nodes are sampled from the tooth root to the tooth tip, resulting in 130 data points. The displacement magnitude (deformation under load) for each of these nodes is extracted from the static FEA results.
- Data Consolidation via Clustering: The 130 displacement values are processed using the K-Means clustering algorithm. This unsupervised machine learning technique groups the data points into $$ k $$ clusters based on their value similarity, effectively identifying the central tendency of deformation at different profile heights. We used $$ k=2 $$ clusters to separate high-deformation regions from low-deformation regions. The centroid values of these clusters serve as representative deformation targets.
- Curve Fitting for Modification Trend: The goal is to fit a smooth curve to these representative deformation points. We evaluated three fitting approaches: a high-order polynomial, a Neural Network (with ReLU activation), and a custom-defined Basis Function designed to match the expected deformation shape. The quality of fit was assessed using Root Mean Square Error (RMSE) and Mean Absolute Error (MAE).
$$ e_{RMS} = \sqrt{ \frac{1}{n} \sum_{i=1}^{n} (y_i – \hat{y}_i)^2 } $$
$$ e_{MAE} = \frac{1}{n} \sum_{i=1}^{n} | y_i – \hat{y}_i | $$
where $$ y_i $$ are the target displacement values and $$ \hat{y}_i $$ are the fitted values.
| Fitting Method | RMSE (×10⁻⁶) | MAE (×10⁻³) |
|---|---|---|
| Polynomial | 2.035 | 1.183 |
| Neural Network | 2.112 | 1.201 |
| Custom Basis Function | 1.764 | 1.150 |
The custom basis function provided the best fit. Its form, representing the modification trend curve (MTC), was determined to be:
$$ \text{MTC}(x) = -0.2944 – 0.0038x + 0.0001x^2 + 0.9998^x + \frac{0.0001}{x} $$
where $$ x $$ represents the normalized profile coordinate.
- Determining Optimal Modification Amount: The trend curve defines the shape. The magnitude of modification is determined by a scaling factor $$ \Delta_1 $$ applied to this curve. We analyzed the fatigue life for a range of $$ \Delta_1 $$ values to find the optimum.
| Modification Amount, $$ \Delta_1 $$ (mm) | Predicted Fatigue Life (×10¹³ cycles) |
|---|---|
| 0.018 | 1.66 |
| 0.019 | 1.77 |
| 0.020 | 1.80 |
| 0.021 | 1.86 |
| 0.022 | 1.80 |
| 0.023 | 1.76 |
| 0.024 | 1.70 |
| 0.025 | 1.65 |
The results clearly show an optimal modification magnitude exists. An excessive modification removes too much material, potentially weakening the tooth and altering the meshing stiffness unfavorably, leading to a drop in life. For our helical gears, the optimal amount was $$ \Delta_1 = 0.021 \, \text{mm} $$. The final corrective modification curve (CMC) is obtained by combining the optimal magnitude with the trend shape.
The resulting modification profile for these helical gears is non-standard and highly tailored to their specific loading and deformation pattern. The fatigue life achieved with this node-displacement-based modification was $$ 1.86 \times 10^{13} $$ cycles. This represents a significant 29.17% improvement over the unmodified gear and a 16.98% improvement over the traditional linear modification method.
5. Conclusion
This study establishes an integrated simulation-driven framework for the fatigue life prediction and micro-geometry optimization of high-performance helical gears. The combination of dynamic multi-body simulation, detailed finite element contact analysis, and advanced fatigue life software provides a high-fidelity virtual testing environment, enabling accurate life assessment during the design phase.
More importantly, we have introduced and validated a novel node-displacement-guided modification method. This approach marks a shift from empirically-defined modification shapes to a data-driven, physics-informed process. By directly utilizing the elastic deformation field from FEA, consolidating the data via clustering algorithms, and fitting an optimal modification curve, we can generate a tooth profile that actively compensates for load-induced deflections. The application of this method to the case study helical gears resulted in a substantial increase in predicted fatigue life compared to both the baseline and a standard linear modification.
The key advantages of this method for helical gears are its objectivity, adaptability, and precision. It is not limited to predefined modification types and can generate complex, high-order correction curves that closely match the actual deformation behavior of the specific gear pair under its operational load. This leads to a more balanced load distribution along the contact interface of the helical gears, ultimately enhancing their durability, reliability, and performance in demanding applications.