
As a researcher in the field of precision mechanical systems, I have witnessed the growing importance of rotary vector reducers, commonly known as RV reducers, in advanced automation equipment such as industrial robots and CNC machining centers. The rotary vector reducer is a key component that enables high transmission accuracy, minimal backlash, long service life, and robust performance under dynamic loads. This article aims to comprehensively review the research status of rotary vector reducers, focusing on critical aspects like transmission error, backlash, torsional stiffness, vibration characteristics, wear life, and processing technology. I will summarize findings using tables and mathematical formulations, while emphasizing the term “rotary vector reducer” throughout to highlight its significance. The discussion will also compare domestic and international progress, culminating in actionable recommendations for future research and development.
The rotary vector reducer operates on a compound planetary gear mechanism, combining a cycloidal gear stage with a parallel gear stage to achieve high reduction ratios and precision. Its structure typically includes an input shaft, planetary gears, cycloidal gears, pins, and an output flange, as illustrated below. Understanding this geometry is essential for analyzing its performance characteristics.
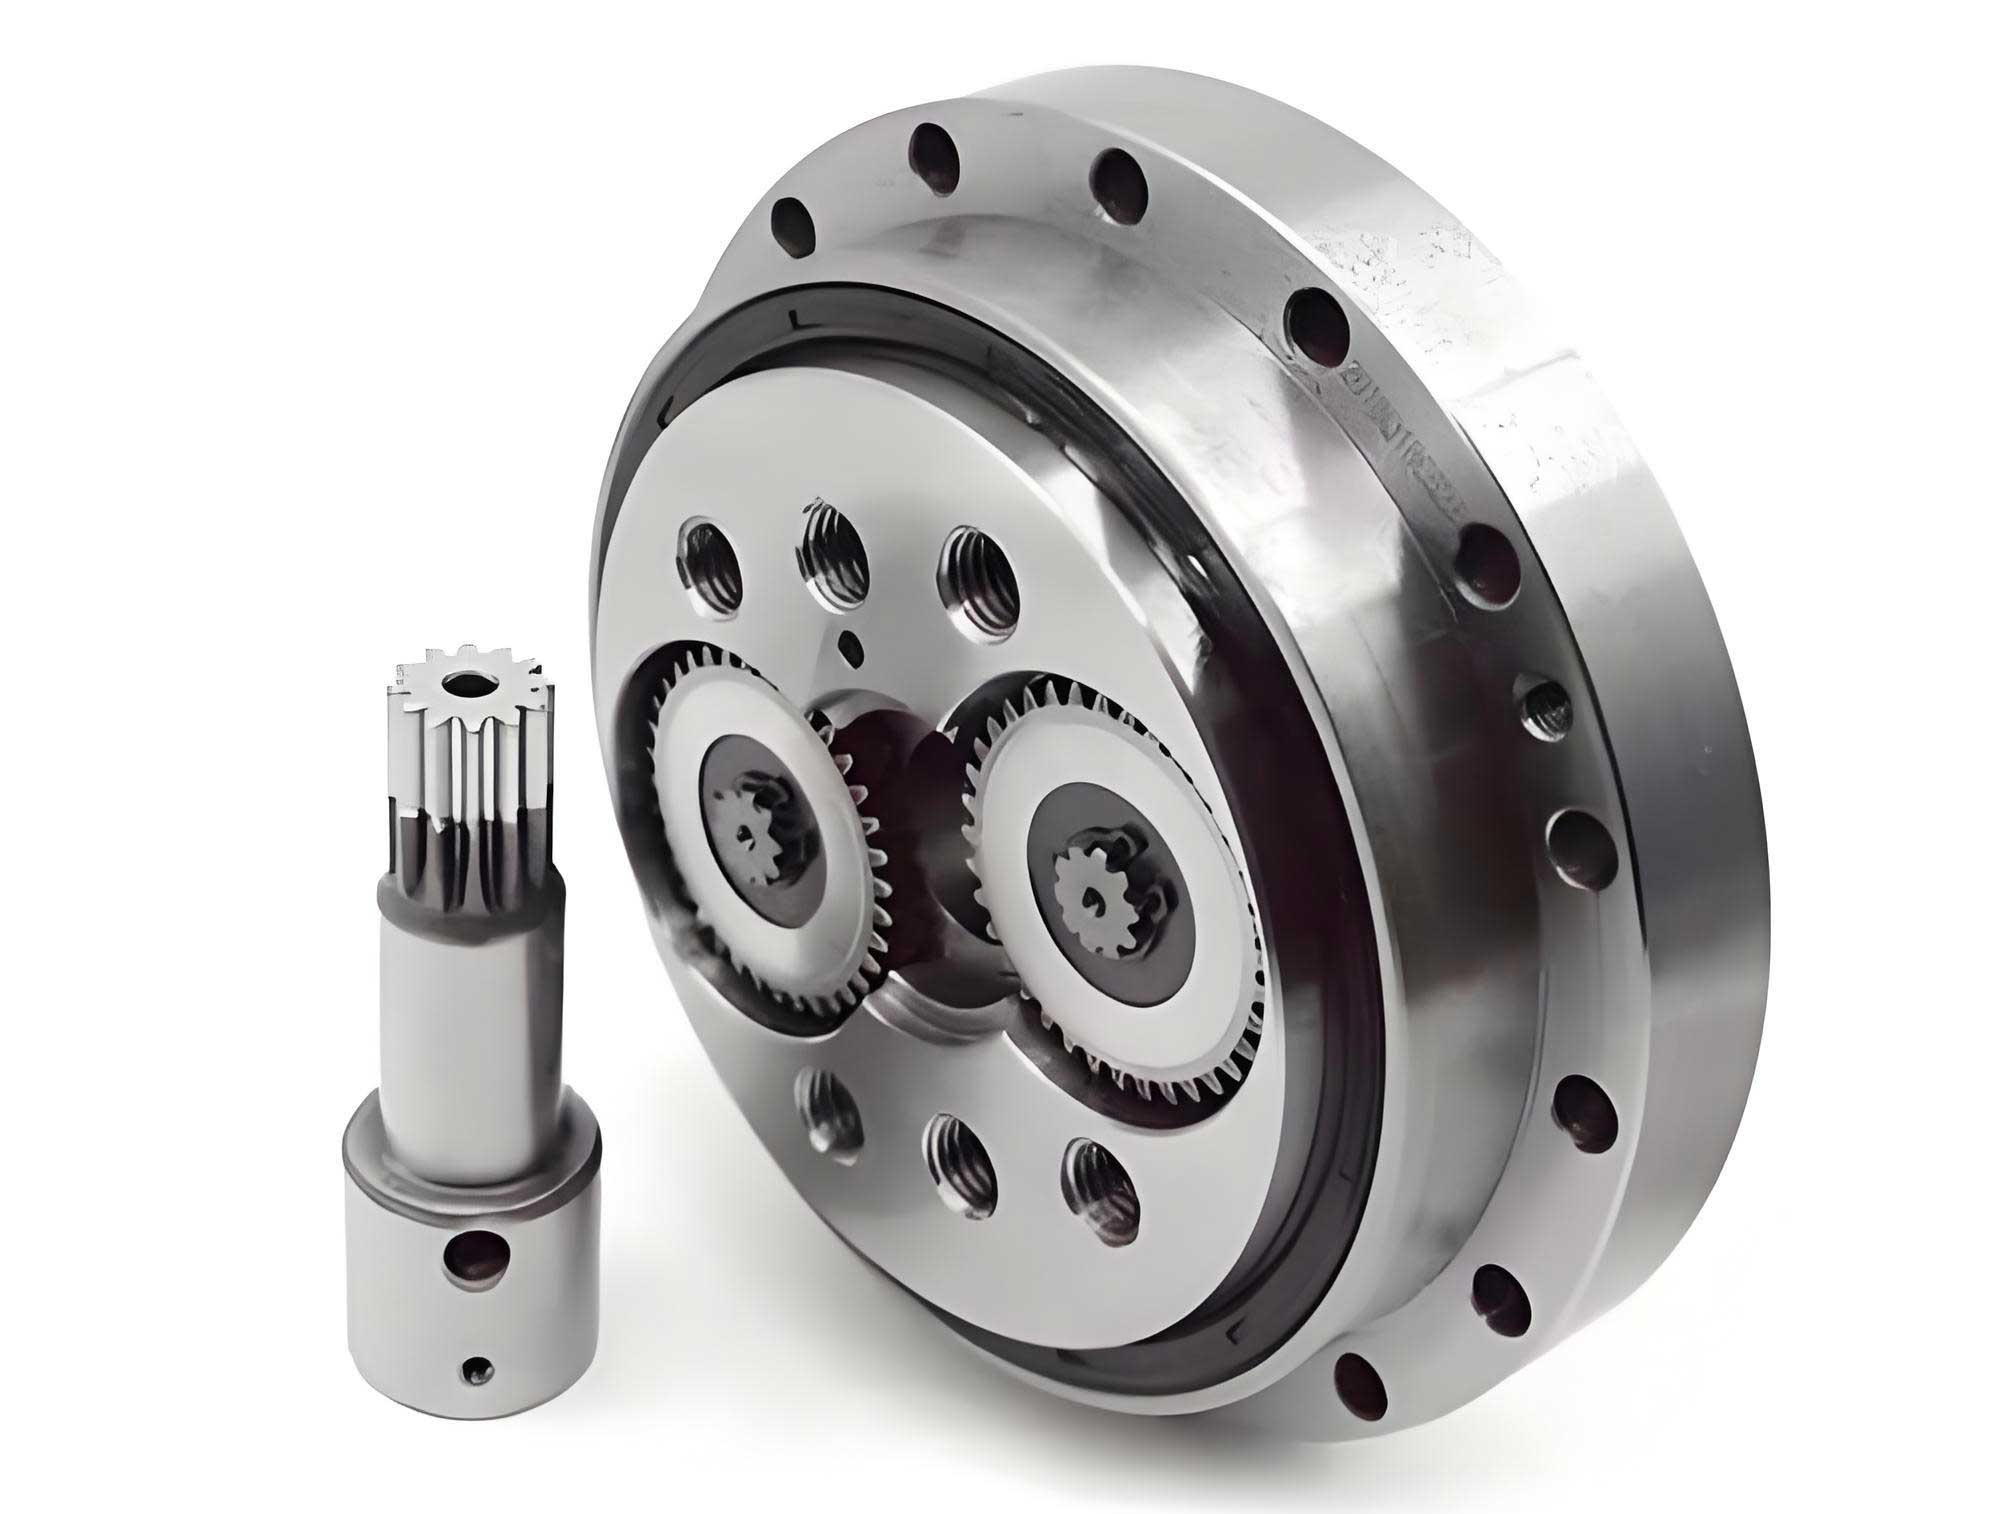
Research on rotary vector reducers can be categorized into several domains, each contributing to the overall enhancement of reducer performance. I will delve into each domain, presenting key studies, methodologies, and outcomes.
Transmission Error in Rotary Vector Reducers
Transmission error, defined as the difference between the actual and theoretical output rotation angles, is a critical metric for assessing the precision of a rotary vector reducer. It directly influences the positional accuracy of robotic arms and other精密 systems. Studies on transmission error have evolved from static geometric analyses to dynamic simulations incorporating nonlinear factors.
Early research employed geometric methods to model transmission error in cycloidal gear stages. For instance, the single-stage transmission error was calculated by considering tooth profile machining errors and assembly misalignments. The transmission error \(\Delta \theta\) can be expressed as:
$$ \Delta \theta = \theta_{\text{actual}} – \theta_{\text{theoretical}} = f(E_m, E_a) $$
where \(E_m\) represents manufacturing errors and \(E_a\) denotes assembly errors. This approach laid the groundwork for linking geometric tolerances to performance deviations. Subsequent work extended this to entire rotary vector reducer systems, using equivalent mass-spring models to simulate the effects of various errors. In such models, components are treated as rigid bodies connected by equivalent springs, allowing for the analysis of combined error influences. The equation of motion can be written as:
$$ M \ddot{x} + C \dot{x} + K x = F(t) $$
where \(M\) is the mass matrix, \(C\) the damping matrix, \(K\) the stiffness matrix, \(x\) the displacement vector, and \(F(t)\) the external force vector. This model facilitates sensitivity analysis, quantifying how individual errors contribute to overall transmission error.
Dynamic transmission error studies have incorporated finite element analysis (FEA) and multi-body dynamics to account for component flexibility. For example, rigid-flexible coupling virtual prototypes have been developed to simulate the rotary vector reducer under operational conditions, revealing that tooth clearance variations significantly impact dynamic transmission error. The transmission error in the frequency domain can be analyzed using Fourier transforms:
$$ \Delta \theta(f) = \int_{-\infty}^{\infty} \Delta \theta(t) e^{-i2\pi ft} dt $$
where \(f\) is the frequency. This helps identify resonant frequencies and vibration modes that exacerbate error.
Table 1 summarizes key research methodologies and findings in transmission error analysis for rotary vector reducers.
| Research Focus | Methodology | Key Findings | Impact on Rotary Vector Reducer |
|---|---|---|---|
| Static Geometric Analysis | Geometric modeling of tooth profiles | Quantified effects of machining and assembly errors on transmission error | Provided basis for tolerance design in rotary vector reducer manufacturing |
| Equivalent Mass-Spring Models | Lumped parameter dynamics | Enabled sensitivity analysis of multiple error sources | Improved understanding of error propagation in rotary vector reducer systems |
| Dynamic Simulations | FEA and multi-body dynamics | Identified tooth clearance as a major factor in dynamic error | Guided design optimizations for reducing vibration in rotary vector reducers |
| Experimental Measurement | Optical encoders and precision angle measurement systems | Validated theoretical models with real-world data | Enhanced calibration techniques for rotary vector reducer testing |
Recent advancements in measurement technology have led to the development of integrated test platforms capable of assessing transmission error under both no-load and loaded conditions. These systems utilize high-resolution encoders and environmental compensation algorithms to ensure accurate data acquisition, which is vital for quality control in rotary vector reducer production.
Backlash Analysis in Rotary Vector Reducers
Backlash, the angular lost motion when the direction of rotation reverses, is another pivotal performance indicator for rotary vector reducers. Excessive backlash can lead to positioning inaccuracies and reduced system responsiveness. Research on backlash encompasses both geometric backlash from component clearances and elastic backlash from torsional deformations.
The total backlash \(B_{\text{total}}\) in a rotary vector reducer can be decomposed as:
$$ B_{\text{total}} = B_{\text{geometric}} + B_{\text{elastic}} $$
where \(B_{\text{geometric}}\) arises from gaps between mating parts, and \(B_{\text{elastic}}\) results from elastic deflection under load. Geometric backlash is influenced by factors such as pin-cycloid gear clearance, bearing游隙, and assembly tolerances. For instance, the backlash due to cycloid gear modification can be modeled as:
$$ B_{\text{geometric}} = \sum_{i=1}^{n} \delta_i \cdot g_i(\theta) $$
where \(\delta_i\) represents individual clearance errors and \(g_i(\theta)\) their geometric functions over rotation angle \(\theta\).
Studies have employed static and dynamic models to analyze backlash sources. For example, probability-based approaches calculate backlash distributions by considering tolerance stack-ups. The probability density function of backlash can be expressed as:
$$ f_B(b) = \int_{-\infty}^{\infty} \prod_{i=1}^{n} f_{\delta_i}(x_i) \, db $$
where \(f_{\delta_i}\) are probability density functions of individual errors. This aids in predicting performance variations across rotary vector reducer batches.
Optimization techniques have been applied to minimize backlash. One method involves modifying the cycloid tooth profile to compensate for elastic deformations, thereby reducing effective clearance. The optimized profile deviation \(\Delta r\) can be derived from Hertzian contact theory:
$$ \Delta r = \frac{2(1-\nu^2)}{\pi E} \int_{0}^{a} p(x) \sqrt{a^2 – x^2} \, dx $$
where \(\nu\) is Poisson’s ratio, \(E\) is Young’s modulus, \(a\) is the contact half-width, and \(p(x)\) is the contact pressure distribution. This compensation enhances the precision of the rotary vector reducer.
Table 2 outlines major research contributions to backlash analysis in rotary vector reducers.
| Aspect of Backlash | Analytical Approach | Key Results | Implications for Rotary Vector Reducer Design |
|---|---|---|---|
| Geometric Backlash | Tolerance stack-up analysis | Identified pin clearance and bearing游隙 as primary contributors | Informed tighter tolerance specifications for rotary vector reducer components |
| Elastic Backlash | Finite element simulation | Quantified torsional deflections under load | Motivated use of stiffer materials in rotary vector reducer construction |
| Probabilistic Modeling | Statistical methods | Predicted backlash distributions for quality assurance | Enabled six-sigma manufacturing processes for rotary vector reducers |
| Compensation Techniques | Tooth profile optimization | Reduced backlash by up to 30% in experimental tests | Improved positioning accuracy of rotary vector reducer-driven systems |
Experimental backlash measurement has evolved from simple hysteresis curve methods to integrated testers that evaluate backlash across multiple operating conditions. These testers employ torque sensors and angular encoders to capture dynamic backlash behavior, providing comprehensive data for rotary vector reducer validation.
Torsional Stiffness of Rotary Vector Reducers
Torsional stiffness, defined as the ratio of applied torque to the resulting angular deformation, determines the rotary vector reducer’s ability to maintain precision under load. High torsional stiffness is essential for applications requiring high dynamic response and minimal deflection. Research in this area has progressed from simplified analytical models to detailed finite element analyses.
The torsional stiffness \(K_t\) of a rotary vector reducer can be expressed as:
$$ K_t = \frac{T}{\Delta \phi} $$
where \(T\) is the applied torque and \(\Delta \phi\) is the torsional angle. In a multi-stage reducer, the overall stiffness is influenced by the stiffness of individual components, such as gears, bearings, and shafts. A lumped parameter model can represent the system as a series of springs and masses. For instance, the equivalent stiffness for the cycloid stage is given by:
$$ \frac{1}{K_{\text{eq}}} = \sum_{i=1}^{m} \frac{1}{K_i} $$
where \(K_i\) are the stiffnesses of mating tooth pairs and bearing supports. This model helps identify the weakest links in the rotary vector reducer assembly.
Finite element analysis has been used to simulate the stress and deformation of rotary vector reducer components under load. Studies show that bearing support stiffness significantly affects overall torsional stiffness. The contact stress between cycloid gear and pins can be calculated using Hertz theory:
$$ \sigma_c = \sqrt{\frac{F E^*}{\pi R^*}} $$
where \(F\) is the normal load, \(E^*\) is the equivalent Young’s modulus, and \(R^*\) is the equivalent radius of curvature. High contact stresses may lead to reduced stiffness due to localized yielding.
Dynamic torsional stiffness, which varies with frequency, is crucial for vibration analysis. The frequency-dependent stiffness \(K_t(\omega)\) can be derived from impedance measurements:
$$ K_t(\omega) = \frac{T(\omega)}{\phi(\omega)} $$
where \(\omega\) is the angular frequency. This parameter is vital for designing rotary vector reducers for servo applications where bandwidth is critical.
Table 3 summarizes research on torsional stiffness in rotary vector reducers.
| Research Methodology | Key Parameters Analyzed | Findings | Impact on Rotary Vector Reducer Performance |
|---|---|---|---|
| Lumped Parameter Models | Gear mesh stiffness, bearing stiffness | Bearing support is the dominant factor in overall stiffness | Led to optimized bearing selection for rotary vector reducers |
| Finite Element Analysis | Stress distribution, deformation | Identified high-stress regions in cycloid gears | Informed geometric reinforcements in rotary vector reducer design |
| Experimental Testing | Torque-angle hysteresis loops | Validated theoretical stiffness values | Provided benchmark data for rotary vector reducer certification |
| Dynamic Characterization | Frequency response functions | Revealed stiffness degradation at resonant frequencies | Guided damping solutions for rotary vector reducer vibrations |
Advanced testing rigs have been developed to measure torsional stiffness under various load conditions. These rigs use servo motors and torque transducers to apply controlled torques, while laser interferometers measure angular deflections with micron-level accuracy, ensuring reliable assessment of rotary vector reducer rigidity.
Vibration and Fault Diagnosis in Rotary Vector Reducers
Vibration and noise are indicators of the rotary vector reducer’s health and operational smoothness. Excessive vibration can lead to premature wear and failure. Research in this domain focuses on understanding vibration mechanisms, developing measurement techniques, and implementing fault diagnosis systems.
The vibration response of a rotary vector reducer can be modeled using multi-degree-of-freedom systems. The equations of motion considering time-varying mesh stiffness \(k_m(t)\) and damping \(c\) are:
$$ M \ddot{x} + C \dot{x} + K(t) x = F_{\text{exc}}(t) $$
where \(K(t)\) includes \(k_m(t)\), which varies with gear rotation. The natural frequencies \(\omega_n\) and mode shapes are obtained by solving the eigenvalue problem:
$$ \det(K – \omega_n^2 M) = 0 $$
This analysis helps identify critical frequencies that may excite resonances in the rotary vector reducer.
Experimental vibration studies utilize accelerometers and laser vibrometers to capture signals from reducer housings. The vibration spectrum \(S_v(f)\) reveals peaks at mesh frequencies and their harmonics:
$$ S_v(f) = \int_{-\infty}^{\infty} R_v(\tau) e^{-i2\pi f \tau} d\tau $$
where \(R_v(\tau)\) is the autocorrelation of vibration velocity. Abnormal peaks can indicate faults such as tooth wear or bearing defects.
Fault diagnosis techniques have evolved from traditional spectral analysis to machine learning-based approaches. For instance, convolutional neural networks (CNNs) are trained on vibration data to classify fault types. The classification accuracy \(A_c\) is given by:
$$ A_c = \frac{\text{Number of correct predictions}}{\text{Total predictions}} \times 100\% $$
Recent studies report accuracies above 98% for diagnosing faults in rotary vector reducers, significantly improving maintenance scheduling.
Table 4 outlines key advancements in vibration and fault diagnosis for rotary vector reducers.
| Research Area | Techniques Used | Key Outcomes | Benefits for Rotary Vector Reducer Applications |
|---|---|---|---|
| Vibration Mechanism Analysis | Modal analysis, operational deflection shapes | Mapped vibration modes to component geometries | Enabled targeted design modifications to reduce noise in rotary vector reducers |
| Signal Acquisition | High-frequency accelerometers, wireless sensors | Captured transient vibration events | Improved condition monitoring capabilities for rotary vector reducers |
| Fault Diagnosis | Machine learning (e.g., CNNs, residual networks) | Achieved high fault detection accuracy | Extended service life of rotary vector reducers through predictive maintenance |
| Noise Optimization | Acoustic emission analysis, sound pressure mapping | Identified major noise sources | Led to quieter operation of rotary vector reducer-equipped machinery |
Integrated test platforms now combine vibration measurement with torque and speed sensors, providing a holistic view of rotary vector reducer dynamics. These platforms facilitate root-cause analysis of vibrations, aiding in the design of more stable reducers.
Wear Life and Lubrication of Rotary Vector Reducers
The wear life of a rotary vector reducer dictates its reliability and precision retention over time. Lubrication plays a crucial role in minimizing wear and extending service life. Research in this area spans mixed lubrication modeling, fatigue life prediction, and material science.
The mixed lubrication regime in cycloid gear contacts involves both fluid film and asperity contact. The average film thickness \(h\) can be estimated using the Reynolds equation with surface roughness considerations:
$$ \frac{\partial}{\partial x}\left(\frac{h^3}{12\eta} \frac{\partial p}{\partial x}\right) = u \frac{\partial h}{\partial x} $$
where \(\eta\) is the dynamic viscosity, \(p\) is pressure, and \(u\) is the sliding velocity. Solutions to this equation provide insights into lubrication effectiveness in rotary vector reducers.
Wear prediction models often employ Archard’s wear equation:
$$ V = k \frac{F_n s}{H} $$
where \(V\) is wear volume, \(k\) is the wear coefficient, \(F_n\) is normal load, \(s\) is sliding distance, and \(H\) is material hardness. For rotary vector reducers, this helps estimate component lifespan based on operating conditions.
Fatigue life of bearings, a critical component in rotary vector reducers, is calculated using the Lundberg-Palmgren theory. The basic rating life \(L_{10}\) is:
$$ L_{10} = \left( \frac{C}{P} \right)^p $$
where \(C\) is the dynamic load rating, \(P\) is the equivalent load, and \(p\) is an exponent (3 for ball bearings). Advanced models incorporate lubrication and contamination factors to better predict life in rotary vector reducer applications.
Table 5 summarizes research on wear life and lubrication for rotary vector reducers.
| Research Focus | Modeling Approach | Key Insights | Implications for Rotary Vector Reducer Durability |
|---|---|---|---|
| Mixed Lubrication Analysis | Numerical simulation of fluid-structure interaction | Optimal film thickness reduces wear by up to 40% | Guided lubricant selection and surface finish specifications for rotary vector reducers |
| Wear Prediction | Finite element wear simulation | Identified critical wear zones in cycloid gears | Informed material hardening treatments for rotary vector reducer components |
| Bearing Life Calculation | Dynamic load spectrum analysis | External loads significantly reduce bearing life | Motivated load-sharing designs in rotary vector reducers |
| Accelerated Life Testing | High-cycle fatigue tests | Validated theoretical life predictions | Established reliability standards for rotary vector reducer products |
Experimental wear testing involves running rotary vector reducers under accelerated conditions while monitoring vibration and temperature. Data from such tests are used to refine life prediction models, ensuring that rotary vector reducers meet industry longevity requirements.
Processing Technology for Rotary Vector Reducers
Manufacturing processes, including machining, heat treatment, and assembly, directly impact the performance and consistency of rotary vector reducers. Advanced processing technologies are essential for achieving the tight tolerances required for high precision. Research in this domain focuses on grinding, hobbling, and quality control methods.
Grinding is a common method for finishing cycloid gear teeth. The material removal rate \(Q_w\) in grinding can be expressed as:
$$ Q_w = a_e v_w b $$
where \(a_e\) is depth of cut, \(v_w\) is workpiece speed, and \(b\) is width of cut. Optimizing these parameters minimizes errors in tooth profile. Studies have shown that wheel speed, feed rate, and grit size significantly affect surface roughness \(R_a\), which influences lubrication and wear in rotary vector reducers.
Hobbling techniques for cycloid gears have been developed based on conjugate surface principles. The tool profile is derived using coordinate transformation matrices to ensure accurate tooth generation. The transformation from tool to workpiece coordinates is given by:
$$ \begin{bmatrix} x_w \\ y_w \\ z_w \end{bmatrix} = R(\theta) \begin{bmatrix} x_t \\ y_t \\ z_t \end{bmatrix} + T $$
where \(R(\theta)\) is a rotation matrix and \(T\) is a translation vector. This method enhances the manufacturing flexibility for rotary vector reducers.
Heat treatment processes, such as carburizing and nitriding, improve the surface hardness of components. The case depth \(d_c\) can be modeled using diffusion equations:
$$ \frac{\partial C}{\partial t} = D \frac{\partial^2 C}{\partial x^2} $$
where \(C\) is carbon concentration, \(t\) is time, and \(D\) is diffusion coefficient. Proper heat treatment extends the fatigue life of rotary vector reducer gears.
Table 6 highlights key processing technologies for rotary vector reducers.
| Processing Method | Key Parameters | Research Outcomes | Impact on Rotary Vector Reducer Quality |
|---|---|---|---|
| Precision Grinding | Wheel speed, feed rate, depth of cut | Achieved surface roughness below 0.4 μm | Enhanced lubrication efficiency and reduced wear in rotary vector reducers |
| Hobbling | Tool geometry, cutting speed | Enabled batch production of accurate cycloid gears | Improved consistency in rotary vector reducer performance |
| Heat Treatment | Temperature, time, atmosphere control | Increased surface hardness to 60-62 HRC | Boosted load-carrying capacity of rotary vector reducer components |
| Assembly Techniques | Alignment tolerances, preload adjustment | Reduced assembly-induced errors by 25% | Elevated overall precision of rotary vector reducer systems |
Quality control in rotary vector reducer manufacturing involves coordinate measuring machines (CMMs) and laser scanners to verify dimensional accuracy. Statistical process control (SPC) charts are used to monitor production consistency, ensuring that each rotary vector reducer meets stringent specifications.
Comparative Analysis: Domestic vs. International Progress
The global landscape of rotary vector reducer technology shows distinct differences between domestic and international advancements. While domestic research has made significant strides in theoretical modeling and prototyping, international players often lead in product consistency, longevity, and mass production capabilities.
International studies, particularly from Japan and Europe, have long focused on holistic system optimization, integrating design, manufacturing, and testing. For example, Japanese companies have mastered tooth profile modification techniques that balance transmission error and load distribution. Their rotary vector reducers exhibit exceptional precision retention over millions of cycles, thanks to rigorous quality control and advanced material science.
Domestic research has excelled in dynamic analysis and fault diagnosis, leveraging computational tools like FEA and AI. However, challenges remain in processing technology and material heat treatment, leading to variations in product consistency. The gap is evident in areas such as bearing life and surface finish, where international rotary vector reducers often outperform domestic counterparts.
Table 7 provides a comparative overview based on key performance metrics.
| Performance Metric | International Rotary Vector Reducers | Domestic Rotary Vector Reducers | Gap Analysis |
|---|---|---|---|
| Transmission Error | Typically below 1 arc-min | Achieves 1-2 arc-min in best cases | Minor gap, closing with improved modeling |
| Backlash | Consistently under 1 arc-min | Ranges 1-3 arc-min | Significant in consistency; domestic reducers show higher variance |
| Torsional Stiffness | High and uniform across batches | Comparable but less consistent | Consistency gap due to material and processing variations |
| Wear Life | Exceeds 10,000 hours in demanding applications | Typically 6,000-8,000 hours | Substantial gap, attributed to lubrication and heat treatment |
| Production Consistency | Six-sigma quality control ensures low variability | Higher batch-to-batch variability | Major gap, impacting reliability in高端 applications |
To bridge these gaps, domestic efforts should prioritize processing technology innovation, such as developing high-precision grinding machines and advanced heat treatment facilities. Collaboration between academia and industry can accelerate the adoption of best practices for rotary vector reducer manufacturing.
Conclusions and Recommendations
In summary, the research status of rotary vector reducers reflects a dynamic field where theoretical advancements continuously inform practical improvements. From transmission error modeling to wear life prediction, studies have deepened our understanding of how design and manufacturing parameters influence performance. The rotary vector reducer remains a cornerstone of precision motion control, and its optimization is crucial for the advancement of robotics and automated machinery.
Based on this review, I recommend the following directions for future research and development:
- Enhanced Dynamic Modeling: Integrate nonlinear factors such as thermal effects, lubricant rheology, and micro-geometry imperfections into dynamic models of rotary vector reducers. This will improve the accuracy of performance predictions under real-world conditions.
- Advanced Fault Diagnosis Systems: Develop embedded sensor networks and edge computing algorithms for real-time health monitoring of rotary vector reducers. Machine learning techniques should be refined to detect incipient faults with higher sensitivity.
- Focus on Wear Life Extension: Investigate novel materials, coatings, and lubrication strategies specifically tailored for rotary vector reducers. Accelerated testing protocols should be standardized to validate life predictions.
- Processing Technology Innovation: Invest in domestic capabilities for high-precision machining and heat treatment. Research should aim to achieve surface finishes and hardness profiles comparable to international standards for rotary vector reducer components.
- Standardization and Quality Assurance: Establish comprehensive testing standards and certification processes for rotary vector reducers. This will enhance product consistency and build trust in domestic markets.
The journey toward perfecting the rotary vector reducer is ongoing, and through collaborative research and focused innovation, we can achieve reducers that meet the ever-increasing demands of precision engineering. By embracing these recommendations, the community can ensure that rotary vector reducers continue to drive progress in automation and智能制造.