
In the realm of industrial robotics, the RV reducer stands as a critical component, often regarded as the “heart” of the robot due to its pivotal role in motion transmission and precision. My research focuses on addressing a persistent challenge: the inability to accurately predict the failure rates of key components within RV reducers used in six-axis industrial robots. Existing methodologies often fall short when applied to domestically produced RV reducers, as they rely on reliability data from international handbooks that may not align with local manufacturing conditions. Therefore, I propose a novel approach that integrates fuzzy mathematics, expert evaluation, and multi-hierarchy analysis to quantify engineering insights and predict failure rates effectively. This method not only leverages data from non-electronic parts reliability databases but also incorporates the nuanced understanding of engineers regarding the RV reducer’s design, manufacturing, and operational constraints. By doing so, it provides a theoretical foundation for spare parts management and reliability growth strategies for manufacturers utilizing RV reducers.
The RV reducer is a precision speed reducer that combines a planetary gear stage and a cycloidal pin-wheel stage, offering high reduction ratios and torque capacity. Its structure typically includes components such as the input gear, planetary gears, crankshafts, cycloidal gears, pins, pin housing, and various bearings. Understanding the architecture is essential for reliability analysis. The transmission principle involves the input gear driving the planetary gears, which in turn rotate the crankshafts. These crankshafts then engage the cycloidal gears against the stationary pins, resulting in reduced output speed. This two-stage mechanism is compact but involves multiple interacting parts, each susceptible to failure due to factors like wear, fatigue, and manufacturing variances. For clarity, a visual representation of a typical RV reducer can aid in comprehending its intricate design.
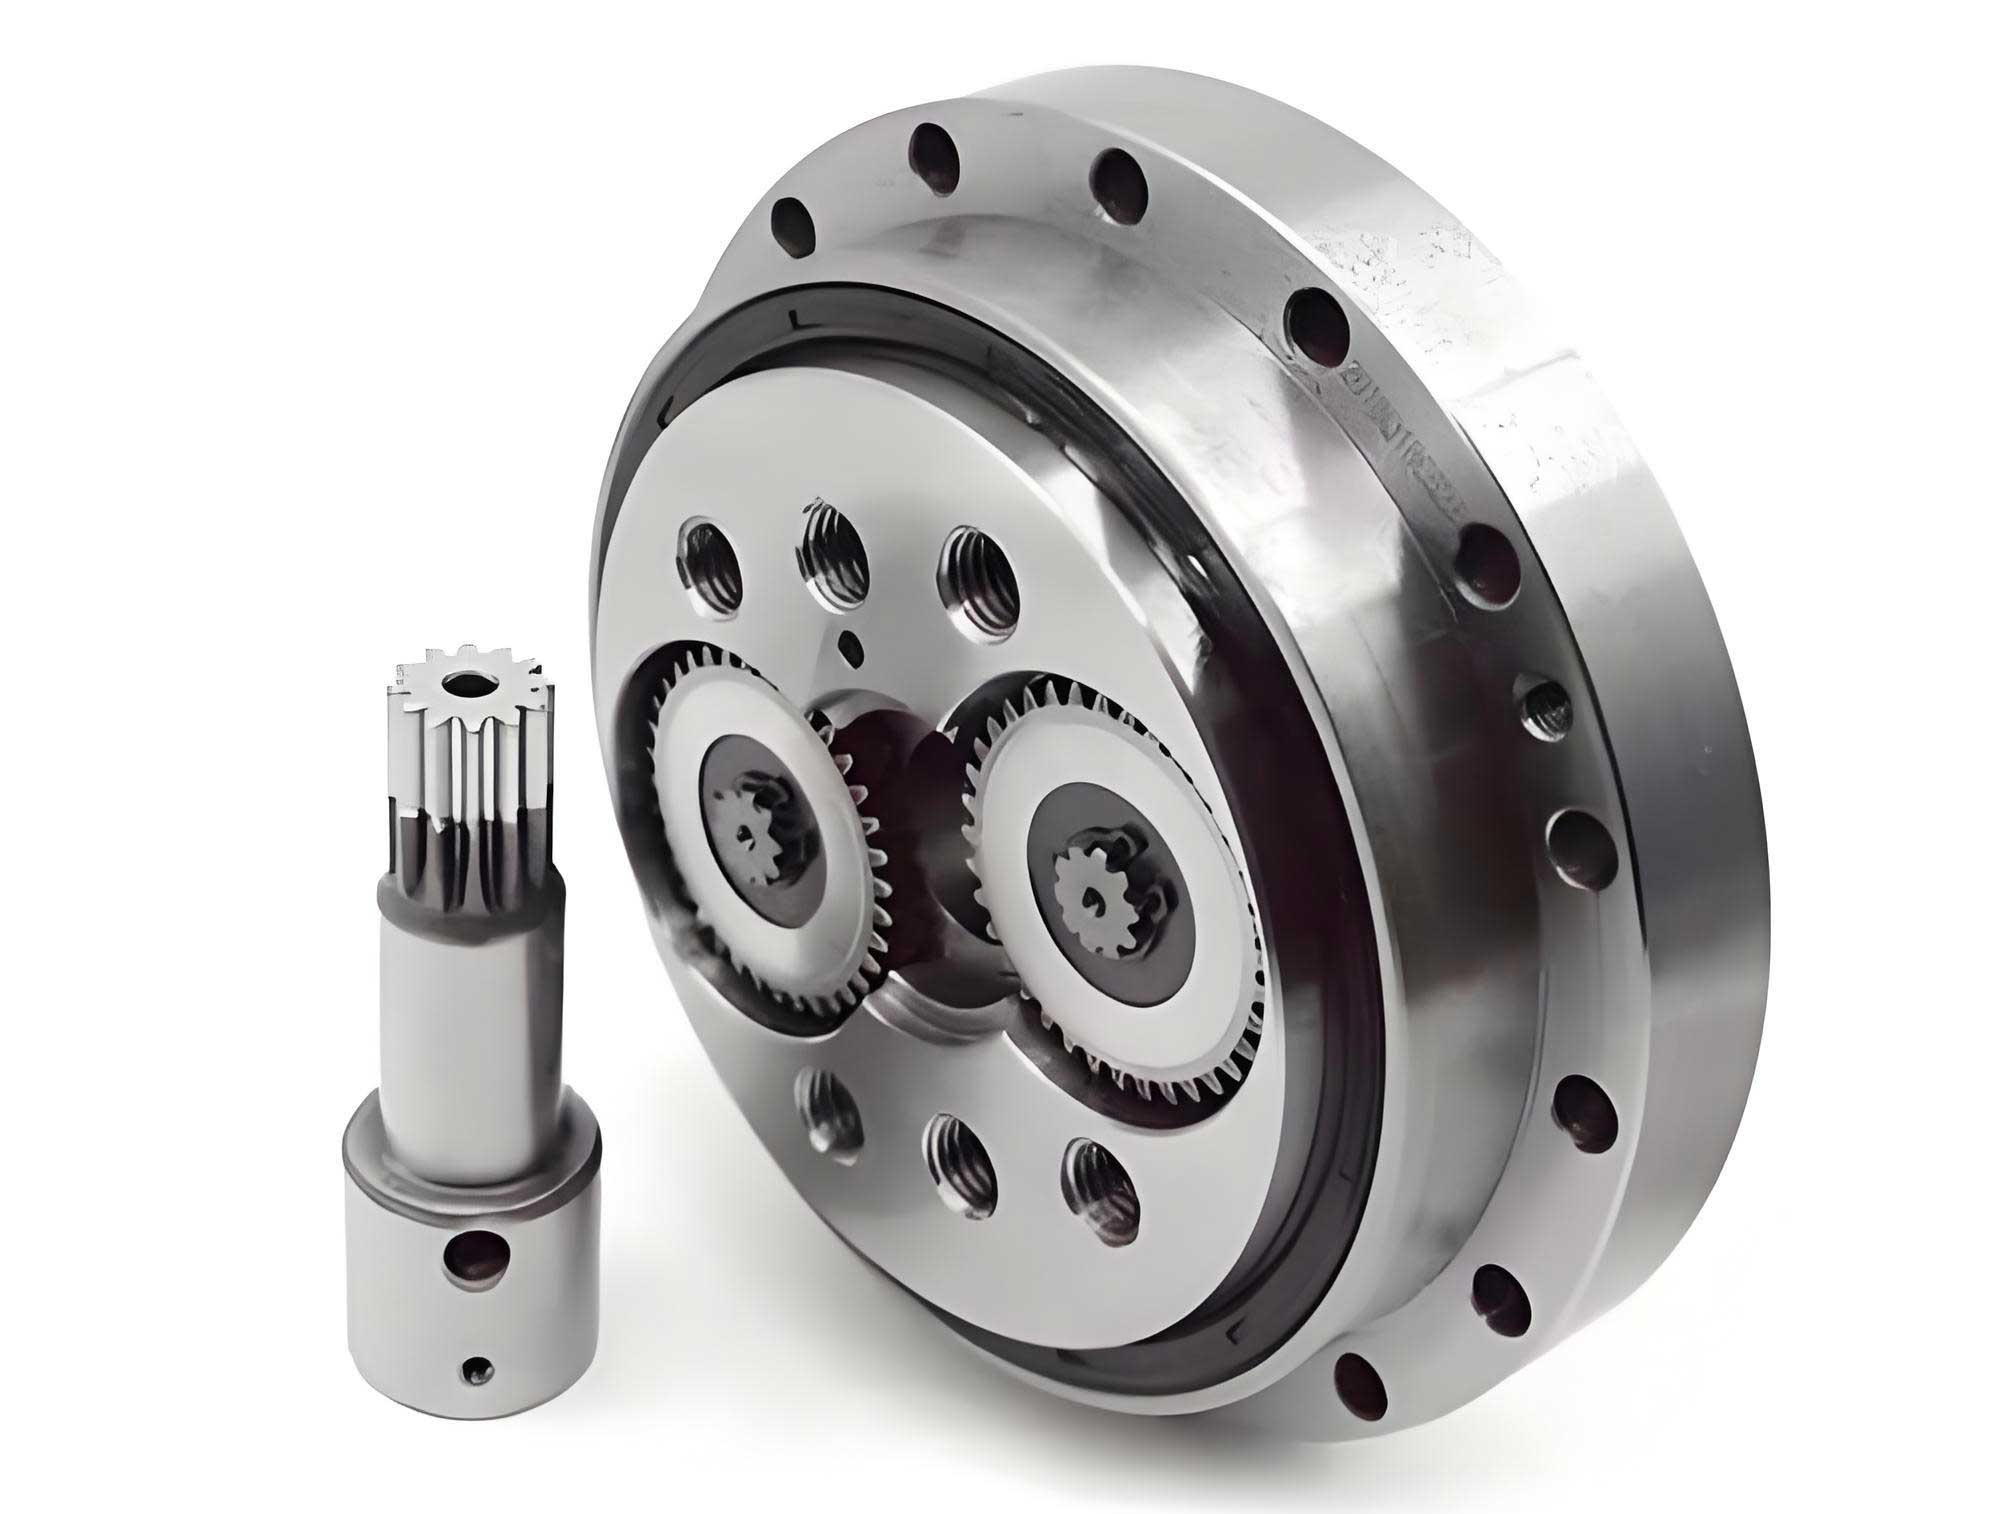
To tackle the failure rate prediction, I employ a multi-hierarchy analysis framework combined with expert assessment. The RV reducer is decomposed into subsystems and components, creating a hierarchical model that reflects its functional dependencies. The primary subsystems considered are: the planetary gear system (U1), the crankshaft and bearing system (U2), and the cycloidal gear and pin system (U3). Each subsystem is further broken down into its constituent parts. For instance, the planetary gear system includes components like the planetary gears, input gear, rolling bearings, and retaining rings. This decomposition allows for a structured analysis of failure contributions. The criteria influencing failure rates are identified as complexity, technical difficulty, operational load, and component quality. These criteria form the basis for expert evaluations, where engineers provide pairwise comparisons of the importance of each subsystem and component relative to these criteria.
The expert assessments are formalized using judgment matrices. For example, the judgment matrix for the criteria layer compares complexity, technical difficulty, operational load, and component quality. Let the judgment matrix be denoted as \( A = (a_{ij})_{n \times n} \), where \( a_{ij} \) represents the relative importance of criterion \( i \) over criterion \( j \). The values are assigned based on a standard scale, such as 1 for equal importance, 3 for moderate importance, 5 for strong importance, 7 for very strong importance, and 9 for absolute importance, with intermediate values like 2, 4, 6, and 8. The matrix must satisfy the reciprocal property: \( a_{ji} = 1 / a_{ij} \). From this matrix, the eigenvector corresponding to the largest eigenvalue is computed and normalized to obtain the weights of the criteria. Consistency is checked using the consistency ratio (CR). The consistency index (CI) is calculated as:
$$ CI = \frac{\lambda_{\text{max}} – n}{n – 1} $$
where \( \lambda_{\text{max}} \) is the largest eigenvalue and \( n \) is the matrix order. The consistency ratio is then:
$$ CR = \frac{CI}{RI} $$
where RI is the random consistency index from standard tables. A CR value less than 0.1 indicates acceptable consistency. Similarly, judgment matrices are constructed for subsystems and components, and their weights are derived through hierarchical single sorting and total sorting. The overall weight of each component in the RV reducer system is computed by combining weights across hierarchies.
To illustrate the process, consider the criteria judgment matrix based on expert input. Suppose the matrix for criteria (complexity, technical difficulty, operational load, component quality) is as follows:
| Criterion | Complexity | Technical Difficulty | Operational Load | Component Quality |
|---|---|---|---|---|
| Complexity | 1 | 1/4 | 1/2 | 1/7 |
| Technical Difficulty | 4 | 1 | 2 | 1/3 |
| Operational Load | 2 | 1/2 | 1 | 1/3 |
| Component Quality | 7 | 3 | 3 | 1 |
Using this matrix, the normalized eigenvector (weights) for the criteria is calculated as approximately \( a = (0.07, 0.247, 0.1465, 0.5364)^T \), with a CR value of 0.0186, indicating consistency. Next, judgment matrices for subsystems under each criterion are developed. For instance, under the complexity criterion, the subsystems (U1, U2, U3) might be compared to derive weights. The resulting weight matrix \( w \) for subsystems across all criteria is combined with the criteria weights to obtain the overall subsystem weights \( v \). For example, if the subsystem weights under each criterion form a matrix, the overall subsystem weights are computed as \( v = a^T \times w \). In a sample calculation, this yields \( v = (0.096, 0.4756, 0.4278)^T \) for U1, U2, and U3, respectively. Similarly, component weights within each subsystem are determined, and after consistency checks, the final weights for all components in the RV reducer system are obtained.
The failure rate prediction hinges on using reliable data from the Non-electronic Parts Reliability Data (NPRD) handbook. A key insight is to select a standard component with minimal influence from manufacturing variations as a benchmark. The retaining ring (elastic挡圈) is chosen for this purpose due to its high standardization. Its failure rate \( \lambda_{14} \) is retrieved from NPRD. The failure rates of other components are then estimated proportionally based on their relative weights. Let \( P_{ij} \) be the weight of component \( j \) in subsystem \( i \), and \( P_{14} \) be the weight of the retaining ring. The failure rate \( \lambda_{ij} \) for component \( ij \) is given by:
$$ \frac{P_{ij}}{P_{14}} = \frac{\lambda_{ij}}{\lambda_{14}} $$
Thus, \( \lambda_{ij} = \lambda_{14} \times \frac{P_{ij}}{P_{14}} \). The overall system failure rate \( \lambda_s \) for the RV reducer is the sum of the failure rates of all components, assuming a series system configuration:
$$ \lambda_s = \sum_{i=1}^{3} \sum_{j=1}^{m_i} \lambda_{ij} $$
where \( m_i \) is the number of components in subsystem \( i \). This approach allows for a detailed failure rate allocation across the RV reducer’s components.
Reliability assessment follows from the failure rates. Assuming constant failure rates for simplicity, the reliability function for each component is exponential:
$$ R_{ij}(t) = e^{-\lambda_{ij} t} $$
Since the RV reducer components are connected in series, the system reliability \( R_s(t) \) is the product of individual component reliabilities:
$$ R_s(t) = \prod_{i=1}^{3} \prod_{j=1}^{m_i} R_{ij}(t) = e^{-\lambda_s t} $$
The mean time between failures (MTBF) for the RV reducer is then:
$$ \text{MTBF} = \int_0^\infty R_s(t) \, dt = \frac{1}{\lambda_s} $$
These metrics provide a quantitative basis for evaluating the RV reducer’s performance and planning maintenance schedules.
To demonstrate the methodology, I apply it to a specific model, the RV-20E reducer. The hierarchical model includes three subsystems: U1 (planetary gear system) with components like planetary gears, input gear, rolling bearings, and retaining ring; U2 (crankshaft and bearing system) with crankshaft, needle bearings, and support bearings; and U3 (cycloidal gear and pin system) with cycloidal gears, pins, and pin housing. Expert evaluations yield the judgment matrices and weights as described earlier. After consistency checks, the component weights relative to the entire RV reducer system are computed. For instance, the weights for components in U1 might be \( P_{21} = (0.0146, 0.0247, 0.0522, 0.0049)^T \) for planetary gear, input gear, rolling bearing, and retaining ring, respectively. Similarly, weights for U2 and U3 components are derived.
Using NPRD data, the failure rate for the retaining ring is found to be \( \lambda_{14} = 1.052 \times 10^{-6} \, \text{h}^{-1} \). The failure rates for other components are calculated using the proportional formula. The results are summarized in the table below, which lists each component, its weight, and its predicted failure rate. This table highlights components with high failure rates, offering insights for design improvements.
| Component Name | Weight | Failure Rate (10^{-6} h^{-1}) |
|---|---|---|
| Planetary Gear | 0.0146 | 3.1345 |
| Input Gear | 0.0247 | 5.3029 |
| Rolling Bearing | 0.0522 | 1.1207 |
| Retaining Ring | 0.0049 | 1.0520 |
| Crankshaft | 0.0648 | 13.9120 |
| Needle Bearing | 0.2788 | 59.8570 |
| Support Bearing | 0.1318 | 28.2970 |
| Cycloidal Gear | 0.1026 | 22.0280 |
| Pin | 0.2729 | 58.5900 |
| Pin Housing | 0.0565 | 12.1300 |
| RV Reducer System | 1.0000 | 214.6900 |
From the table, the needle bearing and pin exhibit the highest failure rates, at approximately \( 59.857 \times 10^{-6} \, \text{h}^{-1} \) and \( 58.590 \times 10^{-6} \, \text{h}^{-1} \), respectively. This aligns with practical observations from manufacturers, where these components often face significant wear and tear. The overall system failure rate is \( \lambda_s = 214.69 \times 10^{-6} \, \text{h}^{-1} \), leading to an MTBF of about 4658 hours. The reliability function \( R_s(t) = e^{-214.69 \times 10^{-6} t} \) shows how system reliability decays over time. For example, at 4000 hours, the reliability drops to roughly 0.4237, and at 5000 hours, it falls to 0.3418. This decline underscores the need for proactive reliability enhancements.
The proposed method offers several advantages. First, it quantifies the qualitative knowledge of engineers regarding the RV reducer, incorporating factors like complexity and manufacturing conditions into the reliability prediction. This is particularly valuable for domestic RV reducer producers, where local data may differ from international standards. Second, the multi-hierarchy approach reduces computational complexity by breaking down the system into manageable subsystems, ensuring accuracy in weight assignments. Third, by using a standard component as a benchmark, the method minimizes errors from data discrepancies, leading to more precise failure rate estimates. The RV reducer’s reliability can thus be assessed with greater confidence, aiding in spare parts forecasting and maintenance planning.
In terms of applications, this methodology can be extended beyond the RV reducer to other complex mechanical systems in industrial robots, such as actuators or transmission units. The integration of fuzzy mathematics allows handling uncertainties in expert judgments, making it adaptable to various contexts. Moreover, the failure rate predictions serve as inputs for further reliability analyses, including fault tree analysis or Monte Carlo simulations, to explore system vulnerabilities and optimize design parameters. For instance, focusing on improving the needle bearings and pins through better materials or lubrication could significantly enhance the RV reducer’s MTBF and overall robot uptime.
However, the method has limitations. It relies heavily on expert opinions, which may introduce bias if not properly calibrated. Future work could incorporate machine learning techniques to refine the weights based on historical failure data. Additionally, the assumption of constant failure rates might not hold for all components, especially those subject to aging or wear-out failures. Incorporating time-dependent failure models, such as the Weibull distribution, could improve accuracy. Despite these, the current approach provides a robust foundation for initial reliability assessments of RV reducers.
In conclusion, the fusion of expert evaluation, multi-hierarchy analysis, and NPRD data offers a practical solution for predicting failure rates in industrial robot RV reducers. By quantifying engineering insights and focusing on critical components, it enables manufacturers to make informed decisions about design improvements and spare parts inventory. The RV reducer, as a core element in robotics, benefits from such reliability-driven approaches, ultimately contributing to the robustness and efficiency of industrial automation systems. As robotics technology advances, continuous refinement of these methods will be essential to meet the growing demands for high reliability and low downtime in manufacturing environments.
To further elaborate on the mathematical foundations, let me detail the consistency check process. For any judgment matrix \( A \), the largest eigenvalue \( \lambda_{\text{max}} \) is found by solving \( A w = \lambda w \), where \( w \) is the eigenvector. The consistency index is computed as above, and the random consistency index RI depends on the matrix order. For a 3×3 matrix, RI is 0.58; for 4×4, it is 0.90; and so on. This ensures that the expert comparisons are logically coherent. In the case of the RV reducer analysis, all matrices passed the consistency test with CR values below 0.1, validating the weight assignments.
Another aspect is the sensitivity analysis of the weights. Small changes in expert scores can alter the failure rate predictions. To address this, one can perform Monte Carlo simulations on the judgment matrices, introducing random variations within plausible ranges to see how the failure rates fluctuate. This adds robustness to the reliability assessment. For the RV reducer, such analyses might reveal that the failure rates of needle bearings and pins are particularly sensitive to weight changes, reinforcing their criticality.
The use of NPRD data is crucial, but it requires careful selection of analogous parts. The retaining ring serves as an anchor because its failure mode is less influenced by the RV reducer’s unique operational conditions. Other components, like the cycloidal gears, might have failure rates that depend heavily on lubrication and alignment, which are not fully captured in NPRD. Therefore, future iterations could integrate field data from actual RV reducer deployments to calibrate the predictions. This would enhance the method’s applicability to specific robot models and operating environments.
In terms of practical implementation, the proposed method can be embedded into reliability engineering software tools used by robot manufacturers. By automating the hierarchical analysis and weight calculations, engineers can quickly assess new RV reducer designs or variations. For example, if a new material is introduced for the pins, its estimated failure rate can be adjusted based on expert feedback on quality and load factors, allowing for rapid prototyping and testing. This accelerates the development cycle and reduces costs associated with trial-and-error approaches.
Moreover, the reliability metrics derived from this method support lifecycle management of industrial robots. Knowing the MTBF of the RV reducer helps in scheduling preventive maintenance, ordering spare parts, and estimating total cost of ownership. For robot operators, this translates to minimized downtime and improved productivity. The RV reducer’s role in precision tasks, such as assembly or welding, means that even small improvements in reliability can have significant impacts on overall system performance and product quality.
To illustrate the broader context, consider the integration of RV reducers in collaborative robots (cobots). These robots often operate in close proximity to humans, requiring exceptionally high reliability to ensure safety. The failure rate prediction method can be adapted to account for additional safety-critical factors, such as fault detection and redundancy. By incorporating these into the hierarchical model, one can assess the RV reducer’s contribution to overall cobot reliability and identify areas for enhancement, like adding sensors to monitor bearing temperature or vibration.
In summary, the reliability prediction and assessment of RV reducers is a multifaceted challenge that benefits from a structured, data-informed approach. The method I have described leverages expert knowledge and statistical data to provide actionable insights. As industrial robotics continues to evolve, with trends toward smarter and more autonomous systems, the reliability of core components like the RV reducer will remain a key focus. By advancing these predictive techniques, we can contribute to more resilient and efficient robotic solutions, driving innovation in manufacturing and beyond.
Finally, it is worth noting that the principles underlying this method are not limited to RV reducers alone. They can be applied to other mechanical systems in robotics, such as harmonic drives or linear actuators, as well as to non-robotic applications like automotive transmissions or aerospace gearboxes. The fusion of fuzzy mathematics and hierarchical analysis offers a versatile framework for reliability engineering across diverse domains. As data availability improves with the Internet of Things (IoT) and digital twins, these methods can be further refined with real-time monitoring data, leading to dynamic reliability predictions that adapt to usage patterns and environmental conditions. This represents an exciting direction for future research, where the RV reducer serves as a testbed for broader reliability science advancements.