
The pursuit of high precision in modern robotics, particularly in industrial robot joints, places stringent requirements on transmission components. Among these, the RV reducer stands out as one of the two most prevalent types (the other being the harmonic drive) due to its exceptional combination of high reduction ratio, substantial torsional stiffness, compact structure, and smooth operation. A critical performance metric for any precision reducer is its backlash—the lost motion or angular lag experienced at the output shaft when the input rotation is reversed. For RV reducers deployed in robotic joints, permissible backlash is typically constrained to within 1 arc-minute (1′). Exceeding this limit can degrade positioning accuracy, reduce system stiffness, and induce vibration, ultimately compromising the robot’s performance. Therefore, precise control and prediction of backlash during the design phase are paramount. This control is exercised through the allocation of manufacturing tolerances to individual components. This article establishes a comprehensive probabilistic model for calculating the total backlash of an RV reducer, performs a sensitivity analysis to identify the most influential error sources, and demonstrates a practical methodology for efficient tolerance design.
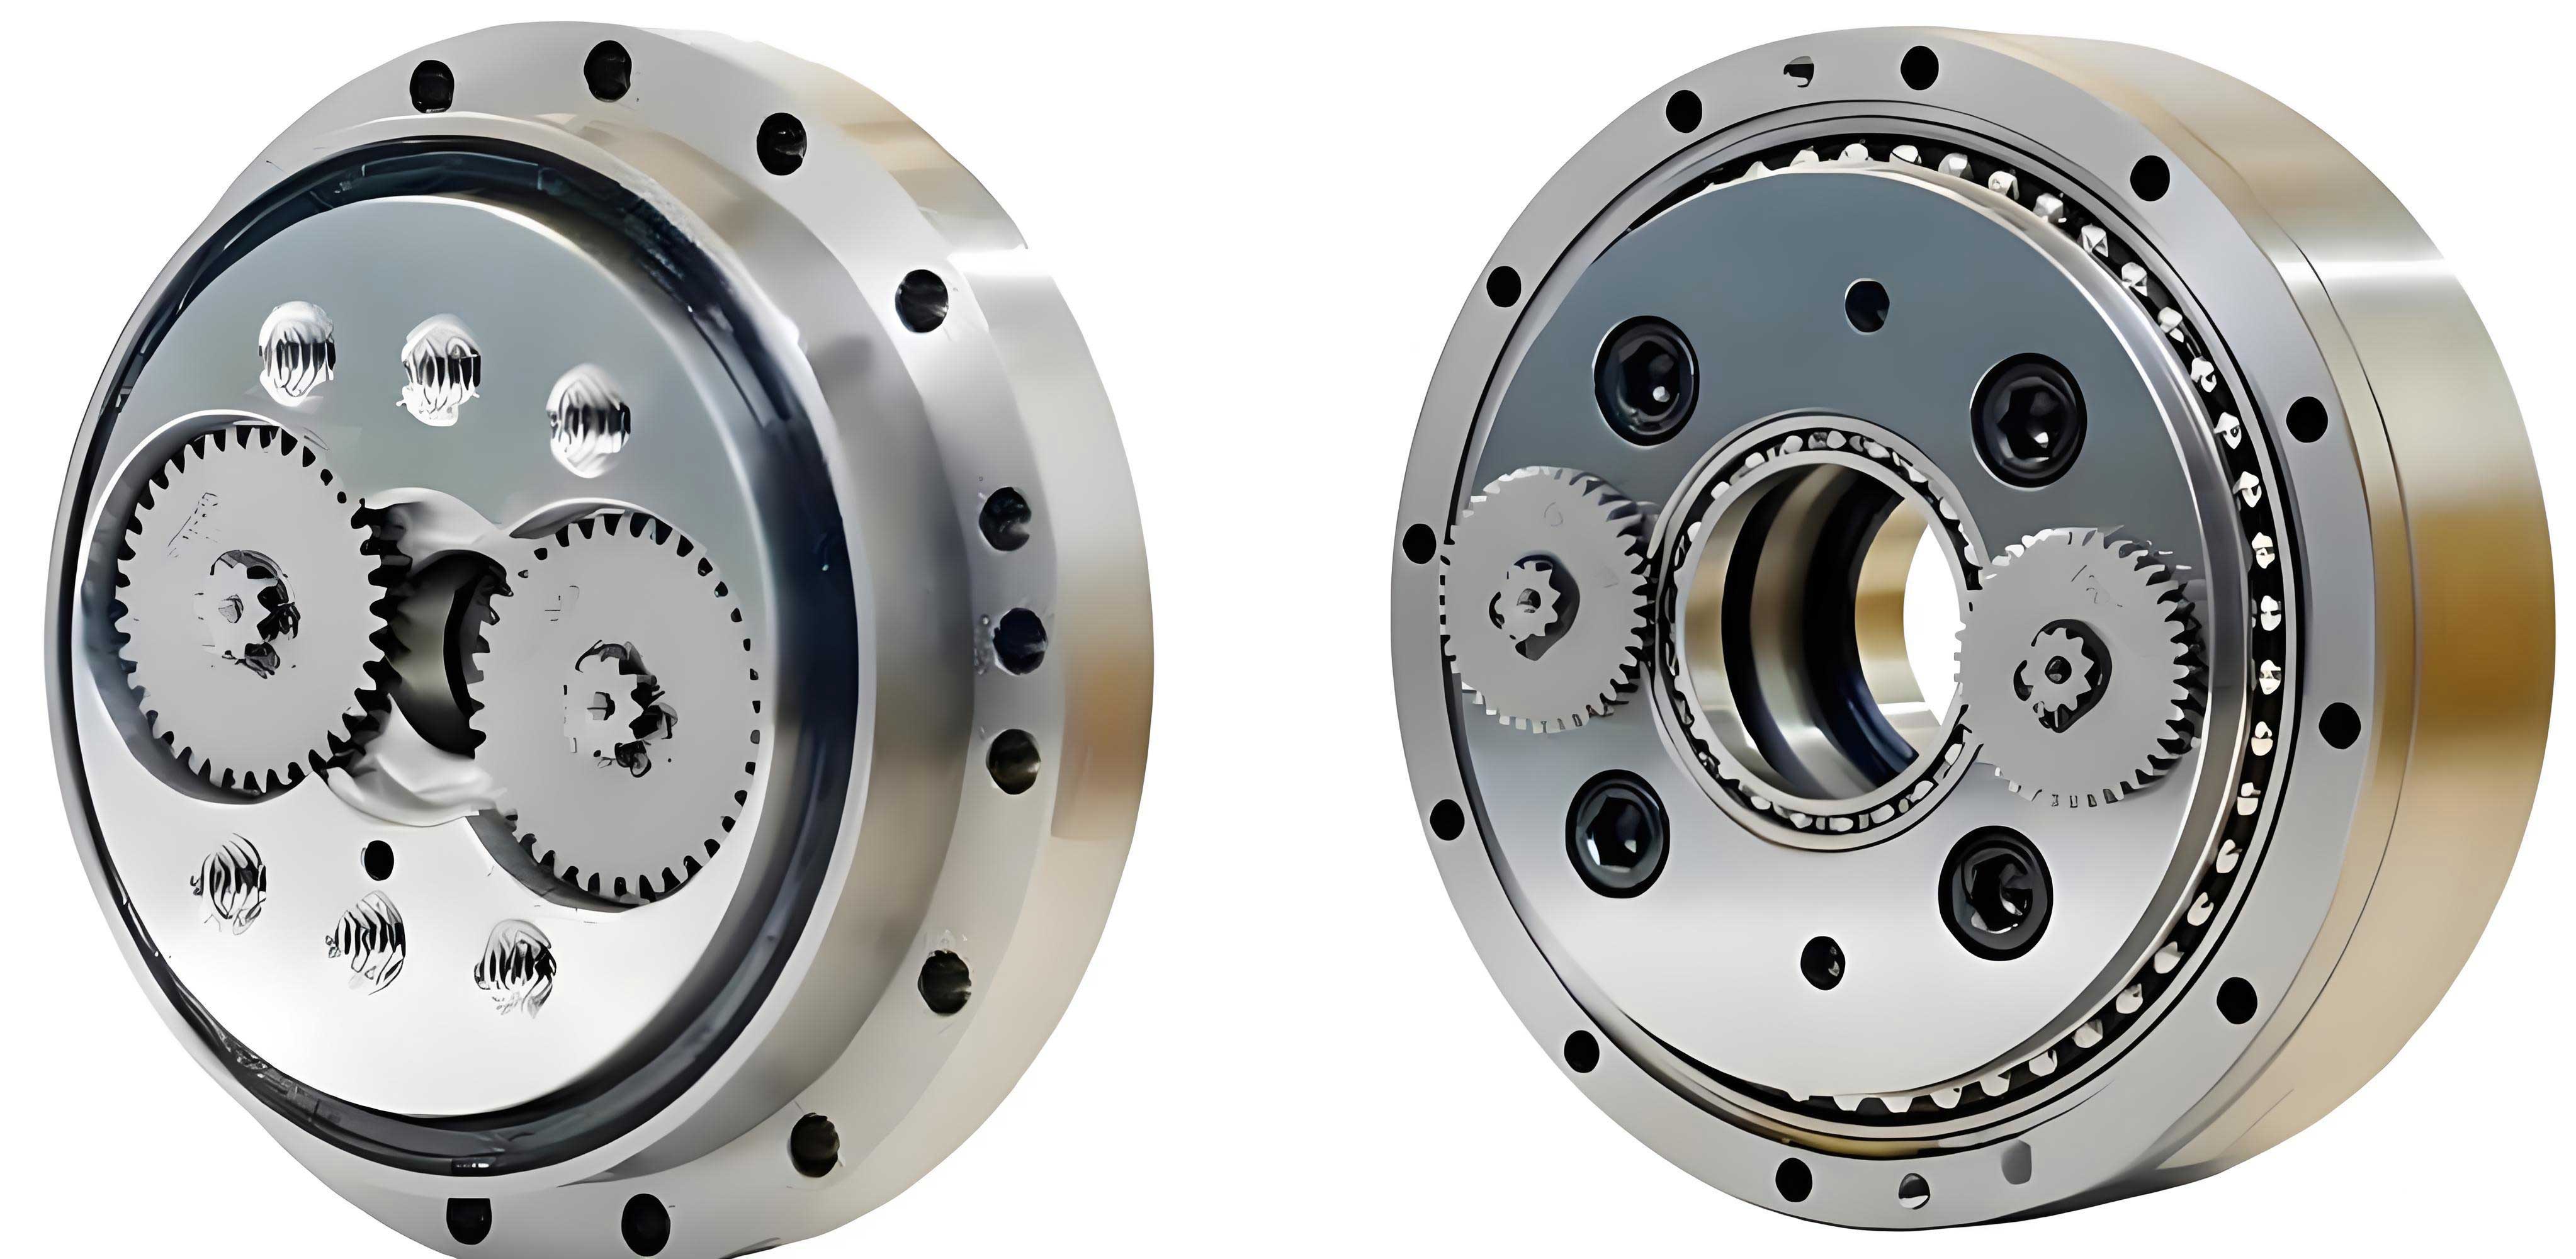
The RV reducer is a compound planetary system that ingeniously combines a first-stage involute gear train with a second-stage cycloidal-pin gear train in a closed differential configuration. This structure is key to its performance. The total output backlash of the RV reducer is the superposition of contributions from both stages. However, their impacts are not equal. The backlash originating from the cycloidal stage is directly reflected at the output with a 1:1 relationship, making it the dominant contributor. In contrast, the backlash from the involute stage is attenuated by the large reduction ratio of the RV reducer before it appears at the output, thus its influence is significantly smaller. A rigorous backlash analysis must therefore decompose the problem, model each error source within its respective stage, and then synthesize the results.
1. Mathematical Modeling of RV Reducer Backlash Components
1.1 Backlash from the Involute Gear Stage
The involute stage typically consists of a central sun gear, multiple planetary gears, and a fixed ring gear (or housing). The primary error factors contributing to gear mesh backlash in this stage and their effect on the output shaft of the RV reducer are modeled below. The models convert linear dimensional errors or kinematic errors into an equivalent output angular backlash (BI), measured in arc-minutes.
1.1.1 Base Pitch Error (via Mean Base Tangent Length Deviation, ΔEW): This deviation, typically negative, effectively reduces tooth thickness, creating inherent clearance.
$$ B_{tEw} = -\frac{180 \times 60}{\pi \times r_1 \times i} \times \frac{\Delta E_W}{\cos \alpha} $$
Where \( r_1 \) is the pitch radius of the sun gear, \( i \) is the total reduction ratio of the RV reducer, and \( \alpha \) is the pressure angle.
1.1.2 Center Distance Error (Δfa): Deviation from the nominal center distance between sun and planet gears alters the meshing geometry.
$$ B_{tFa} = -\frac{180 \times 60}{\pi \times r_1 \times i} \times 2 \Delta f_a K_a \tan \alpha $$
Where \( K_a = \frac{\sin \alpha’}{\sin \alpha} \) and \( \alpha’ \) is the operating pressure angle.
1.1.3 Radial Runout of Gear (ΔFr): Eccentricity of the gear causes periodic variation in the center distance.
$$ B_{tFr} = \frac{180 \times 60}{\pi \times r_1 \times i} \times \Delta F_r K_a \tan \alpha $$
1.1.4 Parallelism Error of Gear Axes (Δfx, Δfy): Misalignment in the axis of rotation for mating gears.
$$ B_{tf\Sigma} = \frac{180 \times 60}{\pi \times r_1 \times i} \times \sqrt{(\Delta f_x)^2 + (\Delta f_y)^2} \tan \alpha $$
1.1.5 Gear Radial Composite Error (Includes Profile and Pitch Errors):
$$ B_{tFi} = \frac{180 \times 60}{\pi \times r_1 \times i} \times \Delta F_i” K_a \tan \alpha $$
1.1.6 Bearing Radial Clearance (S): Internal clearance in the support bearings for the planet gears allows displacement.
$$ B_{tS} = \frac{180 \times 60}{\pi \times r_1 \times i} \times S K_a \tan \alpha $$
1.1.7 Clearance in Key/Spline Connections (ΔCk): If a key or spline connects the gear to its shaft, its clearance contributes.
$$ B_{tCk} = \frac{180 \times 60}{\pi \times r_1 \times i} \times \Delta C_k $$
The total backlash contribution from the involute stage, \( B_I \), is the algebraic sum of all these individual components: \( B_I = B_{tEw} + B_{tFa} + B_{tFr} + B_{tf\Sigma} + B_{tFi} + B_{tS} + B_{tCk} + \ldots \)
1.2 Backlash from the Cycloidal-Pin Gear Stage
The cycloidal stage is the heart of the RV reducer. To ensure proper lubrication, compensate for manufacturing errors, and achieve optimal load distribution, the theoretical cycloidal tooth profile is always modified. These modifications, along with manufacturing and assembly tolerances, are the primary sources of backlash in this critical stage.
1.2.1 Profile Modification-Induced Backlash: Three common modifications are used: offset (Δrp), equidistant (Δrrp), and rotational (δ). They create a guaranteed clearance between the cycloid disc and the pin.
$$ B_1 = \frac{180 \times 60 \times 2}{\pi} \times \left( \frac{\Delta r_{rp}}{a z_c} – \frac{\Delta r_p \sqrt{1 – K_1^2}}{a z_c} + \frac{\delta}{2} \right) $$
Where \( r_p \) is the pin circle radius, \( a \) is the eccentricity, \( z_c \) is the number of cycloid disc lobes, and \( K_1 = \frac{z_c}{z_p} \) (with \( z_p \) being the number of pins). In practice, a combination of offset and equidistant modification is typical.
1.2.2 Pin Circle Radius Error (δrp): Manufacturing tolerance on the radius of the pin circle.
$$ B_2 = \frac{180 \times 60}{\pi} \times \frac{2 \delta r_p \sqrt{1 – K_1^2}}{a z_c} $$
1.2.3 Pin Radius Error (δrrp): Tolerance on the radius of the individual pins.
$$ B_3 = -\frac{180 \times 60}{\pi} \times \frac{2 \delta r_{rp}}{a z_c} $$
1.2.4 Pin-to-Hole Clearance (δj): The necessary clearance between the pin and its housing bore in the pin wheel.
$$ B_4 = \frac{180 \times 60}{\pi} \times \frac{\delta j}{a} $$
1.2.5 Cycloid Disc Cumulative Pitch Error (ΔFp):
$$ B_5 = -\frac{180 \times 60}{\pi} \times \frac{K_1 \Delta F_p}{a z_c} $$
1.2.6 Pin Hole Positional Error (δtΣ): Error in the angular location of pin holes on the pin circle.
$$ B_6 = \frac{180 \times 60}{\pi} \times \frac{\delta t_{\Sigma}}{a} $$
1.2.7 Cycloid Disc Radial Runout (ΔFr1):
$$ B_7 = \frac{180 \times 60}{\pi} \times \frac{\Delta F_{r1} \sqrt{1 – K_1^2}}{a z_c} $$
1.2.8 Eccentric Bearing (Crankshaft Bearing) Clearance (Δu): The radial play in the bearings that support the cycloid discs on the eccentric crankshaft. This is a major contributor as the motion must take up this clearance before being transmitted.
$$ B_u = \frac{180 \times 60}{\pi} \times \frac{\Delta u}{a} $$
The total backlash contribution from the cycloidal stage, \( B_{II} \), is the sum of all component backlashes: \( B_{II} = \sum_{i=1}^{7} B_i + B_u \).
1.3 Probabilistic Synthesis of Total RV Reducer Backlash
The overall output backlash of the RV reducer is the sum of the contributions from both stages: \( B = B_I + B_{II} \). In a worst-case (extreme value) analysis, one would simply add the maximum possible values of each component. This approach, however, is overly conservative and leads to unnecessarily tight and costly tolerances, as it is statistically improbable that all errors will simultaneously be at their extreme limits in the same direction.
A more realistic and economical approach is a probabilistic (statistical) tolerance analysis. It is generally accepted that machining errors tend to follow a Normal (Gaussian) distribution, while errors due to eccentricity or runout often follow a Rayleigh distribution. The total backlash is separated into constant (systematic) and variable (random, e.g., from eccentricity) components for calculation.
For constant errors (normally distributed), the mean \( \mu_{B_c} \) and standard deviation \( \sigma_{B_c} \) of their combined effect are:
$$ \mu_{B_c} = \sum \mu_i $$
$$ \sigma_{B_c} = \sqrt{\sum \sigma_i^2} $$
For variable errors from eccentricities (Rayleigh distributed), the mean \( \mu_{FT} \) and standard deviation \( \sigma_{FT} \) for a single source are:
$$ \mu_{FT} = \frac{1}{2}\sqrt{\pi} \sqrt{\sum \mu_i^2 + \sum \sigma_i^2} $$
$$ \sigma_{FT} = \sqrt{1 – \pi/4} \sqrt{\sum \mu_i^2 + \sum \sigma_i^2} $$
The total variable backlash parameters \( \mu_{B_v} \) and \( \sigma_{B_v} \) are found by summing the individual variable components:
$$ \mu_{B_v} = \sum \mu_{FT} $$
$$ \sigma_{B_v} = \sqrt{\sum \sigma_{FT}^2} $$
Finally, the parameters of the total output backlash distribution are:
$$ \mu_B = \mu_{B_c} + \mu_{B_v} $$
$$ \sigma_B = \sqrt{ \sigma_{B_c}^2 + \sigma_{B_v}^2 } $$
The probable maximum backlash for tolerance design, often corresponding to a 99.73% confidence level (±3σ), is:
$$ B_{\Sigma} = \mu_B + 3\sigma_B $$
This \( B_{\Sigma} \) must be less than the specified allowable backlash (e.g., 1 arc-minute) for the RV reducer design to be viable.
2. Sensitivity Analysis of Error Factors in RV Reducer Backlash
2.1 Principle of Sensitivity Analysis
Given a functional relationship \( Y = f(x_1, x_2, …, x_n) \), the sensitivity of \( Y \) to a small variation \( \Delta x_i \) in parameter \( x_i \) is given by its partial derivative \( \frac{\partial Y}{\partial x_i} \). To compare the relative influence of different parameters, a Sensitivity Index \( S_i \) is defined relative to a chosen reference parameter \( x_0 \):
$$ S_i = \frac{ \partial Y / \partial x_i }{ \partial Y / \partial x_0 } $$
Thus, the reference parameter has an index of 1. An index > 1 indicates a factor more influential than the reference; an index < 1 indicates a less influential factor. This analysis is crucial for identifying the “vital few” tolerances that must be controlled most strictly in the manufacturing of the RV reducer.
2.2 Sensitivity Analysis Applied to an RV Reducer
Using the backlash models established in Section 1, the sensitivity index for each major error factor can be calculated. For this analysis, the error in the pin circle radius (\( \delta r_p \)) is chosen as the reference (\( S_{ref} = 1 \)). The following table presents the sensitivity indices for a hypothetical but representative RV reducer model with parameters similar to an RV-20E-81 type.
| Error Factor | Symbol | Sensitivity Index (Si) | Relative Influence |
|---|---|---|---|
| Rotational Profile Modification | δ | ~30.5 | Extremely High |
| Eccentric Bearing Clearance | Δu | ~1.13 | High |
| Equidistant Modification | Δrrp | ~1.57 | High |
| Pin Radius Error | δrrp | ~-1.57 | High |
| Pin Circle Radius Error (Reference) | δrp | 1.00 | High |
| Offset Modification | Δrp | ~-1.00 | High |
| Pin-to-Hole Clearance | δj | ~0.78 | Moderate |
| Pin Hole Positional Error | δtΣ | ~1.21 | Moderate/High |
| Cycloid Disc Cumulative Pitch Error | ΔFp | ~-0.60 | Moderate |
| Cycloid Disc Radial Runout | ΔFr1 | ~0.39 | Moderate |
| Gear Axes Parallelism Error | Δfx, Δfy | ~ -0.11 to -0.31 | Low |
| Gear Base Tangent Length Error | ΔEW | ~ -0.04 | Very Low |
| Planet Gear Bearing Radial Clearance | S | ~ 0.04 | Very Low |
The analysis yields critical insights for the design and manufacturing of the RV reducer. Rotational modification (δ) has an overwhelmingly high sensitivity index, confirming that it is the primary and most direct control parameter for setting the nominal working clearance in the cycloid stage. Factors related to the cycloid stage (bearing clearance Δu, pin tolerances, modification amounts) consistently show high sensitivity indices (absolute value > 0.7). Conversely, errors from the involute gear stage (gear errors, axis parallelism) exhibit very low sensitivity indices due to the dividing effect of the large reduction ratio. This clearly directs the designer to focus tolerance control efforts and quality assurance measures on the cycloid stage components—specifically the eccentric bearing clearance, pin dimensions and locations, and the precision of the profile modifications on the cycloid disc.
3. Practical Application: Backlash Calculation and Tolerance Design Workflow
The mathematical models and sensitivity analysis form the foundation of a systematic tolerance design workflow. This process can be efficiently implemented using computational tools. For instance, the models can be programmed in software like MATLAB, creating a dedicated RV reducer backlash analysis tool with a graphical interface. The workflow is as follows:
- Define RV Reducer Parameters: Input fundamental geometric and kinematic parameters (e.g., \( z_c, z_p, r_p, a, i \)).
- Specify Nominal Modifications: Set the intended values for offset (Δrp) and equidistant (Δrrp) modifications.
- Assign Initial Tolerances: Based on manufacturing capability, assign tentative tolerance values to all error factors (δrp, Δu, ΔFp, etc.).
- Perform Probabilistic Backlash Calculation: The software computes the mean \( \mu_B \) and standard deviation \( \sigma_B \), and outputs the probable maximum backlash \( B_{\Sigma} \).
- Compare and Iterate: If \( B_{\Sigma} \) exceeds the allowable limit (e.g., 1′), the designer must tighten tolerances. Here, the sensitivity table is invaluable. Instead of tightening all tolerances—which increases cost—the designer should first tighten the tolerances with the highest sensitivity indices (e.g., Δu, δrp, δrrp).
- Optimize: Iterate steps 3-5, adjusting the high-sensitivity tolerances, until \( B_{\Sigma} \) meets the specification. Low-sensitivity tolerances can potentially be relaxed to reduce cost without significantly affecting the final backlash.
To illustrate, consider a design case with the following key parameters for the cycloid stage of an RV reducer:
| Parameter | Symbol | Value |
|---|---|---|
| Number of Cycloid Lobes | \( z_c \) | 39 |
| Number of Pins | \( z_p \) | 40 |
| Pin Circle Radius | \( r_p \) | 52.0 mm |
| Eccentricity | \( a \) | 1.0 mm |
| Offset Modification | \( \Delta r_p \) | -0.008 mm |
| Equidistant Modification | \( \Delta r_{rp} \) | -0.005 mm |
Assigning a set of manufacturing tolerances (e.g., \( \delta r_p = \pm 2.5 \mu m, \Delta u = 2 \) to \( 13 \mu m, \Delta F_p = 6 \mu m \), etc.) and running the probabilistic calculation might yield an initial result of \( B_{\Sigma} = 73.1 \) arc-seconds (≈1.22 arc-minutes), which is above the 1′ target. Guided by sensitivity analysis, tightening the eccentric bearing clearance tolerance (Δu) from (2-13μm) to (2-8μm) and the pin circle radius error (δrp) from ±2.5μm to ±2.0μm, while keeping other tolerances constant, could reduce \( B_{\Sigma} \) to approximately 55 arc-seconds (0.92′), meeting the requirement. This demonstrates the efficiency of a sensitivity-informed approach.
4. Conclusion
The precise control of backlash is fundamental to the performance of high-precision RV reducers. This article has presented a comprehensive methodology for analyzing and designing for backlash. By decomposing the RV reducer into its involute and cycloidal stages, detailed mathematical models were established to quantify the contribution of each manufacturing error and assembly clearance to the total output backlash. The adoption of a probabilistic (statistical) tolerance synthesis method provides a more realistic and cost-effective prediction compared to a worst-case analysis, preventing the over-specification of tolerances.
The core of the design strategy lies in the sensitivity analysis. For a typical RV reducer, error factors associated with the cycloidal-pin gear stage—most notably the rotational profile modification, eccentric bearing clearance, and pin-related dimensions—exhibit high sensitivity and therefore dominate the total backlash. In contrast, errors from the involute gear stage have a markedly lower impact due to the speed reduction effect. This insight allows engineers to focus their design, quality control, and cost resources on the most critical areas.
Implementing the presented models and sensitivity principles into a computational software tool creates a powerful environment for rapid design iteration. Engineers can quickly evaluate the backlash implications of different tolerance schemes, optimize the allocation of tolerances based on sensitivity, and converge on a design that reliably meets the stringent backlash specification while being mindful of manufacturing feasibility and cost. This systematic approach significantly enhances the efficiency and effectiveness of the RV reducer design process, ensuring the high performance required by advanced robotic and precision motion systems.