
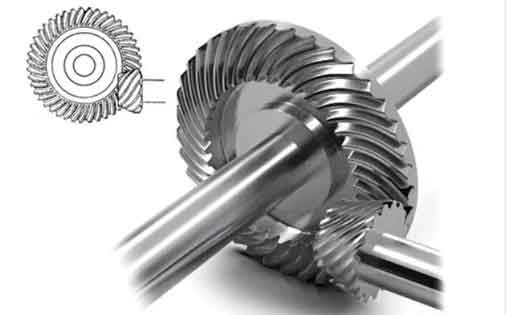
The operational performance and longevity of modern high-performance power transmission systems, particularly in aerospace and heavy-duty industrial applications, are critically dependent on the surface integrity of their core components. Among these, spiral bevel gears play a pivotal role due to their ability to transmit power efficiently between non-parallel, intersecting shafts. However, the complex contact kinematics and high loads inherent to their operation make them susceptible to surface-initiated fatigue failures such as pitting, micro-pitting, and wear. To combat these failure modes, surface enhancement techniques are indispensable.
Shot peening is a widely adopted cold-working process for enhancing the fatigue life of metallic components, including spiral bevel gears. The process involves bombarding the component’s surface with a stream of small, spherical media (shots) at high velocity. Each impact induces localized plastic deformation, resulting in two primary, yet sometimes competing, outcomes: the introduction of a beneficial residual compressive stress layer in the subsurface material and the alteration of the surface’s microscopic topography. While the compressive stresses inhibit crack initiation and propagation, the induced surface roughening can have detrimental effects. An excessively rough surface on spiral bevel gears can increase friction, promote abrasive wear, accelerate micropitting, and potentially act as a stress concentrator itself, negating some benefits of the compressive stress field. Therefore, achieving an optimal balance—maximizing compressive stress penetration while minimizing detrimental roughening—is a key challenge in process design.
Traditionally, establishing optimal peening parameters for complex geometries like spiral bevel gears has relied heavily on empirical, trial-and-error approaches. This method is not only time-consuming and costly but also provides limited insight into the fundamental interactions between process parameters and the resulting surface state. Numerical simulation offers a powerful alternative. However, simulating shot peening for spiral bevel gears presents unique difficulties not encountered with flat or simple cylindrical surfaces. The complex, doubly-curved tooth flank geometry and the narrow inter-tooth spaces significantly influence the shot stream. Shots can ricochet off one tooth flank and strike another, or collide with each other in the confined gear space, altering their impact velocity, angle, and frequency on the target surface. Simplified models that treat shots as independent particles impacting a flat plane fail to capture these critical dynamics, leading to inaccurate predictions of coverage (the percentage of surface impacted) and impact energy distribution.
To address this gap, we have developed and validated an advanced, multi-stage simulation framework that accurately predicts the post-peening surface topography of spiral bevel gears. This study details our methodology, which sequentially couples Discrete Element Method (DEM) and Finite Element Method (FEM) analyses. We then employ this validated model to systematically investigate the influence of key process parameters—peening time (and thus coverage), shot velocity, and shot diameter—on the resulting three-dimensional surface roughness of the gear tooth flanks.
Fundamentals of Shot Peening and Surface Topography Evolution
The transformation of a surface under shot peening is a stochastic process resulting from the cumulative effect of numerous individual impacts. Each shot acts as a tiny, high-energy hammer. Upon collision, the kinetic energy of the shot is partially transferred to the target material. If the induced stress exceeds the dynamic yield strength of the material, a permanent plastic indentation, or crater, is formed. The material at the crater’s periphery is displaced upward, forming a lip or pile-up. The fundamental mechanical interaction for a single normal impact can be described by basic principles. The kinetic energy (KE) of a shot just before impact is given by:
$$KE = \frac{1}{2} m v^2$$
where \(m\) is the mass of the shot and \(v\) is its velocity normal to the surface. The momentum transferred is \(p = m v\). The diameter \(d\) of the shot directly influences its mass (\(m \propto d^3\)) and contact area.
The plastic strain \(\varepsilon_p\) induced in the target material governs the depth and lateral spread of the deformation. A simplified relation for the indentation depth \(h\) can be derived from energy considerations and material properties:
$$\frac{1}{2} m v^2 \approx \sigma_y \cdot V_{plast}$$
where \(\sigma_y\) is the dynamic yield stress of the target material and \(V_{plast}\) is the plastically deformed volume, which is related to \(h\) and the crater geometry. The final surface topography is the superposition of countless such randomly located craters and pile-ups.
Quantifying this topography requires moving beyond two-dimensional profile roughness parameters (like Ra, Rz). For the complex, non-uniform surfaces of peened spiral bevel gears, three-dimensional areal roughness parameters are essential. The primary parameter used in this study is the arithmetical mean height, \(S_a\), defined as:
$$S_a = \frac{1}{A} \iint_A |z(x,y)| \,dx\,dy$$
where \(A\) is the defined evaluation area and \(z(x,y)\) is the height at point (x,y) relative to the mean plane. \(S_a\) provides a robust measure of the overall vertical deviation of the surface. Other relevant parameters include the root mean square height \(S_q\), skewness \(S_{sk}\) (describing asymmetry of the height distribution), and kurtosis \(S_{ku}\) (describing the “peakedness” of the distribution). The evolution of these parameters with increasing coverage \(C\) (the total impacted area as a fraction of the original surface area) is non-linear. Initially, as the first shots strike a pristine surface, \(S_a\) increases rapidly. As coverage increases, new impacts overlap previous craters, work-hardening the surface, and further plastic flow can partially fill in valleys, leading to a saturation or even a decrease in \(S_a\) at very high coverages (overpeening).
Methodology: Integrated DEM-FEM Simulation Framework
Our simulation approach is designed to capture the physical chain of events: the flight and interactions of shots within the gear geometry, followed by the elastoplastic deformation of the gear surface upon impact. This is achieved through a sequential coupling of DEM and FEM analyses, as outlined below.
Discrete Element Method (DEM) Analysis for Shot Dynamics
The DEM simulation models the shot stream from the nozzle exit to the point of impact on the gear tooth flanks. We use a commercial DEM software to simulate this process. The geometry includes a precise CAD model of the spiral bevel gear and the nozzle, positioned as in the physical experiment (e.g., 180 mm distance, normal to the root line). The gear rotates on its axis at a specified speed (e.g., 10 rpm), while the nozzle traverses along the face width direction.
The initial shot velocity \(v_0\) is calculated using an empirical formula that accounts for nozzle air pressure \(P\), shot mass flow rate \(q_m\), and shot diameter \(d\):
$$v_0 = \frac{16.35P}{1.53q_m + P} + \frac{29.5P}{0.598d + P} + 4.83P$$
where \(P\) is in bar, \(q_m\) in kg/min, and \(d\) in mm. The DEM model tracks every shot, accounting for collisions with the gear surfaces, collisions between shots, and gravity. From this simulation, we extract critical impact data for a specified target region on the tooth flank (e.g., near the pitch cone). For each recorded impact, we extract:
- Impact location (in machine coordinates).
- Impact velocity vector (in machine coordinates).
- Time of impact.
This raw data requires coordinate transformation. The impact location and velocity must be converted from the fixed machine coordinate system (\(S_m\)) to the rotating gear coordinate system (\(S_g\)), and finally to a local coordinate system (\(S_f\)) defined by the surface normal and tangent vectors at the point of impact. This yields the crucial local impact velocity, particularly its normal component \(v_n\), which is primarily responsible for plastic deformation. Impacts with very low \(v_n\) are filtered out as they contribute negligibly to permanent surface alteration.
The final output of the DEM stage is a statistically representative set of impact conditions (location, normal velocity, incident angle) for the target area on the spiral bevel gear tooth flank, corresponding to a specific physical peening time.
Finite Element Method (FEM) Analysis for Surface Deformation
The impact data from DEM serves as the direct input for a statistically representative FEM model built in Abaqus/Explicit. The model focuses on a small, representative patch of the gear surface (e.g., 1 mm x 1 mm). To accurately model the semi-infinite body and prevent stress wave reflections, the patch is surrounded by infinite elements (CIN3D8). The mesh in the central impact zone is refined to a resolution of about 10 μm to resolve individual crater morphologies.
The material model for the gear substrate (e.g., AISI 9310 steel) must capture high strain-rate plasticity. We employ the Johnson-Cook constitutive model:
$$\sigma = \left( A + B {\varepsilon_p}^n \right) \left( 1 + C \ln \frac{\dot{\varepsilon_p}}{\dot{\varepsilon_0}} \right) \left( 1 – T^{*m} \right)$$
$$T^* = \frac{T – T_{room}}{T_{melt} – T_{room}}$$
where \(\sigma\) is the flow stress, \(\varepsilon_p\) the equivalent plastic strain, \(\dot{\varepsilon_p}\) the plastic strain rate, and \(A, B, C, n, m\) are material constants. The shots are modeled as deformable bodies with a simpler elastic-plastic material definition.
To simulate the stochastic nature of peening, the impact locations within the central analysis zone are randomized using a Python script, while obeying the spatial distribution implied by the DEM data. Each impact simulation is run dynamically, modeling the shot’s rebound. The sequence of hundreds of impacts is simulated to build up the coverage. Crucially, the initial FEM surface is not perfectly flat; it is seeded with a measured or synthetically generated 3D roughness profile representative of the gear’s pre-peened grinding finish. This is implemented using a Python script to modify the nodal coordinates of the surface layer based on a surface height map. After all impacts are simulated, the final deformed surface mesh is extracted. The nodal coordinates of this surface are then processed to calculate the three-dimensional areal roughness parameters, such as \(S_a\), \(S_q\), \(S_{sk}\), and \(S_{ku}\).
Model Validation and Parametric Study Results
We first validated our coupled DEM-FEM framework against physical experiments on spiral bevel gears made of AISI 9310 steel, peened with S110 cast steel shot. The predicted 3D surface topography and the \(S_a\) values were compared to measurements taken via white light interferometry at several locations on the tooth flank.
The validation showed strong qualitative agreement between the simulated and measured surface morphologies, both exhibiting the characteristic cratered, stochastic texture of a peened surface. Quantitatively, the discrepancy in \(S_a\) values was within 20% across all measured zones, confirming the predictive accuracy of our model. This error margin is acceptable given the inherent stochasticity of the process and the complexity of the gear geometry.
Influence of Peening Time and Coverage
Using the validated model, we investigated the effect of peening time, which directly controls coverage. For a fixed shot velocity (40 m/s) and diameter (0.3 mm), we simulated increasing peening durations. The coverage \(C\) was calculated using the common area fraction method from multiple impact simulations.
The relationship between coverage, peening time, and surface roughness \(S_a\) is summarized below and shows a clear trend. Full coverage (98%) was achieved at approximately 50 seconds under these specific parameters.
| Peening Time (s) | Coverage, C (%) | Surface Roughness, S_a (μm) |
|---|---|---|
| 0 (Initial) | 0 | 0.40 |
| 25 | ~70 | 0.85 |
| 50 | ~98 (Full) | 1.01 |
| 75 | ~150 | 0.99 |
| 100 | ~200 | 0.97 |
The results clearly illustrate the non-linear evolution of roughness. \(S_a\) increases sharply as the first impacts create craters on the initially smooth surface. It reaches a maximum around full coverage. Beyond this point, continued peening (overpeening) causes a slight but consistent decrease in \(S_a\). This is attributed to the repeated plastic working of the surface layer; subsequent impacts flatten the pile-ups from earlier craters and cause further plastic flow that can partially fill valleys, leading to a somewhat smoother, highly work-hardened surface, albeit with potential for micro-crack initiation.
Influence of Shot Velocity
Shot velocity is a primary determinant of peening intensity. We simulated the process with varying initial velocities (30, 40, and 50 m/s) while keeping other parameters constant, including the time to achieve full coverage for each condition.
The data demonstrates that higher shot velocity consistently produces a rougher surface. This is a direct consequence of increased impact energy (\(KE \propto v^2\)). Higher energy impacts create larger and deeper plastic craters, resulting in greater peak-to-valley distances and thus a higher \(S_a\) value. This presents a process design trade-off: higher velocity is desirable for introducing deeper compressive residual stresses, but it comes at the cost of increased surface roughness, which may be detrimental for contact fatigue and wear resistance in spiral bevel gears.
| Shot Velocity (m/s) | Kinetic Energy Multiplier (Rel. to 30 m/s) | Surface Roughness, S_a at Full Coverage (μm) |
|---|---|---|
| 30 | 1.00 | 0.90 |
| 40 | 1.78 | 1.01 |
| 50 | 2.78 | 1.10 |
Influence of Shot Diameter
Shot diameter affects both the mass (and thus kinetic energy) and the contact area. We investigated diameters of 0.3 mm, 0.6 mm, and 0.9 mm at a constant velocity of 50 m/s. The results were striking and highlighted the dominant effect of shot size on surface topography.
With larger shots, the surface roughness \(S_a\) not only reached significantly higher peak values but also exhibited a more dramatic evolution with coverage. For the 0.9 mm shot, \(S_a\) peaked at a very high value (~2.00 μm) at very low coverage and then decreased sharply with further peening. The larger mass (\(m \propto d^3\)) leads to a massive increase in kinetic energy and momentum per impact. This causes severe plastic deformation, creating very large craters and pile-ups initially. However, due to the smaller number of shots per unit mass flow and their large size, the surface is worked by fewer, more severe impacts. Subsequent large-diameter shots severely deform the already large features, leading to rapid flattening and a significant reduction in \(S_a\) as coverage increases, but the final surface remains much rougher than that created by smaller shots. This underscores that shot diameter is a critically sensitive parameter for controlling the final surface finish of peened spiral bevel gears.
| Shot Diameter (mm) | Mass & Energy Multiplier (Rel. to 0.3mm) | Peak S_a (μm) / at Coverage | S_a at High Coverage (~200%) (μm) |
|---|---|---|---|
| 0.3 | 1.00 | ~1.10 / at ~100% | ~0.97 |
| 0.6 | 8.00 | ~1.45 / at ~20% | ~1.23 |
| 0.9 | 27.00 | ~2.00 / at ~5% | ~1.65 |
Discussion and Implications for Process Design
The findings from this systematic study provide concrete guidance for the shot peening of spiral bevel gears. The most significant insight is the distinct and often dominant role of shot diameter over velocity in determining final surface roughness. While both parameters increase impact energy, the cubic relationship of mass to diameter makes it the more potent factor. For applications where surface smoothness is critical for contact performance (e.g., high-speed, low-lubrication conditions), using the smallest shot size that can achieve the desired residual stress profile is advisable.
The non-monotonic relationship between coverage/peening time and roughness is also crucial. The common industrial practice of peening to “full coverage” (100% or 200%) appears reasonable from a roughness perspective, as it often corresponds to the plateau or the beginning of the smoothing phase. Over-peening solely to increase coverage beyond this point may not worsen roughness significantly but wastes process time and energy and risks other damage mechanisms.
Our coupled DEM-FEM framework proved essential for these insights. A pure FEM model with random impact assumptions would fail to predict the correct impact conditions (velocity, angle) on the complex flank of spiral bevel gears, leading to erroneous predictions of both coverage evolution and roughness. The DEM step accurately captures the shot dynamics within the gear geometry, making the subsequent FEM deformation analysis physically realistic.
Future work can extend this model to predict not just topography but also the associated residual stress field and work hardening, providing a complete picture of the surface integrity of peened spiral bevel gears. Furthermore, the model can be used to optimize nozzle positioning, gear rotation, and traverse speeds to achieve more uniform coverage and roughness distribution across the entire active tooth flank.
Conclusion
In this work, we have presented and validated an advanced numerical framework for simulating the shot peening process on spiral bevel gears. The sequential coupling of Discrete Element Method (DEM) and Finite Element Method (FEM) successfully captures the complex shot flow dynamics on the gear geometry and the resulting elastoplastic surface deformation. The model’s predictions of three-dimensional surface roughness (\(S_a\)) showed good agreement with experimental measurements, validating its accuracy.
Employing this model, we conducted a detailed parametric study which yielded the following key conclusions for the investigated parameter ranges:
- Peening Time/Coverage: Surface roughness \(S_a\) increases rapidly to a maximum near full coverage (~100%) and then decreases slightly with further peening (overpeening).
- Shot Velocity: Higher shot velocities produce higher surface roughness due to increased impact energy, establishing a direct trade-off between potential residual stress depth and surface finish.
- Shot Diameter: This is the most influential parameter on final roughness. Larger diameters cause dramatically higher peak roughness and result in a final surface that is significantly rougher than one treated with smaller shots, due to the cubic relationship between diameter and impact energy/momentum.
This research provides a powerful simulation-based tool for engineers. It moves the design of shot peening processes for critical components like spiral bevel gears away from empirical guesswork towards a science-informed, predictive methodology. By understanding the quantitative links between process parameters and surface topography, manufacturers can proactively optimize peening protocols to achieve the desired balance of beneficial compressive stresses and acceptable surface roughness, thereby enhancing the fatigue performance and service life of these essential transmission components.