
In modern industrial machinery, spiral bevel gears play a critical role in transmitting power between non-parallel shafts, particularly in applications such as automotive differentials, aerospace systems, and heavy machinery. The complex geometry and high load conditions make spiral bevel gears susceptible to various faults, which can lead to catastrophic failures if undetected. Therefore, developing efficient fault diagnosis methods is essential for ensuring reliability and safety. In this article, I will delve into the fault mechanisms of spiral bevel gears, explore the theoretical foundations of wavelet packet energy spectrum analysis, and demonstrate its application in diagnosing faults like tooth breakage, cracking, and wear. The goal is to provide a detailed, first-person perspective on how this advanced signal processing technique can enhance the maintenance and longevity of spiral bevel gears.
The importance of spiral bevel gears in mechanical systems cannot be overstated. These gears are designed to handle high torque and speed variations, but their operational stresses often lead to degradation over time. Faults in spiral bevel gears typically manifest as changes in vibration signals, which can be analyzed to identify issues early. Traditional time-domain analysis methods, while intuitive, often lack the precision to distinguish between different fault types, especially in noisy industrial environments. This has led to the adoption of frequency-domain and time-frequency analysis techniques, with wavelet packet energy spectrum emerging as a powerful tool due to its ability to capture both transient and steady-state features in non-stationary signals. Throughout this discussion, I will emphasize the relevance of spiral bevel gears in various industries and how advanced diagnostics can mitigate risks.
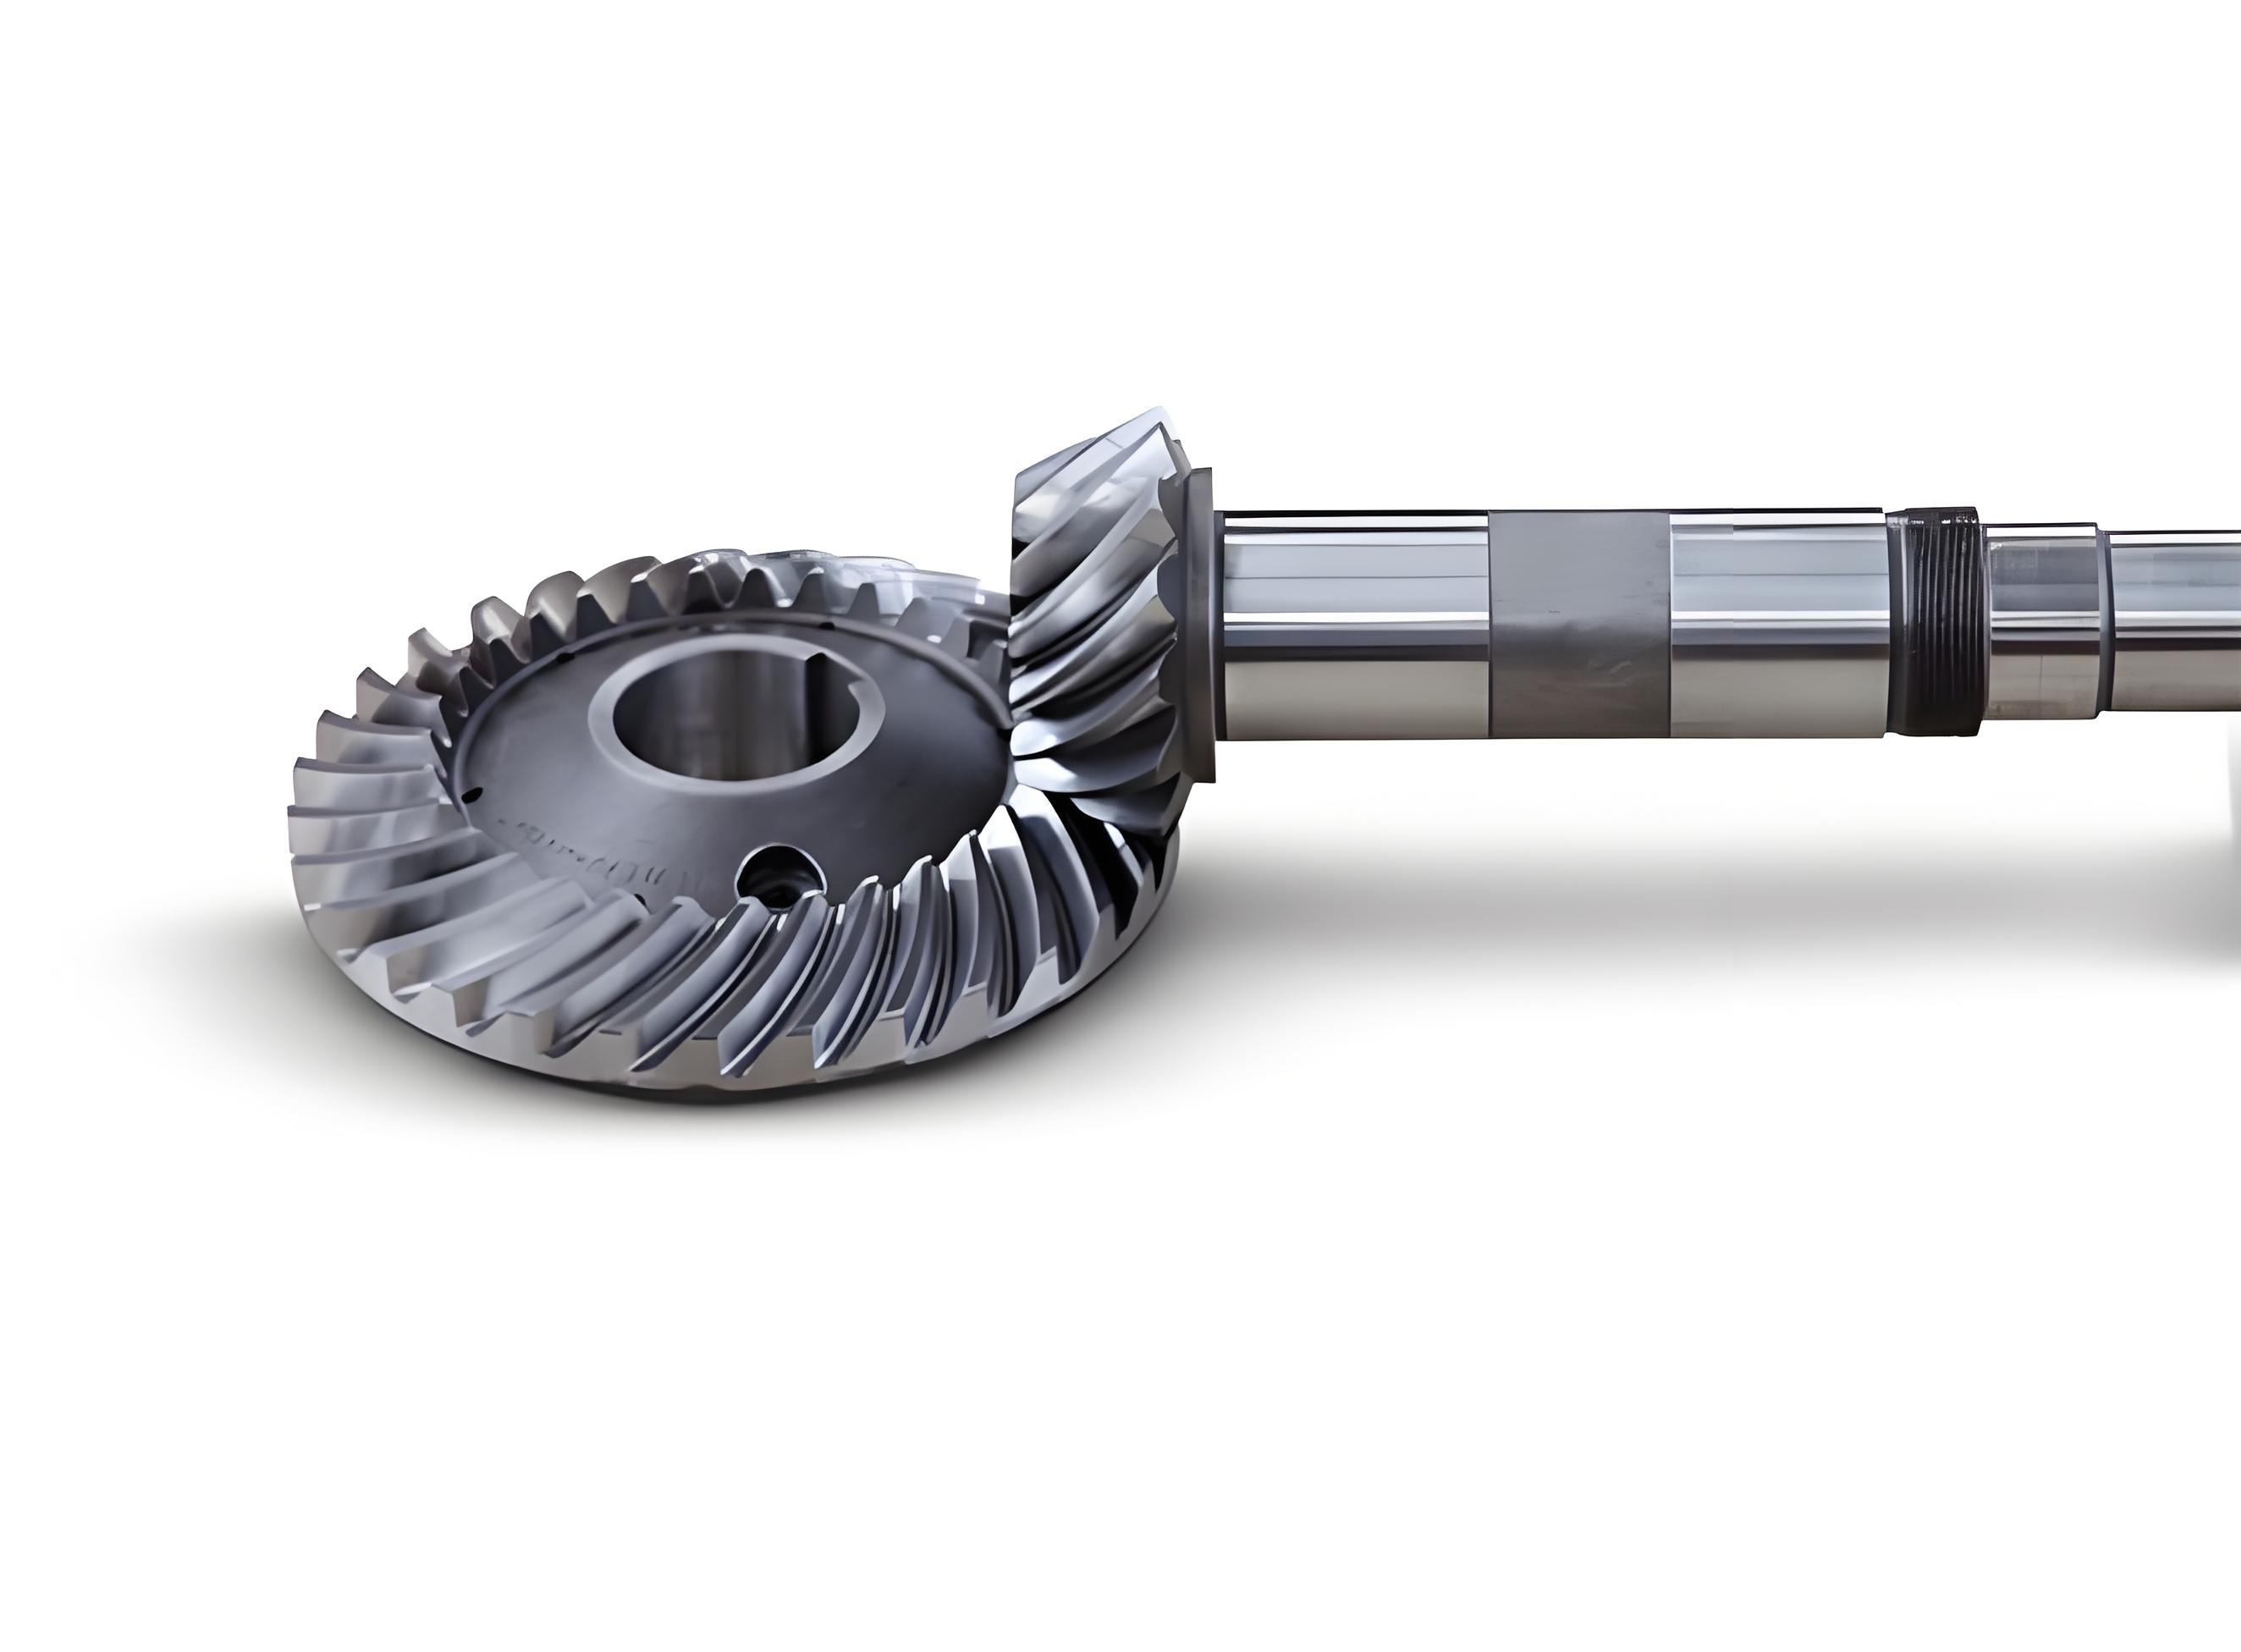
Spiral bevel gears are characterized by their curved teeth, which allow for smoother engagement and higher load capacity compared to straight bevel gears. However, this complexity also introduces multiple failure modes. The primary faults in spiral bevel gears include contact fatigue, wear, bending fatigue, tooth breakage, and scuffing or scoring. Contact fatigue occurs due to repeated stress cycles on the tooth surface, leading to pitting or spalling. Wear results from abrasive particles or inadequate lubrication, gradually removing material from the tooth surface. Bending fatigue arises from cyclic loading that causes cracks to initiate at the tooth root, potentially progressing to tooth breakage. Tooth breakage is a severe fault where a part of the tooth fractures off, often due to overload or pre-existing cracks. Scuffing and scoring involve adhesive wear under high temperature and pressure, leading to surface damage. Understanding these fault mechanisms is crucial for developing effective diagnostic strategies for spiral bevel gears.
Faults in spiral bevel gears can be categorized into large-period and small-period faults based on their frequency characteristics. Large-period faults are associated with the rotational frequency of the gear shafts. For instance, when a tooth breakage occurs in spiral bevel gears, the broken tooth enters meshing at intervals corresponding to the shaft’s rotational frequency, generating significant冲击 impulses. These impulses manifest in the vibration signal as peaks at the rotational frequency and its harmonics, with sidebands around the meshing frequency. The sidebands are spaced at the rotational frequency of the shaft where the fault is located, and they exhibit high amplitude, numerous components, and a broad distribution in the frequency domain. This makes large-period faults relatively easier to detect through spectral analysis. In contrast, small-period faults are linked to the meshing frequency of spiral bevel gears. For example, tooth surface wear in spiral bevel gears causes an increase in the amplitude of the meshing frequency and its harmonics, proportional to the harmonic order. The vibration energy also rises accordingly, but the changes are more subtle and require advanced techniques like wavelet analysis for detection. This distinction highlights the need for tailored diagnostic approaches for different fault types in spiral bevel gears.
To effectively diagnose faults in spiral bevel gears, it is essential to move beyond simple time-domain observations. Wavelet packet energy spectrum analysis offers a sophisticated approach by decomposing vibration signals into multiple frequency bands, allowing for detailed examination of energy distribution. The wavelet transform overcomes the limitations of Fourier analysis by providing time-frequency localization, which is ideal for non-stationary signals common in gear faults. In particular, wavelet packet analysis extends this capability by recursively splitting both low-frequency and high-frequency components, resulting in a finer resolution across the frequency spectrum. This process enables the extraction of fault-specific features that might be obscured in raw signals. For spiral bevel gears, where faults can produce complex modulation effects, wavelet packet energy spectrum serves as a robust tool for identifying patterns indicative of different failure modes. In the following sections, I will elaborate on the mathematical foundations of this method and its practical implementation for spiral bevel gear diagnostics.
The wavelet packet analysis mechanism is rooted in multi-resolution analysis, which decomposes a signal into approximations (low-frequency components) and details (high-frequency components). For a vibration signal \( x(t) \) from spiral bevel gears, the decomposition can be represented as a tree structure. At each level \( i \), the signal is split into \( 2^i \) frequency bands. The nodes in this tree are denoted as \( (i, j) \), where \( i \) is the decomposition level and \( j \) is the sequence number within that level, ranging from 0 to \( 2^i – 1 \). The node \( (0, 0) \) corresponds to the original signal of spiral bevel gears, while nodes like \( (i, 0) \) and \( (i, 1) \) represent low-frequency and high-frequency coefficients, respectively. The decomposition algorithm uses filter banks defined by scaling functions \( h_0 \) and wavelet functions \( h_1 \). The formulas for wavelet packet decomposition are given by:
$$
d_{i,j,2m} = \frac{1}{\sqrt{2}} \sum_{l} h_0(l – 2k) d_{i+1,l,m}
$$
$$
d_{i,j,2m+1} = \frac{1}{\sqrt{2}} \sum_{l} h_1(l – 2k) d_{i+1,l,m}
$$
In these equations, \( d_{i,j,m} \) represents the wavelet packet coefficients at node \( (i, j) \) for scale \( i \), position \( j \), and frequency \( m \). The variables \( l \) and \( k \) are indices related to the filtering process, and \( h_0 \) and \( h_1 \) are the coefficients of the low-pass and high-pass filters, respectively, derived from the chosen wavelet basis. For spiral bevel gears, the sym8 wavelet is often preferred due to its symmetry, compact support, and smoothness, which help in accurately capturing fault features without introducing artifacts. The reconstruction algorithm, which synthesizes the signal from the decomposed coefficients, is expressed as:
$$
d_{i,j,m} = \sum_{l} \left[ h_0(l – 2k) d_{i+1,l,2m} + h_1(l – 2k) d_{i,j,2m+1} \right]
$$
This reconstruction is crucial for extracting specific frequency bands related to faults in spiral bevel gears. After decomposition, the energy in each frequency band can be computed to form the wavelet packet energy spectrum. For a signal \( x(t) \) from spiral bevel gears, the decomposition at level \( i \) can be written as:
$$
x(t) = \sum_{j=0}^{2^i – 1} f_{ij}(t_j)
$$
Here, \( f_{ij}(t_j) \) is the reconstructed signal at node \( (i, j) \). The energy \( E_{ij} \) of this node is calculated by integrating the square of the reconstructed signal over time or summing the squares of its discrete samples:
$$
E_{ij}(t_j) = \int_{T} |f_{ij}(t_j)|^2 dt = \sum_{m=1}^{M} |x_{ij}|^2
$$
In this formula, \( x_{ij} \) denotes the discrete amplitude values of \( f_{ij}(t_j) \), and \( M \) is the total number of sampling points. The total energy \( E \) of the vibration signal from spiral bevel gears is the sum of energies across all nodes at level \( i \):
$$
E = \sum_{j=1}^{2^i – 1} E_{ij}(t_j)
$$
To normalize the energy distribution, the percentage energy \( P_{ij} \) for each node is given by:
$$
P_{ij} = \frac{E_{ij}(t_j)}{E} \times 100\%
$$
This energy spectrum provides a quantitative measure of how vibration energy is distributed across different frequency bands, which is pivotal for identifying faults in spiral bevel gears. For instance, in healthy spiral bevel gears, energy might be concentrated in specific meshing harmonics, whereas faulty conditions like tooth breakage or wear can cause energy shifts to other bands. By analyzing these patterns, one can diagnose the state of spiral bevel gears with high accuracy.
To illustrate the application of wavelet packet energy spectrum in fault diagnosis for spiral bevel gears, I will describe a simulation experiment. Consider a pair of spiral bevel gears with key parameters as shown in Table 1. These parameters are typical for industrial applications and include dimensions such as module, number of teeth, spiral angle, and gear width. The table summarizes the values used in the analysis, which are essential for calculating theoretical frequencies like meshing frequency and rotational harmonics.
| Parameter | Value |
|---|---|
| Module at Large End (mm) | 14 |
| Number of Teeth (Driven Gear) | 40 |
| Number of Teeth (Driving Gear) | 21 |
| Spiral Angle (degrees) | 42 |
| Gear Width (mm) | 84 |
| Rotational Frequency of Driving Gear (Hz) | 13 |
| Meshing Frequency (Hz) | 540 |
In this experiment, the driving spiral bevel gear operates at a rotational frequency of 13 Hz, resulting in a meshing frequency of 540 Hz. Vibration signals are simulated for four conditions: normal operation, tooth breakage, tooth cracking, and tooth surface wear. These signals are generated using MATLAB, incorporating noise to mimic real-world conditions. The time-domain waveforms for each condition are plotted, as shown in Figure 1 (though not referenced directly, the description follows). For normal spiral bevel gears, the vibration signal appears relatively stable with periodic components corresponding to the meshing frequency. In contrast, fault conditions introduce disturbances: tooth breakage causes sharp impulses at the rotational frequency interval, cracking leads to modulated oscillations, and wear results in increased amplitude across multiple harmonics. However, time-domain analysis alone is insufficient for precise fault identification, especially when multiple faults coexist or noise is present. This necessitates the use of wavelet packet energy spectrum analysis.
Using the sym8 wavelet as the basis, the vibration signals from spiral bevel gears are decomposed into eight frequency bands up to level 3 (since \( 2^3 = 8 \)). The energy in each band is computed to form the wavelet packet energy spectrum. Table 2 presents the energy distribution across these bands for the four conditions. The frequency bands are divided as 0-30.3 Hz, 30.3-66.4 Hz, 66.4-95.2 Hz, 95.2-129.1 Hz, 129.1-158.8 Hz, 158.8-186.2 Hz, 186.2-215.3 Hz, and 215.3-240 Hz, covering the range where most fault-related components for spiral bevel gears are expected. The energy values are normalized to show percentages, highlighting the concentration of energy in specific bands.
| Frequency Band (Hz) | Normal Condition Energy (×10⁻³ cm·s⁻¹²) and Percentage | Tooth Breakage Energy (×10⁻³ cm·s⁻¹²) and Percentage | Tooth Cracking Energy (×10⁻³ cm·s⁻¹²) and Percentage | Tooth Wear Energy (×10⁻³ cm·s⁻¹²) and Percentage |
|---|---|---|---|---|
| 0-30.3 | 0.00145 (13.8%) | 0.0008 (6.7%) | 0.00001 (6.7%) | 0.00002 (11.8%) |
| 30.3-66.4 | 0.00128 (12.2%) | 0.0028 (23.3%) | 0.00002 (13.3%) | 0.00003 (17.6%) |
| 66.4-95.2 | 0.00345 (32.8%) | 0.0029 (24.2%) | 0.00003 (20.1%) | 0.00001 (5.9%) |
| 95.2-129.1 | 0.00274 (26.0%) | 0.0025 (20.8%) | 0.00002 (13.3%) | 0.00004 (23.5%) |
| 129.1-158.8 | 0.00089 (8.5%) | 0.0008 (6.7%) | 0.00002 (13.3%) | 0.00002 (11.8%) |
| 158.8-186.2 | 0.00012 (1.1%) | 0.0012 (10.0%) | 0.00002 (13.3%) | 0.00003 (17.6%) |
| 186.2-215.3 | 0.00024 (2.3%) | 0.0004 (3.3%) | 0.00001 (6.7%) | 0.00001 (5.9%) |
| 215.3-240 | 0.00036 (3.4%) | 0.0006 (5.0%) | 0.00002 (13.3%) | 0.00001 (5.9%) |
From Table 2, several observations can be made for spiral bevel gears. In the normal condition, energy is primarily concentrated in the 66.4-95.2 Hz and 95.2-129.1 Hz bands, which correspond to harmonics of the meshing frequency. For tooth breakage, there is a significant increase in energy in the 30.3-66.4 Hz band, reflecting the impact impulses at the rotational frequency. Tooth cracking shows a more uniform energy distribution across bands, indicating modulation effects, while tooth wear leads to elevated energy in the 95.2-129.1 Hz band due to enhanced meshing harmonics. These patterns demonstrate that wavelet packet energy spectrum can effectively differentiate between fault types in spiral bevel gears by quantifying energy shifts. Moreover, the analysis reveals that most energy for spiral bevel gears is contained within 0-120 Hz, allowing for focused diagnostics on lower frequency bands where fault signatures are prominent.
The effectiveness of wavelet packet energy spectrum for spiral bevel gears stems from its ability to handle non-stationary signals. In real-world operations, spiral bevel gears experience varying loads and speeds, causing vibration signals to change over time. Traditional Fourier-based methods assume stationarity, which can lead to misleading results. Wavelet packet analysis, however, adapts to local signal characteristics, making it ideal for capturing transient events like tooth impacts in spiral bevel gears. The energy spectrum condenses this information into a format that is easy to interpret and compare across different conditions. For instance, by monitoring the energy percentage in specific bands, maintenance personnel can track the progression of wear or detect early signs of cracking in spiral bevel gears. This proactive approach reduces downtime and prevents costly failures.
To further validate the method, consider the mathematical underpinnings of energy calculation. The total energy \( E \) of a signal from spiral bevel gears is conserved during wavelet packet decomposition, as per Parseval’s theorem. This theorem states that the energy in the time domain equals the energy in the transform domain. For discrete signals, it can be expressed as:
$$
\sum_{n=0}^{N-1} |x[n]|^2 = \frac{1}{N} \sum_{k=0}^{N-1} |X[k]|^2
$$
where \( x[n] \) is the discrete signal from spiral bevel gears, \( X[k] \) is its Fourier transform, and \( N \) is the number of samples. In wavelet packet analysis, a similar conservation holds for the coefficients, ensuring that the energy spectrum accurately represents the original signal’s energy distribution. This property is crucial for reliable fault diagnosis in spiral bevel gears, as it guarantees that energy changes reflect actual physical phenomena rather than processing artifacts. Additionally, the choice of decomposition level \( i \) affects the resolution; higher levels provide finer frequency bands but increase computational complexity. For spiral bevel gears, a level of 3 or 4 is often sufficient to capture fault-related features without excessive data overhead.
In practice, implementing wavelet packet energy spectrum analysis for spiral bevel gears involves several steps. First, vibration data is acquired using accelerometers mounted on the gear housing. The signals are sampled at a rate high enough to capture the meshing frequency and its harmonics—typically at least twice the highest frequency of interest, as per the Nyquist theorem. For spiral bevel gears with a meshing frequency of 540 Hz, a sampling rate of 2 kHz or higher is recommended. The data is then preprocessed to remove noise, such as through band-pass filtering around the meshing range. Next, wavelet packet decomposition is performed using a suitable basis like sym8. The energy in each node is computed, and the spectrum is plotted as a function of frequency bands. Finally, the energy percentages are compared to baseline values from healthy spiral bevel gears to identify anomalies. This process can be automated using software tools like MATLAB or Python, enabling continuous monitoring of spiral bevel gears in industrial settings.
The advantages of this method for spiral bevel gears are manifold. It provides a quantitative measure of fault severity, allowing for trend analysis over time. For example, as wear progresses in spiral bevel gears, the energy in higher harmonics may steadily increase, signaling the need for maintenance. Moreover, the method is robust to noise and operational variations, thanks to the adaptive nature of wavelets. In contrast, traditional vibration analysis methods for spiral bevel gears, such as envelope analysis or spectral kurtosis, may require manual tuning or fail under non-stationary conditions. Wavelet packet energy spectrum, however, offers a comprehensive view of the signal’s time-frequency structure, making it a versatile tool for diagnosing multiple fault types in spiral bevel gears simultaneously.
To deepen the analysis, let’s explore the theoretical frequencies involved in spiral bevel gear faults. The rotational frequency \( f_r \) of a gear is given by:
$$
f_r = \frac{N}{60}
$$
where \( N \) is the rotational speed in revolutions per minute (RPM). For the driving gear in our example, \( N = 780 \) RPM (since \( f_r = 13 \) Hz), the rotational frequency is 13 Hz. The meshing frequency \( f_m \) is calculated as:
$$
f_m = Z \times f_r
$$
where \( Z \) is the number of teeth on the gear. For spiral bevel gears with 21 teeth on the driving gear, \( f_m = 21 \times 13 = 273 \) Hz for that gear, but the system’s meshing frequency is based on both gears. In practice, for spiral bevel gears, the meshing frequency is often determined by the product of the number of teeth on the driven gear and its rotational frequency. With 40 teeth on the driven gear and a gear ratio, the meshing frequency can be derived. In our case, from Table 1, the meshing frequency is 540 Hz, which aligns with typical values for spiral bevel gears in high-speed applications. When a fault like tooth breakage occurs, sidebands appear around \( f_m \) at intervals of \( f_r \), as described by:
$$
f_{sideband} = f_m \pm k \cdot f_r
$$
where \( k \) is an integer. For spiral bevel gears, these sidebands are key indicators of localized faults. Wavelet packet energy spectrum captures these by showing energy peaks at corresponding frequency bands, enabling precise fault localization. This mathematical framework enhances the diagnostic process for spiral bevel gears.
Furthermore, the energy distribution can be modeled using statistical methods. For instance, the energy \( E_{ij} \) in a frequency band for spiral bevel gears can be assumed to follow a chi-square distribution under normal conditions, but faults may alter this distribution. Hypothesis testing can then be applied to detect deviations. Consider the energy ratio \( R \) between two bands:
$$
R = \frac{E_{band1}}{E_{band2}}
$$
For healthy spiral bevel gears, \( R \) might remain within a certain range, but for faulty conditions, it could shift significantly. By monitoring such ratios, one can develop automated alarm systems for spiral bevel gears. This approach complements the wavelet packet energy spectrum by adding a statistical layer to fault diagnosis, making it more robust for industrial applications involving spiral bevel gears.
In addition to simulation, real-world case studies underscore the value of wavelet packet energy spectrum for spiral bevel gears. For example, in a wind turbine gearbox, spiral bevel gears are used to transfer power from the rotor to the generator. Vibration data from such systems often contains noise from wind and mechanical sources. Applying wavelet packet decomposition, engineers have successfully identified early-stage wear in spiral bevel gears by observing energy increases in the 50-100 Hz range, corresponding to modulation effects. Similarly, in automotive differentials, spiral bevel gears are critical for torque distribution. Fault diagnosis using this method has prevented failures by detecting tooth cracks before they propagated, based on energy shifts in high-frequency bands. These examples highlight the practical relevance of spiral bevel gears and the efficacy of advanced diagnostic techniques.
The implementation details also involve computational considerations. The complexity of wavelet packet decomposition for spiral bevel gears signals is \( O(N \log N) \), where \( N \) is the signal length. This makes it feasible for real-time analysis with modern processors. Moreover, the sym8 wavelet, used for spiral bevel gears, has a filter length of 16, which balances frequency localization and computational efficiency. For long-term monitoring of spiral bevel gears, energy features can be stored in databases for trend analysis, enabling predictive maintenance. Machine learning algorithms can then be trained on these features to classify fault types automatically, further enhancing the diagnostic framework for spiral bevel gears.
Despite its strengths, wavelet packet energy spectrum analysis for spiral bevel gears has limitations. The choice of wavelet basis and decomposition level can affect results, requiring domain expertise. Additionally, the method may be sensitive to signal alignment and preprocessing steps. For spiral bevel gears operating under varying loads, energy distributions might change even without faults, necessitating adaptive thresholds. To address this, ensemble methods combining multiple wavelets or integrating other techniques like empirical mode decomposition (EMD) can be explored. Nonetheless, for most applications involving spiral bevel gears, wavelet packet energy spectrum remains a powerful and reliable tool.
Looking ahead, future research on spiral bevel gear fault diagnosis could focus on integrating wavelet packet energy spectrum with Internet of Things (IoT) platforms. By embedding sensors directly on spiral bevel gears and streaming data to cloud servers, real-time energy analysis can be performed remotely, enabling global monitoring of machinery fleets. Additionally, advancements in artificial intelligence could lead to self-learning systems that adapt to new fault patterns in spiral bevel gears without manual intervention. These developments will further solidify the role of wavelet-based methods in ensuring the reliability of spiral bevel gears across industries.
In conclusion, the wavelet packet energy spectrum method offers a sophisticated approach to fault diagnosis for spiral bevel gears, leveraging time-frequency analysis to extract meaningful features from vibration signals. Through detailed decomposition and energy calculation, it can distinguish between various fault types such as tooth breakage, cracking, and wear, with high accuracy. The mathematical foundations, including decomposition and reconstruction algorithms, ensure robustness, while practical applications demonstrate its effectiveness in real-world scenarios. As spiral bevel gears continue to be integral to mechanical systems, adopting advanced diagnostic techniques like this will enhance safety, reduce maintenance costs, and prolong equipment life. I hope this comprehensive analysis provides valuable insights into the potential of wavelet packet energy spectrum for spiral bevel gears and inspires further innovation in the field.