
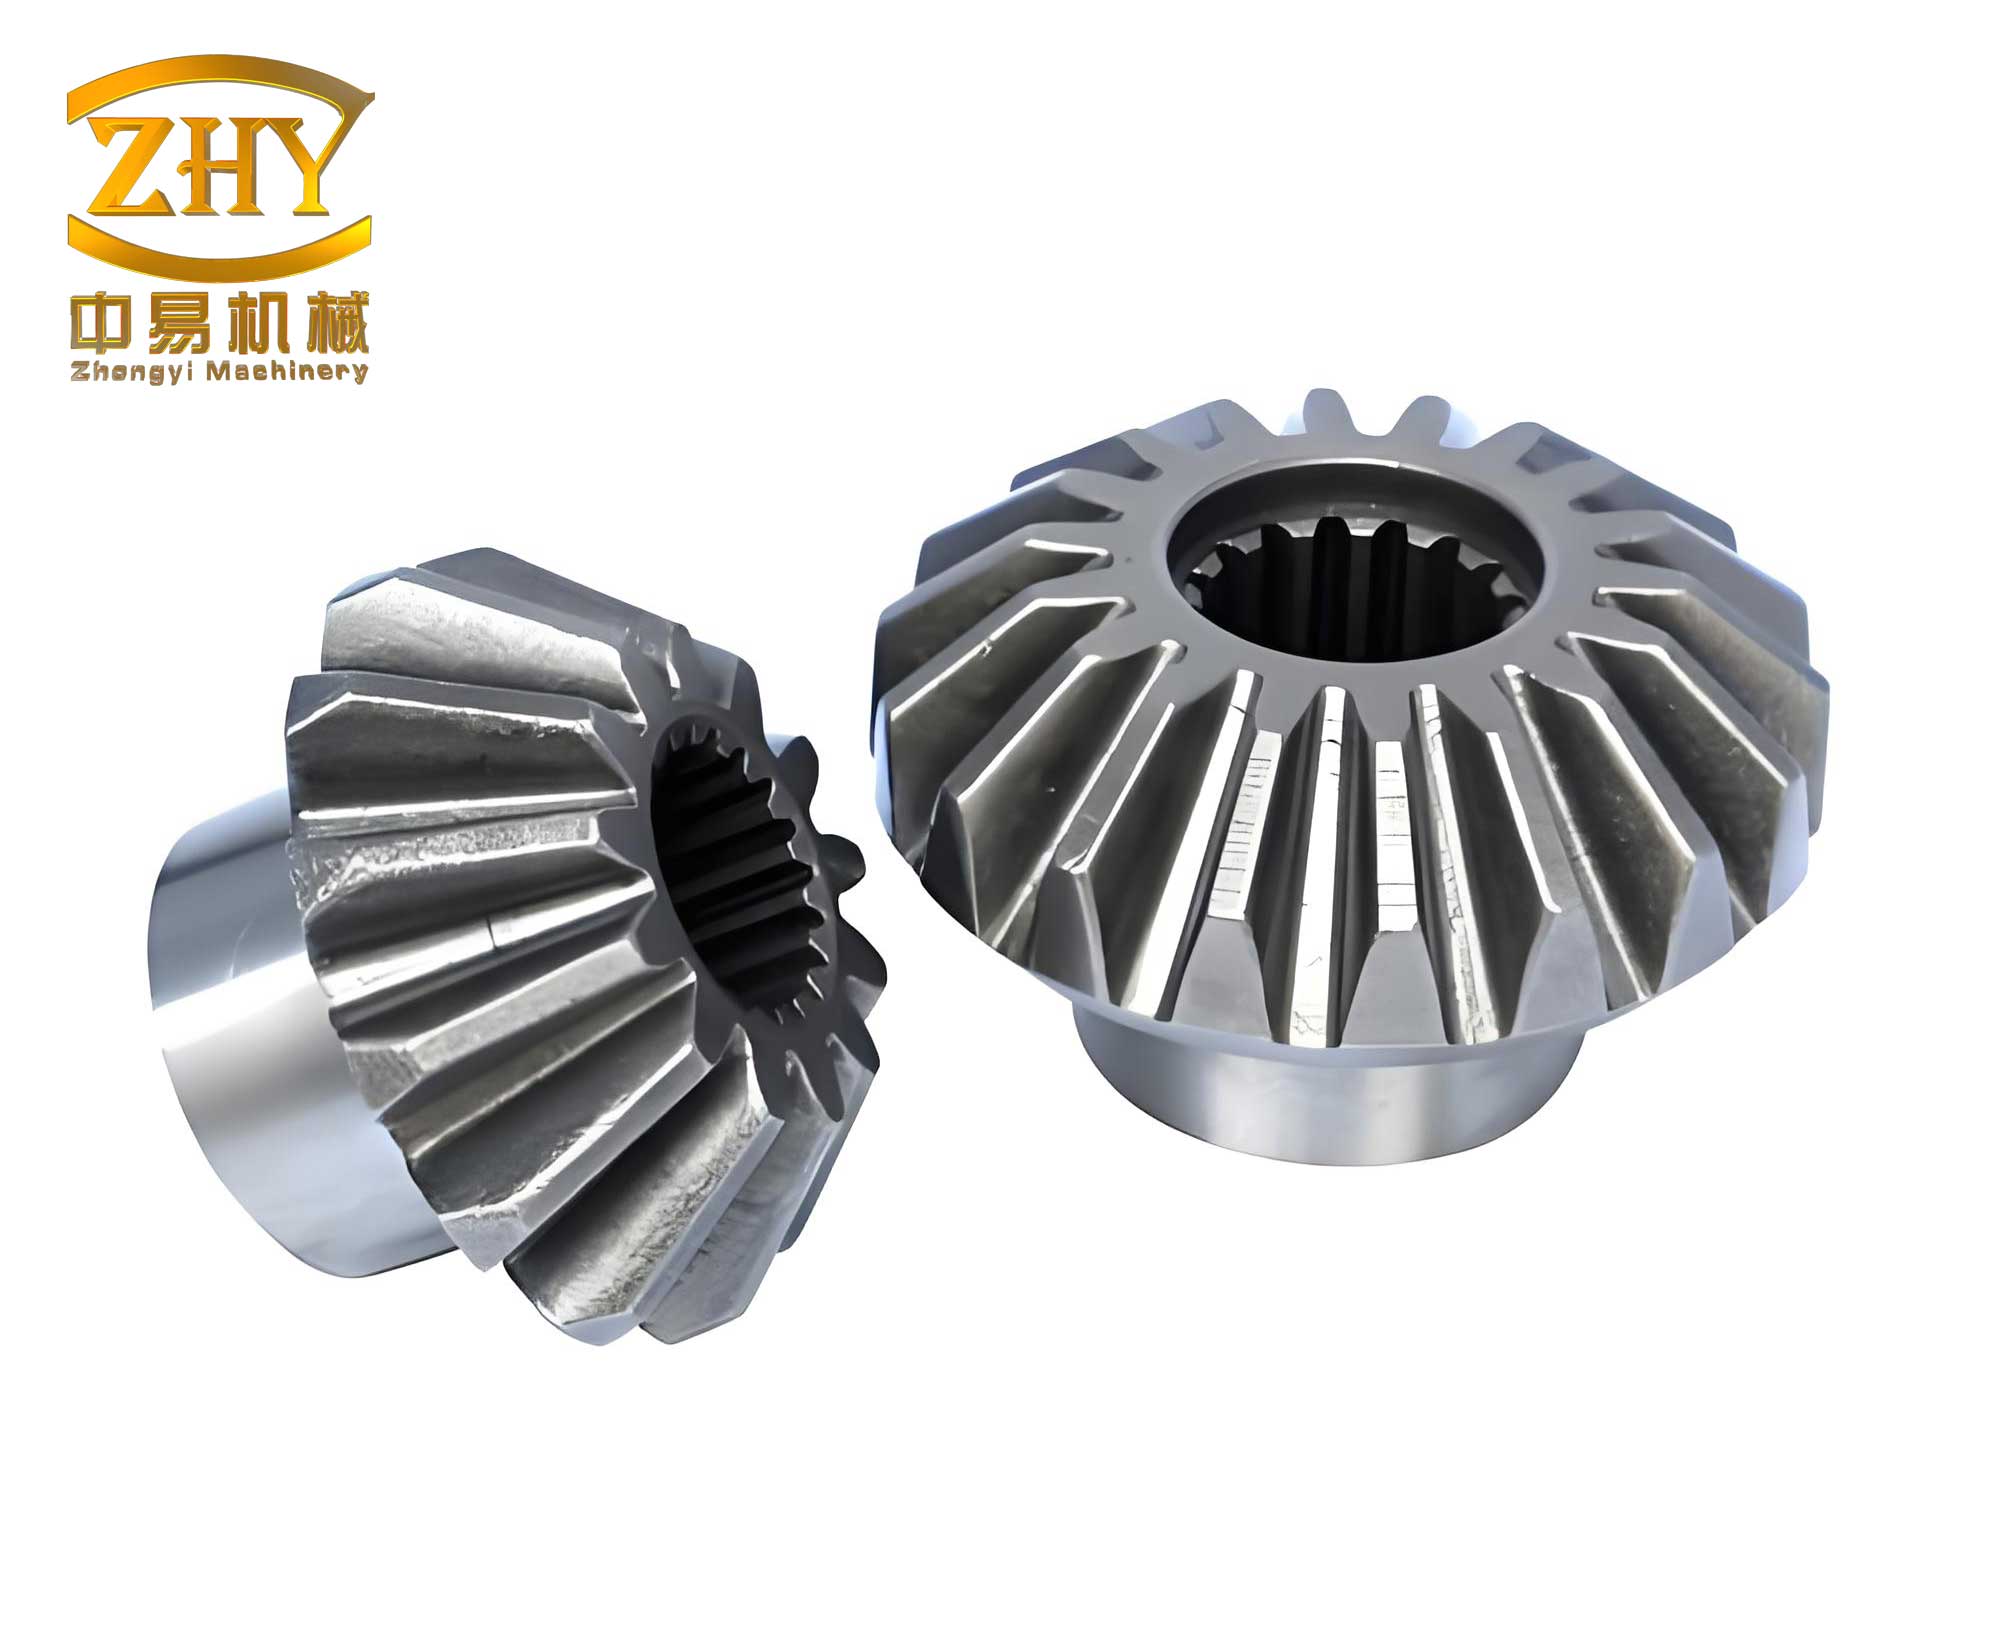
In modern manufacturing, the reliability of CNC machine tools is paramount, and the turret component plays a critical role in ensuring machining accuracy and efficiency. As a researcher focused on mechanical transmission systems, I have observed that vibration noise in turret mechanisms often stems from the bevel gears used in the drive system. Specifically, spiral bevel gears are commonly employed for their smooth transmission, but improper design or manufacturing can lead to significant noise, affecting workpiece quality and tool life. This article delves into the analysis of vibration noise in CNC machine tool turret bevel gears, employing methods like reverse engineering, tolerance measurement, and spectral noise analysis. By investigating sample bevel gears and proposing improvements, I aim to enhance the meshing quality of domestic bevel gears, thereby boosting machine tool performance. Throughout this discussion, the term “bevel gear” will be frequently referenced to emphasize its centrality in this study.
The vibration noise in bevel gears arises from multiple factors, including manufacturing errors, installation inaccuracies, and dynamic load variations. During operation, the bevel gear teeth experience changing stiffness due to fluctuating contact points and instantaneous transmission ratios, leading to impacts that excite vibrations. Additionally, insufficient support system stiffness and rotor imbalance can exacerbate overall noise. In CNC machine tool turrets, these vibrations manifest as loud noises, particularly during tool changes or high-speed rotations, compromising precision. To address this, I focused on analyzing a sample bevel gear from a commercial turret, which exhibited excessive noise at spindle speeds up to 5000 r/min. The primary culprits were identified as pitch errors, tooth profile deviations, and low overlap ratios, all of which are critical in bevel gear performance.
To assess the sample bevel gear’s accuracy, I utilized laser scanning reverse engineering technology. This involved capturing point cloud data using a Creaform HandySCAN 700 scanner, which was then processed in software like SolidWorks and MATLAB to generate 3D models and extract geometric parameters. The data revealed significant deviations in tooth profiles and pitch. For instance, the point cloud data for both the driven and driving bevel gears were filtered to obtain contour curves at the large, middle, and small ends. By applying coordinate transformations and fitting circles, I calculated roundness errors and pitch deviations. The results showed that the sample bevel gear had substantial pitch errors, with maximum values reaching 0.3181 mm for the driving gear and 0.2036 mm for the driven gear. These errors reduce the effective contact ratio, causing edge contact and vibration in the bevel gear system. The chordal tooth thickness analysis further indicated inconsistencies, with standard deviations of 0.1212 mm for the driven gear and 0.0684 mm for the driving gear, contributing to uneven meshing and noise.
Key parameters of the sample bevel gear were calculated to understand its design flaws. The gear had 19 teeth, a module of 3 mm, a pressure angle of 20°, and a mid-spiral angle of 35°. Using mathematical formulas, I derived the theoretical tooth thickness and overlap ratios. The chordal tooth thickness at any point can be expressed as:
$$ S_i = 2r_i \left( \frac{\pi}{2Z_v} + \frac{2\xi \tan \alpha_f}{Z_v} + \text{inv}\alpha_i – \text{inv}\alpha_f \right) $$
where \( r_i \) is the radius at any point, \( Z_v \) is the virtual number of teeth, \( \xi \) is the normal parameter, \( \alpha_i \) is the pressure angle at any point, \( \alpha_f \) is the reference point pressure angle, and \( \text{inv}\alpha = \tan\alpha – \alpha \). The face overlap ratio is given by:
$$ \epsilon_\alpha = \frac{g_{an}}{P_{mm} \cos \alpha_n (\cos^2 \beta_m + \tan^2 \alpha_n)} $$
where \( g_{an} \) is the meshing line length in the normal section, \( P_{mm} \) is the normal pitch at the midpoint, \( \alpha_n \) is the normal pressure angle, and \( \beta_m \) is the mid-spiral angle. The axial overlap ratio is:
$$ \epsilon_\beta = \frac{1}{\pi m_{et}} \left( K_z \tan\beta_m – \frac{K_z^3 \tan^2 \beta_{nm}}{3R_e} \right) $$
with \( m_{et} \) as the reference point face module, \( \beta_{nm} \) as the spiral angle at any point, \( R_e \) as the outer cone distance, and \( K_z \) as the ratio of tooth surface twist arc to pitch. The total overlap ratio is:
$$ \epsilon_0 = \sqrt{\epsilon_\alpha^2 + \epsilon_\beta^2} $$
For the sample bevel gear, calculations yielded a total overlap ratio of 1.9563, which is relatively low for high-speed applications. This, combined with the large module and few teeth, explained the vibration issues. The parameters are summarized in Table 1.
| Parameter | Symbol | Value |
|---|---|---|
| Number of Teeth | Z | 19 |
| Module | m | 3 mm |
| Pressure Angle | α | 20° |
| Mid-Spiral Angle | β_m | 35° |
| Theoretical Circular Tooth Thickness | s | 4.71 mm |
| Theoretical Midpoint Chordal Tooth Thickness | S’_mn | 3.857 mm |
| Total Overlap Ratio | ε_0 | 1.9563 |
To improve the bevel gear design, I optimized the parameters while keeping the pitch diameter constant to maintain the transmission ratio. The goal was to increase the overlap ratio by adjusting the module and number of teeth. After evaluating various combinations, a module of 1.75 mm and 29 teeth were selected, resulting in a higher overlap ratio. The calculations for different options are shown in Table 2, demonstrating that this configuration maximizes meshing smoothness.
| Module (mm) | Number of Teeth | Total Overlap Ratio |
|---|---|---|
| 2.25 | 23 | 2.2605 |
| 1.75 | 29 | 3.8799 |
| 1.50 | 33 | 3.0067 |
The improved bevel gear was manufactured with these parameters, and its geometric accuracy was verified through reverse engineering. The point cloud data showed reduced pitch errors and tooth thickness variations compared to the sample bevel gear. For instance, the standard deviation of pitch errors decreased to 0.0937 mm for the driving gear and 0.0994 mm for the driven gear, while chordal tooth thickness standard deviations were 0.0982 mm and 0.0654 mm, respectively. This indicated better manufacturing precision. The key parameters of the improved bevel gear are listed in Table 3.
| Parameter | Symbol | Value |
|---|---|---|
| Number of Teeth | Z | 29 |
| Module | m | 1.75 mm |
| Pressure Angle | α | 20° |
| Mid-Spiral Angle | β_m | 35° |
| Theoretical Circular Tooth Thickness | S | 2.75 mm |
| Pitch Cone Angle | δ | 45° |
| Theoretical Midpoint Chordal Tooth Thickness | S’_mn | 2.2275 mm |
Experimental noise analysis was conducted to validate the improvements. Both the sample and improved bevel gears were installed in a GTB150-300 machine tool turret, and noise audio was recorded under no-load conditions at a spindle speed of 1000 r/min. Using Audacity software with HannWindow functions for spectral analysis, I compared the audio files. The HannWindow function reduces leakage in frequency measurements, expressed as:
$$ w(n) = 0.5 \left( 1 – \cos\left( \frac{2\pi n}{N-1} \right) \right) $$
where \( n \) is the sample index and \( N \) is the window length. The standard autocorrelation graphs revealed that the improved bevel gear meshed at approximately 4300 times per second, while the sample bevel gear meshed at 2500 times per second, correlating with their tooth counts. The inverse logarithmic spectrum showed lower amplitude vibrations for the improved bevel gear, indicating quicker stabilization. Frequency spectrum comparisons, as illustrated in Figure 14, highlighted that the sample bevel gear produced peak noise of -26 dB at 1288 Hz, with additional peaks at 2846 Hz and 5212 Hz, suggesting intermittent impacts due to pitch errors. In contrast, the improved bevel gear had a peak of -31 dB at 5064 Hz, demonstrating a 5 dB reduction and more consistent harmonics. This confirms that the higher overlap ratio and reduced errors in the improved bevel gear effectively mitigate vibration noise.
Further analysis involved calculating the sound pressure levels and vibration energies. The root mean square (RMS) of vibration acceleration can be modeled as:
$$ a_{\text{rms}} = \sqrt{ \frac{1}{T} \int_0^T a(t)^2 dt } $$
where \( a(t) \) is the time-domain acceleration signal. For the sample bevel gear, the RMS values were higher, indicating greater dynamic loads. The improved bevel gear’s design also enhanced the contact pattern, reducing stress concentrations. The contact ratio improvement can be quantified by the formula for dynamic load factor:
$$ K_v = \frac{1}{1 + \frac{v}{C}} $$
where \( v \) is the pitch line velocity and \( C \) is a constant dependent on gear accuracy. With better manufacturing, the improved bevel gear achieved a lower \( K_v \), minimizing shock loads. Additionally, the tooth stiffness variation, a key noise source, was assessed using:
$$ k(t) = \frac{F(t)}{\delta(t)} $$
with \( F(t) \) as the meshing force and \( \delta(t) \) as the deflection. The improved bevel gear showed more uniform stiffness over the meshing cycle, thanks to its optimized tooth profile.
In conclusion, this study underscores the importance of precise parameter selection in bevel gear design to reduce vibration noise in CNC machine tool turrets. By employing reverse engineering and spectral analysis, I identified that sample bevel gears suffered from low overlap ratios, pitch errors, and tooth profile inaccuracies. Optimizing the module to 1.75 mm and increasing teeth to 29 boosted the overlap ratio to 3.8799, enhancing meshing smoothness. Experimental noise comparisons validated the theoretical approach, showing a 5 dB noise reduction in improved bevel gears. These findings can guide the design and manufacturing of high-performance bevel gears, ultimately improving the reliability and accuracy of domestic CNC machine tools. Future work could explore advanced materials or lubrication techniques to further suppress noise in bevel gear systems.
To elaborate on the methodology, the reverse engineering process involved several steps. After scanning, the point cloud data was processed using MATLAB algorithms to filter outliers and compute geometric features. For example, the least squares circle fitting method was applied to determine the best-fit circle for tooth profiles, minimizing the sum of squared distances. The error function is:
$$ E = \sum_{i=1}^n \left( \sqrt{(x_i – a)^2 + (y_i – b)^2} – R \right)^2 $$
where \( (a, b) \) is the circle center and \( R \) is the radius. This allowed precise calculation of roundness errors, which were below 0.05 mm for the improved bevel gear, compared to 0.1 mm for the sample. Additionally, the tooth contact analysis (TCA) was simulated using numerical methods to predict meshing behavior. The equations of motion for a bevel gear pair can be expressed as:
$$ I \ddot{\theta} + C \dot{\theta} + K \theta = T(t) $$
where \( I \) is the inertia matrix, \( C \) is the damping matrix, \( K \) is the stiffness matrix, \( \theta \) is the angular displacement, and \( T(t) \) is the torque. For the improved bevel gear, the stiffness matrix \( K \) exhibited fewer variations, leading to lower vibration amplitudes.
The spectral analysis of noise audio involved Fast Fourier Transform (FFT) to convert time-domain signals to frequency-domain. The power spectral density (PSD) was computed as:
$$ \text{PSD}(f) = \frac{1}{T} \left| \int_0^T x(t) e^{-i2\pi ft} dt \right|^2 $$
where \( x(t) \) is the audio signal and \( T \) is the duration. The PSD plots revealed distinct peaks at meshing frequencies and their harmonics. For the sample bevel gear, the meshing frequency \( f_m \) was calculated as:
$$ f_m = \frac{Z \times N}{60} $$
with \( Z \) as tooth count and \( N \) as rotational speed in rpm. At 1000 rpm, \( f_m \) was approximately 317 Hz for the sample (19 teeth) and 483 Hz for the improved (29 teeth), but the noise peaks occurred at higher frequencies due to structural resonances. The improved bevel gear’s spectrum showed attenuated higher harmonics, indicating damped vibrations.
Moreover, the impact of lubrication on bevel gear noise was considered. Although not directly tested, the film thickness in elastohydrodynamic lubrication (EHL) can be estimated using:
$$ h_c = 2.69 R’ \left( \frac{\eta_0 u}{E’ R’} \right)^{0.67} \left( \alpha E’ \right)^{0.53} \left( \frac{W}{E’ R’^2} \right)^{-0.067} $$
where \( h_c \) is central film thickness, \( R’ \) is effective radius, \( \eta_0 \) is dynamic viscosity, \( u \) is rolling speed, \( E’ \) is effective modulus, \( \alpha \) is pressure-viscosity coefficient, and \( W \) is load. Proper lubrication could further reduce friction-induced noise in bevel gears.
In terms of practical implications, this research highlights the need for stringent quality control in bevel gear production. Statistical process control (SPC) charts could monitor key parameters like pitch deviation and tooth thickness. The capability index \( C_pk \) for bevel gear manufacturing should exceed 1.33 for critical applications, defined as:
$$ C_{pk} = \min \left( \frac{\text{USL} – \mu}{3\sigma}, \frac{\mu – \text{LSL}}{3\sigma} \right) $$
where USL and LSL are specification limits, \( \mu \) is mean, and \( \sigma \) is standard deviation. For the improved bevel gear, \( C_{pk} \) values were above 1.5, indicating robust process capability.
Finally, the integration of these bevel gears into CNC turrets requires consideration of system dynamics. The natural frequency of the turret assembly should avoid meshing frequencies to prevent resonance. The natural frequency \( f_n \) can be approximated as:
$$ f_n = \frac{1}{2\pi} \sqrt{\frac{k_{\text{eq}}}{m_{\text{eq}}}} $$
with \( k_{\text{eq}} \) as equivalent stiffness and \( m_{\text{eq}} \) as equivalent mass. By optimizing the bevel gear design, the excitation frequencies are shifted, reducing the risk of resonance. This comprehensive approach ensures that bevel gears contribute to quieter and more reliable machine tool operation, paving the way for advancements in manufacturing technology.