
The reliable operation of mechanical transmission systems is paramount in aerospace and other high-integrity industries. Among these, the bevel gear holds a critical position, particularly in applications requiring the transmission of power between non-parallel intersecting shafts. In helicopter tail drive systems, for instance, bevel gears are indispensable within intermediate and tail gearboxes due to their ability to smoothly transmit high torque while altering the direction of rotation. However, the demanding operational environment makes these components susceptible to various failure modes, such as spalling, cracking, and tooth breakage. Early and accurate detection of such faults is crucial for enhancing system safety, preventing catastrophic failures, and optimizing maintenance schedules through Condition-Based Maintenance (CBM). This necessitates the development of robust health assessment methodologies specifically tailored for the bevel gear.
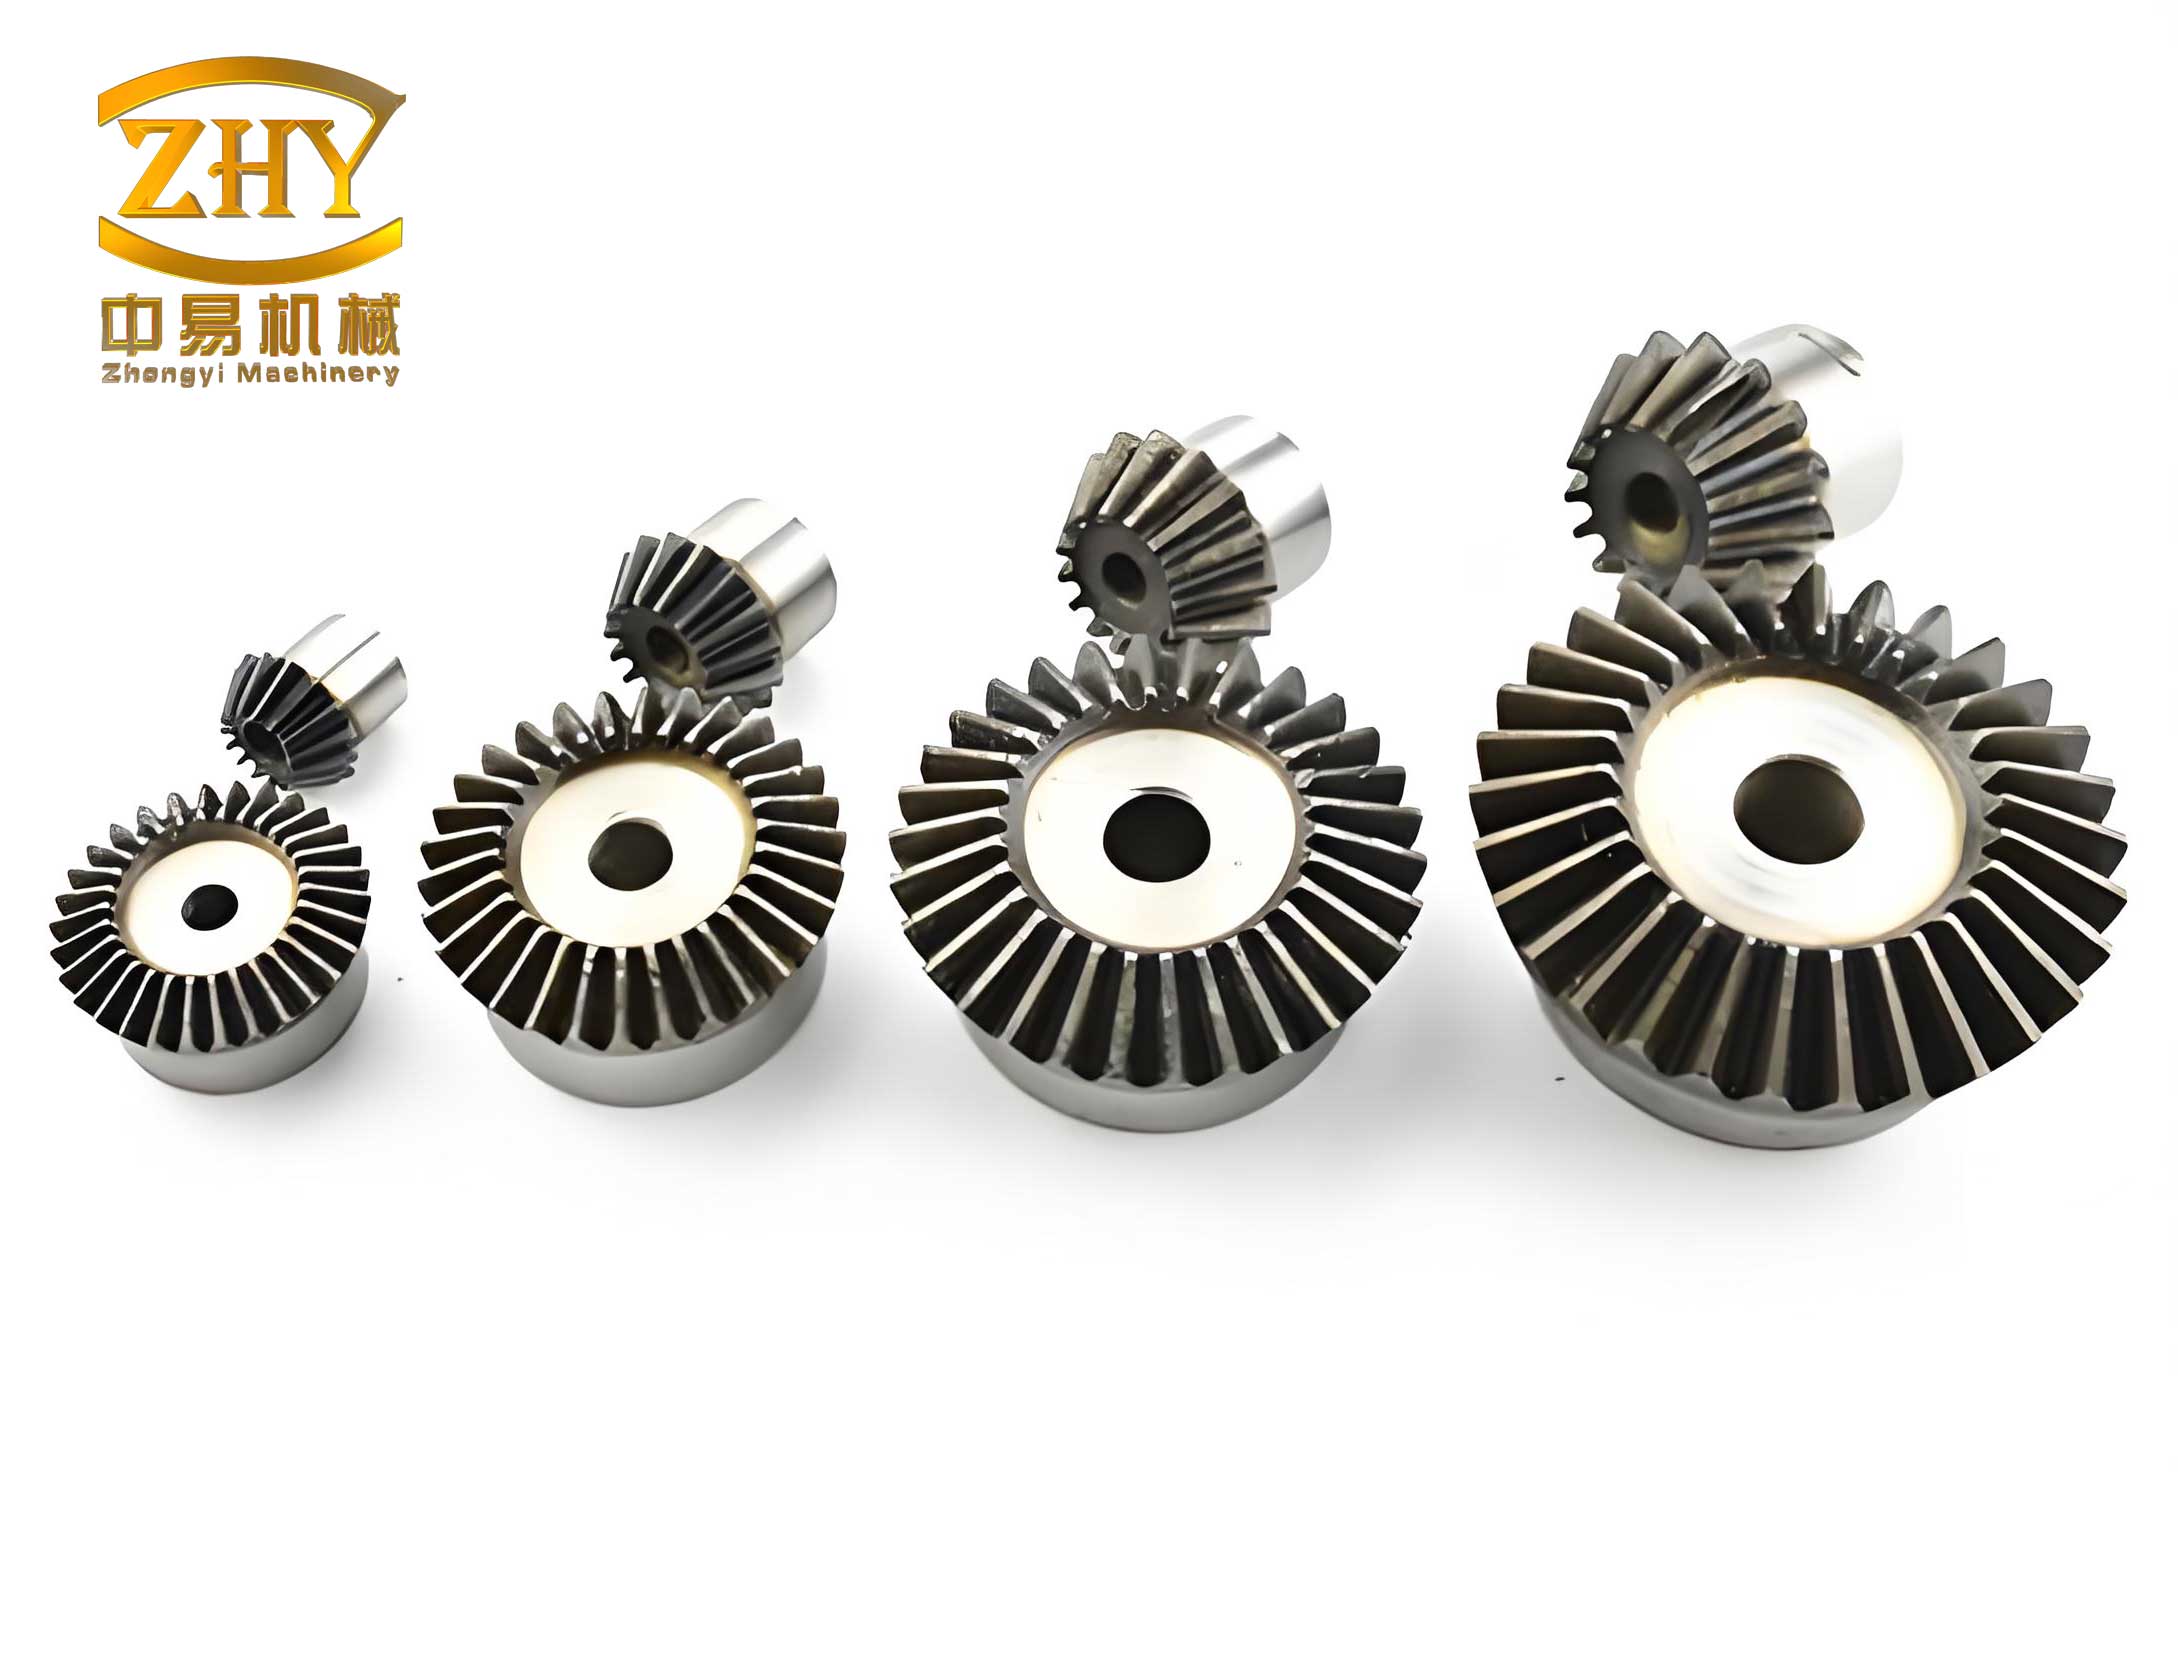
Traditional vibration-based analysis for gear fault diagnosis often relies on techniques in the time-domain, frequency-domain, and time-frequency domain. These methods typically aim to identify changes in the amplitude of gear mesh frequencies, their harmonics, or sidebands related to shaft rotational speeds. While effective, the diagnostic process can be complex and requires significant expertise for signal interpretation. An alternative, complementary strategy involves the use of Health Condition Indicators (HCIs) or Condition Indices (CIs). These are scalar values, often derived from statistical or signal processing operations on vibration data, that quantify specific characteristics of the signal. The underlying premise is that the progression of a fault will alter the vibration signature in a way that is captured by one or more of these indices. For a bevel gear operating in a complex transmission system, the vibration signal measured on the housing is a mixture of contributions from multiple components (gears, bearings, shafts) and is heavily contaminated by background noise. This complicates the direct extraction of sensitive fault features. Therefore, an effective health assessment method must begin with robust signal pre-processing to isolate the signal of interest—the vibration signature of the target bevel gear.
Methodology: From Raw Signal to Diagnostic Indicators
The proposed integrated methodology for bevel gear health assessment consists of two principal stages: (1) signal pre-processing to enhance the signal-to-noise ratio (SNR) and isolate the periodic component of the target bevel gear, and (2) the calculation and evaluation of multiple condition indicators sensitive to different failure modes.
Stage 1: Signal Pre-processing via Time Synchronous Averaging (TSA)
Time Synchronous Averaging is a fundamental technique for extracting periodic waveforms from noisy signals. Its effectiveness is particularly high for rotating machinery like gearboxes, where the vibration signal contains deterministic components synchronized with the shaft rotation. For a bevel gear, the signal of interest is periodic with the gear’s rotational period. The TSA process works by segmenting the original time-domain vibration signal, \( x(t) \), into contiguous blocks, each corresponding to exactly one revolution of the target shaft (and thus the bevel gear of interest). These segments are then averaged point-by-point. Non-synchronous noise and vibrations from other sources tend to average toward zero over many revolutions, while the periodic signal related to the gear reinforces itself.
Mathematically, consider a discretely sampled vibration signal \( x_n = x(n\Delta) \), where \( \Delta \) is the sampling interval. Let the rotational frequency of the target shaft (e.g., the output shaft where the bevel gear is mounted) be \( f_0 \), corresponding to a period \( T = 1/f_0 \). If the signal is divided into \( p \) segments, each containing \( N \) data points (achieved potentially via resampling to ensure each revolution has the same number of points), the Time Synchronously Averaged signal, \( \bar{x}_n \), is given by:
$$ \bar{x}_n = \frac{1}{p} \sum_{k=0}^{p-1} x_{n + kN} $$
where \( n = 0, 1, …, N-1 \). This operation significantly improves the SNR, providing a cleaner signal that predominantly represents the vibration behavior of the target bevel gear over one complete revolution. This “clean” signal, \( \bar{x}_n \), serves as the primary input for the subsequent calculation of condition indicators. It is crucial to obtain an accurate tachometer or encoder signal from the specific shaft associated with the bevel gear under investigation to perform correct TSA.
Stage 2: Definition and Rationale of Multi-Feature Health Indicators
Following TSA processing, a suite of condition indicators is computed. Different indicators are sensitive to different types of signal changes caused by distinct fault mechanisms in a bevel gear. The selection below focuses on proven indicators for gear diagnostics, explaining their formulation and diagnostic rationale. Let \( d_i \) represent the *differential signal*, commonly calculated as the difference between successive points of the TSA signal (\( d_i = \bar{x}_i – \bar{x}_{i-1} \)). This operation tends to accentuate transient impacts caused by localized faults. Let \( N \) be the number of data points in the analyzed signal segment, and \( \bar{d} \) be the mean of the differential signal.
The following table summarizes the key condition indicators used for bevel gear assessment:
| Indicator Name | Formula | Primary Diagnostic Rationale & Sensitivity |
|---|---|---|
| Root Mean Square (RMS) | $$ RMS = \sqrt{ \frac{1}{N} \sum_{i=1}^{N} (\bar{x}_i)^2 } $$ | Measures the overall energy level of the vibration signal. Sensitive to distributed faults or general wear that increase the average vibration magnitude across the entire bevel gear mesh cycle. |
| FM4 (Fourth-Order Moment of the Differential) | $$ FM4 = \frac{ \frac{1}{N} \sum_{i=1}^{N} (d_i – \bar{d})^4 }{ \left( \frac{1}{N} \sum_{i=1}^{N} (d_i – \bar{d})^2 \right)^2 } $$ | Represents the kurtosis of the differential signal. A healthy bevel gear produces a differential signal with a near-Gaussian amplitude distribution (kurtosis ≈ 3). A localized fault like a broken tooth creates large, sparse impacts, leading to a “spikier” distribution and a higher FM4 value. Widespread pitting may flatten the distribution, lowering FM4. |
| M6A (Normalized Sixth-Order Moment) | $$ M6A = \frac{ N^2 \sum_{i=1}^{N} (d_i – \bar{d})^6 }{ \left( \sum_{i=1}^{N} (d_i – \bar{d})^2 \right)^3 } $$ | A higher-order statistical moment. More sensitive than FM4 to the presence of extreme values in the differential signal. Particularly effective for detecting surface-initiated faults like spalling or pitting on a bevel gear tooth, as these faults generate sharp, repetitive impacts. |
| M8A (Normalized Eighth-Order Moment) | $$ M8A = \frac{ N^3 \sum_{i=1}^{N} (d_i – \bar{d})^8 }{ \left( \sum_{i=1}^{N} (d_i – \bar{d})^2 \right)^4 } $$ | An even higher-order moment. Provides enhanced sensitivity to transient events compared to M6A and FM4. Useful for early detection of surface degradation and severe pitting in a bevel gear, as it amplifies the influence of very large amplitude spikes. |
| DA1 (Demodulated Amplitude 1st Order) | $$ DA1 = RMS(\bar{x}_i – \text{mean}(\bar{x}_i)) $$ | Essentially the RMS of the TSA signal after removing its DC offset (mean value). It reflects the energy of the oscillatory part of the gear mesh waveform. Sensitive to changes in the modulation pattern or overall amplitude of the meshing vibration, which can be affected by cracks or misalignment in a bevel gear. |
The core hypothesis of the multi-feature approach is that no single indicator is universally superior for all fault types in a bevel gear. By monitoring a portfolio of indicators, a more comprehensive and reliable diagnostic picture can be formed. For example, a growing root crack in a bevel gear tooth might cause a gradual increase in RMS and DA1 due to changing mesh stiffness, while a sudden tooth breakage would cause a dramatic spike in FM4. Concurrently, surface pitting might be first indicated by a rising trend in M6A and M8A without significantly affecting FM4 or RMS in its early stages.
Case Study: Fault-Seeded Bevel Gear Testing and Analysis
To validate the sensitivity and effectiveness of the proposed multi-indicator approach, a structured fault-seeded test program was conducted. The test article was a 90-degree bevel gear pair, representative of a tail rotor drive system configuration. The driving pinion had 31 teeth, and the driven bevel gear had 28 teeth. The driven gear was the component under test, with various faults artificially introduced.
Experimental Design and Data Acquisition
The test matrix was designed to evaluate the response of the condition indicators to different fault types and severities under varying load conditions. The driven bevel gear test specimens included:
| Fault Type | Description / Severity |
|---|---|
| Baseline | Healthy, undamaged bevel gear. |
| Root Crack | Fatigue crack initiated at the tooth root fillet. Severity levels: 25% and 50% of the tooth depth. |
| Surface Spalling | Localized surface material loss on the tooth flank. Severity levels: 5% and 10% area coverage of a single tooth flank. |
| Tooth Breakage | Partial tooth fracture. Severity levels: Loss of approximately 1/4 and 1/2 of the tooth profile. |
Testing was performed at a constant input shaft speed. The output torque was varied across several levels, from no-load to full-rated load, to simulate different operational conditions. For each combination of bevel gear specimen (health state) and load, vibration data was acquired from accelerometers mounted on the gearbox housing near the output bearing. A tachometer signal from the output shaft was simultaneously recorded to enable precise TSA. Data was collected at a sufficiently high sampling rate for several minutes under each stable operating condition.
Data Processing Protocol
The analysis followed a strict protocol to ensure consistency and comparability of results for the bevel gear under different faults:
| Step | Action | Purpose |
|---|---|---|
| 1. Signal Segmentation | Extract 1-minute of stable vibration data for each test state. | Provides sufficient data for statistical reliability. |
| 2. TSA Processing | Resample data to 256 points per revolution of the output shaft (driven bevel gear). Perform TSA by averaging over 30 consecutive revolutions. Repeat to create 10 independent TSA blocks per test state. | Isolates the periodic vibration signature of the driven bevel gear and drastically reduces asynchronous noise. The 10 blocks provide a basis for statistical analysis of the indicators. |
| 3. Indicator Calculation | For each of the 10 TSA blocks, calculate the five condition indicators: RMS, FM4, M6A, M8A, and DA1. | Generates a distribution of indicator values for each health state of the bevel gear. |
| 4. Comparative Analysis | Plot the calculated indicator values (e.g., as box plots or scatter plots) grouped by bevel gear fault type and severity. Compare the ranges and central tendencies against the baseline healthy state. | Visually and statistically assesses which indicators show significant separation from the healthy state for each specific fault type in the bevel gear. |
Results and Sensitivity Assessment
The analysis of the fault-seeded test data yielded clear patterns regarding the sensitivity of each indicator to specific bevel gear faults:
- RMS and DA1: These indicators showed pronounced sensitivity to crack faults in the bevel gear. The values for cracked gears exhibited clear separation from the healthy baseline and other fault types, with the separation increasing for the deeper (50%) crack. This is consistent with the expected effect of a crack on the mesh stiffness and the resultant vibration energy. Interestingly, these indicators showed significant overlap between healthy, spalled, and broken tooth states, indicating lower diagnostic power for those specific faults.
- FM4: This indicator proved to be specifically sensitive to tooth breakage in the bevel gear. The presence of a broken tooth creates a large, distinct impact once per revolution, leading to a heavily non-Gaussian differential signal and a high FM4 value. Its response to spalling and cracking was minimal, providing good diagnostic discrimination for breakage.
- M6A and M8A: These higher-order moment-based indicators demonstrated excellent sensitivity to surface spalling faults on the bevel gear tooth flanks. Both M6A and M8A values increased significantly for the spalled gears compared to the healthy baseline, with M8A showing a slightly greater dynamic range. They showed little to no response to crack and breakage faults at the tested severities, making them prime candidates for early detection of surface degradation in a bevel gear.
Validation via Blind Test Analysis
A critical step in validating any diagnostic methodology is testing it on “blind” data—data from a test state whose health condition is unknown to the analyst prior to the analysis. In this study, vibration data from an additional, unlabeled test state was processed following the exact same protocol.
The results of the multi-indicator calculation for this blind state were plotted alongside the established reference data from the known healthy and faulty bevel gears. The observed pattern was striking: the values for M6A, M8A, and FM4 for the blind state fell squarely within the range of the healthy bevel gear data. However, the values for RMS and DA1 were elevated and aligned closely with the data cluster associated with cracked bevel gears, particularly the shallower crack fault. Based on the previously established sensitivity profiles, the diagnostic conclusion was that the blind-state bevel gear likely contained a root crack. This prediction was later confirmed, successfully validating the diagnostic logic and the effectiveness of the multi-feature indicator approach for bevel gear health assessment.
Discussion and Implementation Strategy
The case study clearly illustrates the complementary nature of different condition indicators. Relying solely on a common indicator like RMS could lead to missed diagnoses for faults like early-stage spalling or even tooth breakage under certain conditions, as its sensitivity is not universal. The integrated use of a feature set provides diagnostic redundancy and specificity.
For practical implementation in monitoring a helicopter tail drive bevel gear or similar critical component, the following strategy is recommended:
- Establish a Baseline: Under known healthy conditions and across a range of operational loads and speeds, collect vibration data and compute the suite of indicators (RMS, FM4, M6A, M8A, DA1) following the TSA pre-processing step. Define statistical thresholds (e.g., mean ± 3 standard deviations) for each indicator under each major operating regime.
- Continuous or Periodic Monitoring: During operation, collect vibration and tachometer data. Apply the TSA algorithm synchronized to the shaft of the target bevel gear.
- Feature Extraction & Health Evaluation: Calculate the condition indicators from the TSA signal. Compare them against the established healthy baselines for the current operating regime.
- Diagnostic Logic: Employ a simple rule-based or more advanced data-driven (e.g., fuzzy logic, neural network) system to interpret the ensemble of indicator deviations. For instance:
Observed Indicator Deviation Pattern Inferred Bevel Gear Condition Significant rise in M6A and/or M8A, other indicators normal. Potential surface-initiated fault (spalling, pitting). Significant rise in RMS and DA1, FM4/M6A/M8A normal. Potential distributed wear or crack development. Sharp rise in FM4, possible rise in RMS/DA1. Potential localized damage like a broken tooth or severe spall. Rise in all indicators. Severe, advanced fault condition.
The incorporation of TSA is non-negotiable for bevel gear assessment in complex gearboxes. Without it, the weak fault signatures are often masked by overwhelming noise and other vibration sources, rendering even sophisticated indicators ineffective. The TSA step acts as a powerful spatial filter, focusing the analysis precisely on the component of interest.
Conclusion
This article has presented an integrated methodology for the health condition assessment of bevel gears, a critical component in many power transmission systems. The method’s strength lies in the synergistic combination of robust signal pre-processing and a multi-feature indicator analysis. Time Synchronous Averaging is essential for isolating the clean, periodic vibration signature of the target bevel gear from a noisy mixture. Subsequently, a carefully selected portfolio of condition indicators—RMS, FM4, M6A, M8A, and DA1—is computed. Experimental results from a structured fault-seeded test program demonstrate that these indicators possess distinct and complementary sensitivities: M6A and M8A are highly sensitive to surface spalling faults, RMS and DA1 are effective for detecting crack-related faults, and FM4 is particularly responsive to tooth breakage events in a bevel gear.
The successful diagnosis of a blind test case validates the practical efficacy of this approach. For engineers and maintenance professionals tasked with ensuring the reliability of systems employing bevel gears, adopting such a multi-indicator framework, underpinned by proper signal conditioning like TSA, provides a powerful, reliable, and actionable tool for early fault detection, fault type discrimination, and informed maintenance decision-making, ultimately enhancing system safety and availability.