
The quality of the tooth surface is a paramount indicator of the meshing and transmission performance of bevel gears, which are critical components widely employed in aviation, aerospace, automotive, and heavy machinery transmissions. Traditional quality assessment of bevel gears often relies heavily on a precise theoretical mathematical model of the tooth surface. Constructing this model is inherently complex as it depends not only on the design parameters of the bevel gear but also on specific machine-tool adjustment parameters used during its manufacturing. In many practical industrial scenarios, obtaining these precise process parameters can be challenging or even impossible, rendering the theoretical modeling approach infeasible. This paper addresses this issue by investigating and presenting a relative evaluation methodology. This method circumvents the need for an absolute theoretical datum by utilizing a high-quality physical gear from the same production batch as a reference, thereby facilitating quality assessment and process stability monitoring.
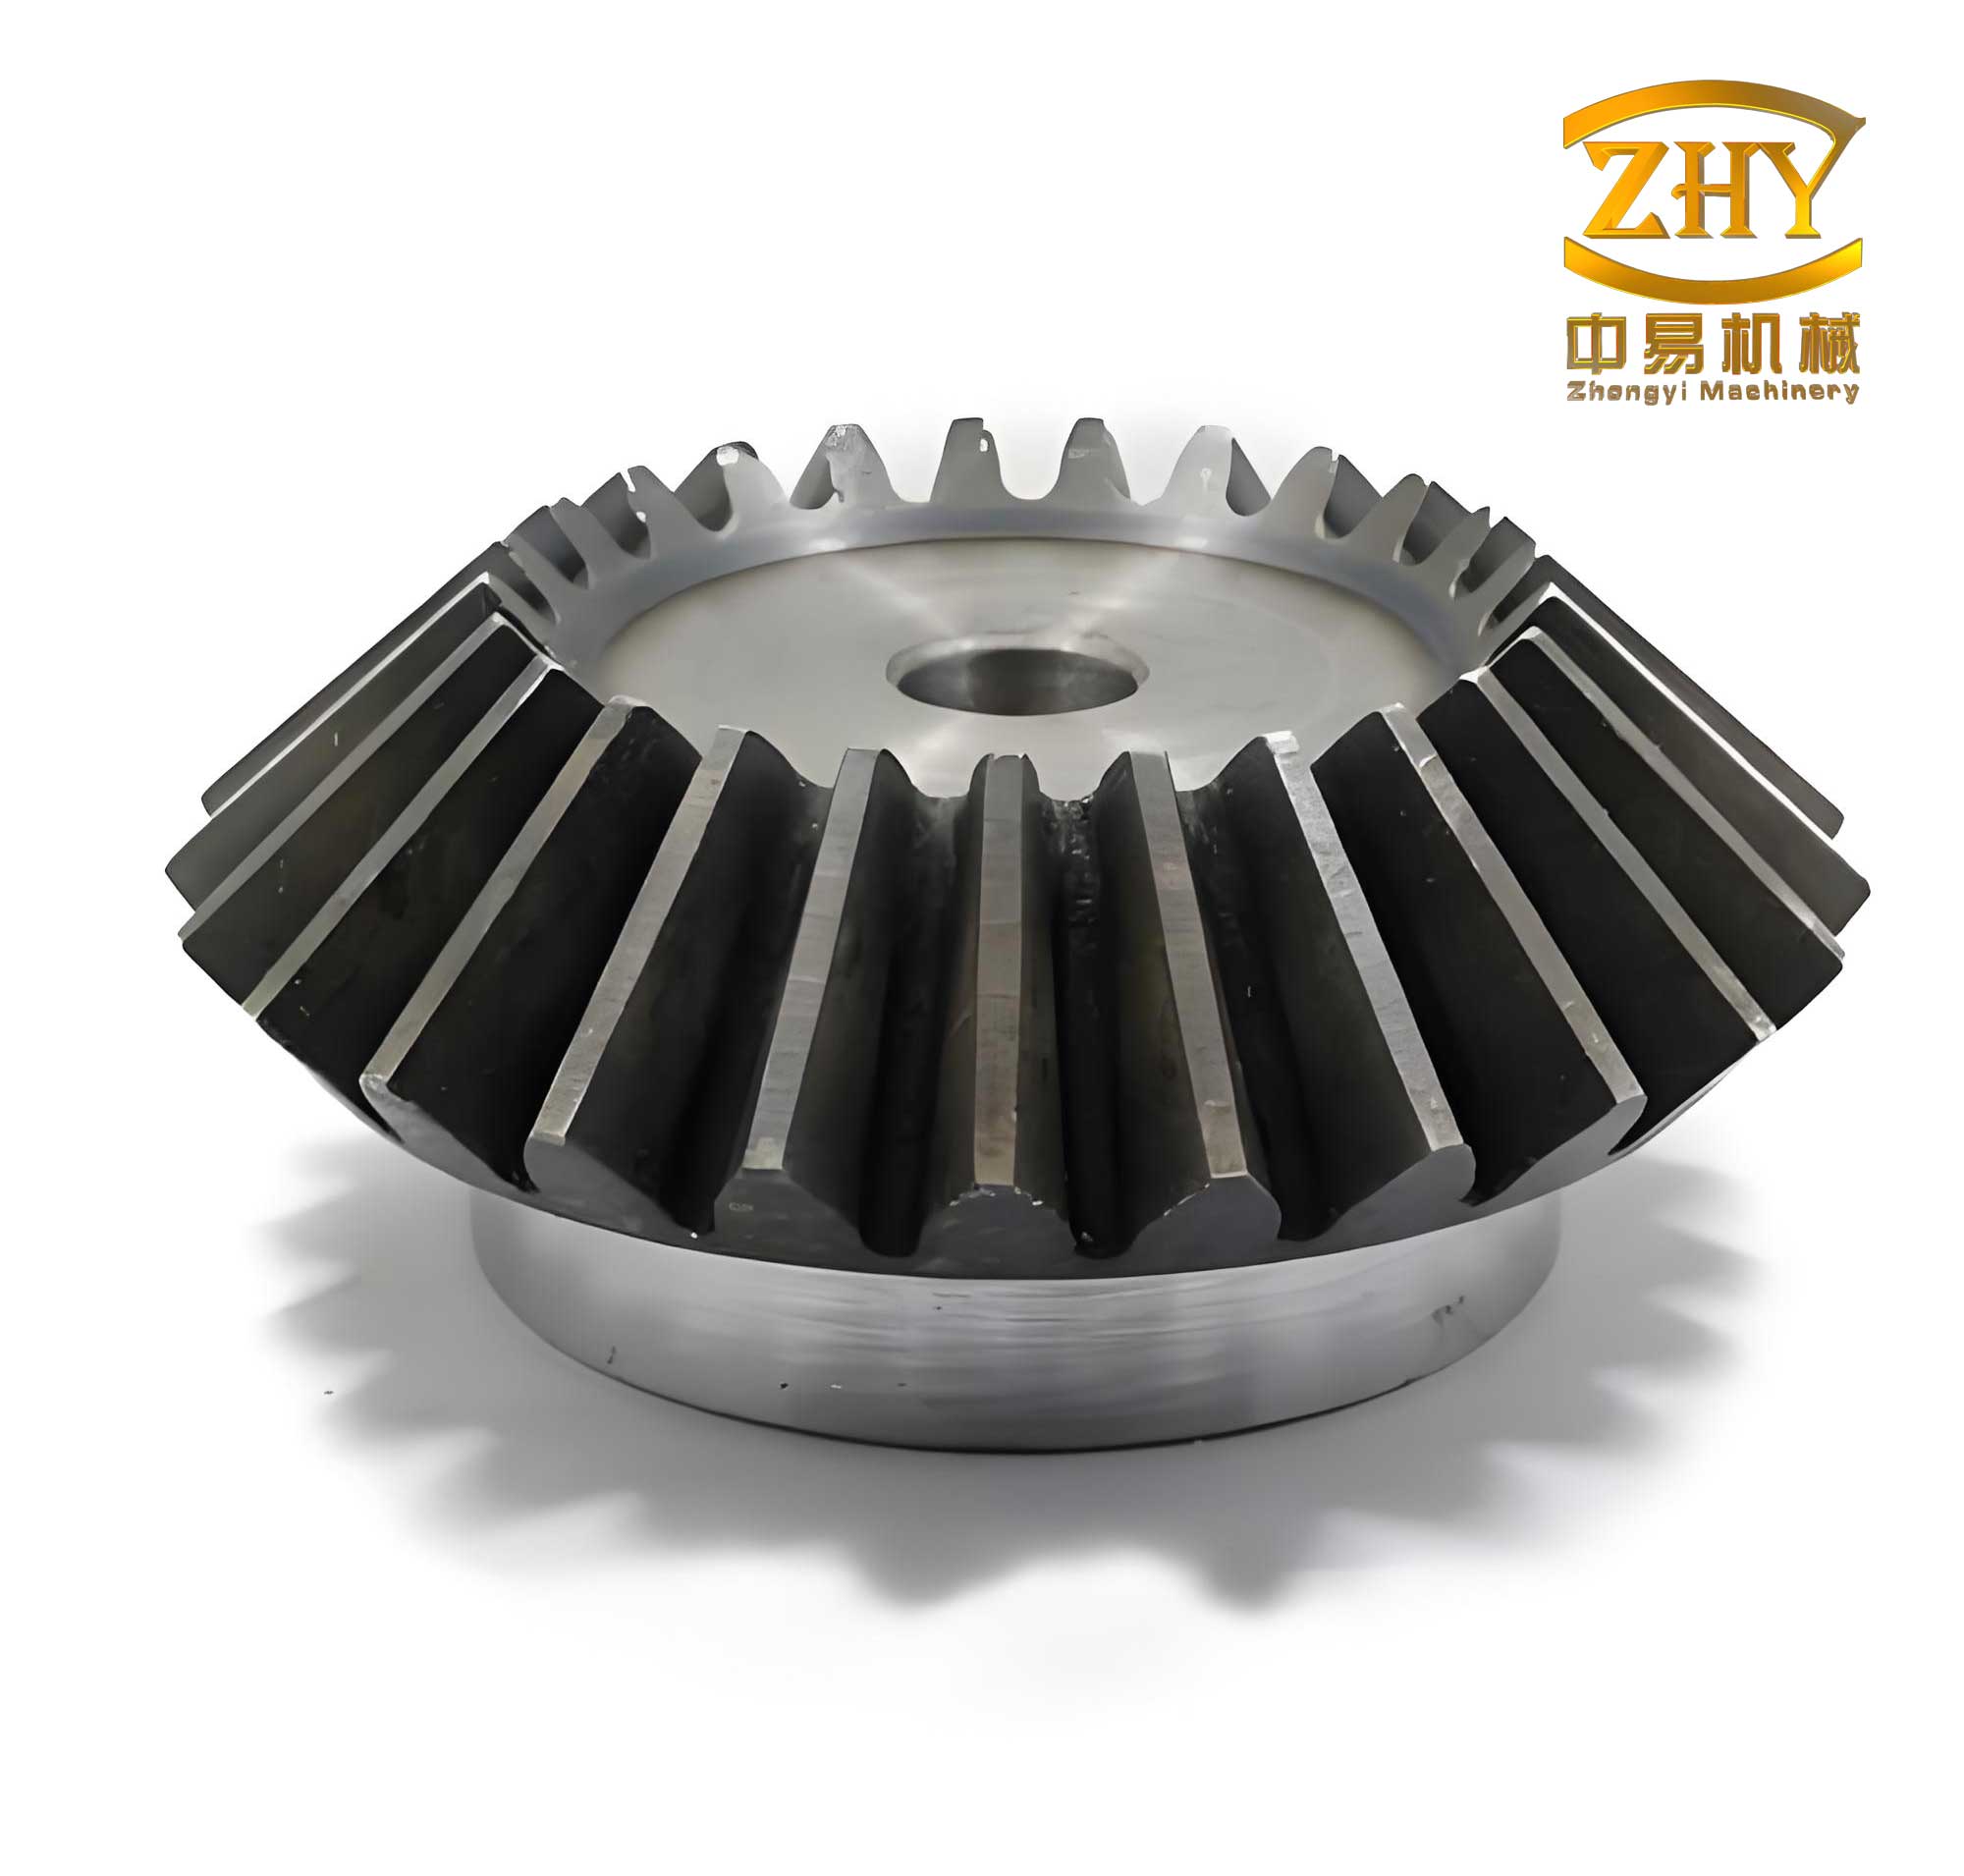
Conventional measurement of bevel gears, such as on dedicated gear measuring centers, typically involves contact probing at a sparse, predefined grid of points (e.g., 45 points per flank). This method is time-consuming and captures limited information about the complete topography of the tooth surface. The advent and integration of optical measurement technologies, such as structured light scanning, have revolutionized gear metrology. These systems can rapidly acquire dense, three-dimensional point clouds representing the entire tooth surface geometry, providing a vastly richer dataset for analysis. However, the analysis of this dense point cloud still requires a datum for comparison. When the theoretical model is unavailable, a relative comparison against a master artifact becomes a logical and practical solution. This approach not only evaluates the conformance of individual bevel gears but also implicitly reflects the stability and consistency of the manufacturing process across a production batch.
Theoretical Foundation of the Relative Method
Mathematical Representation of the Bevel Gear Tooth Surface
To establish a foundation, we first consider the mathematical description of a bevel gear tooth surface. A three-dimensional coordinate system is attached to the bevel gear. Let the $z$-axis coincide with the rotational axis of the gear. The $xOy$ plane is perpendicular to the $z$-axis and coincides with the plane of the gear’s back face (larger end). The origin $O$ is located at the intersection of the $z$-axis and this back face plane. In an ideal scenario with known parameters, the theoretical tooth surface can be represented as a continuous vector function:
$$ \Sigma: \mathbf{r}(u, v) $$
where $u$ and $v$ are the surface parameters, often related to the radial and lengthwise directions on the tooth flank, respectively.
Establishing the Datum Tooth Surface
The core of the relative method lies in defining a datum not from theory, but from a physical bevel gear deemed to be of high quality from within the same manufacturing lot. This gear is designated as the “datum gear.”
The three-dimensional point cloud data acquired from the datum gear’s tooth flanks must be organized into a structured digital model. We define a special U-V-W coordinate system for this purpose, as illustrated below:
- U Direction: Oriented from the tooth root towards the tooth tip.
- V Direction: Oriented from the gear’s large end (heel) towards the small end (toe).
- W Direction: Represents the index or sequence number of each tooth around the gear’s circumference.
After digitization, the point cloud for all teeth on the same flank (e.g., all convex sides) can be represented as a structured three-dimensional array. Let $i, j, k$ be the indices along the $U$, $V$, and $W$ directions, respectively, with $i = \{1, 2, …, m\}$, $j = \{1, 2, …, n\}$, $k = \{1, 2, …, l\}$. The point at coordinate $(i, j, k)$ is denoted as $\mathbf{p}_{i,j,k}$. The complete dataset for the datum gear’s flanks is:
$$ \Sigma_{0}: \mathbf{P}_{0}(i, j, k) = \{\{ \mathbf{p}_{1,1,1}, \mathbf{p}_{2,1,1}, …, \mathbf{p}_{m,1,1} \}, …, \{ \mathbf{p}_{1,n,l}, \mathbf{p}_{2,n,l}, …, \mathbf{p}_{m,n,l} \}\} $$
To create a single, average datum tooth surface that represents the nominal form for this batch, the points from all $l$ teeth are averaged. The resulting datum point cloud is:
$$ \Sigma_{ref}: \mathbf{P}_{ref}(i, j) = \frac{1}{l} \sum_{k=1}^{l} \mathbf{P}_{0}(i, j, k) $$
This discrete point set $\mathbf{P}_{ref}(i, j)$ is then interpolated and smoothed using a Non-Uniform Rational B-Spline (NURBS) surface fitting algorithm to create a continuous mathematical representation of the datum surface. A NURBS surface of degree $p$ in the $u$-direction and degree $q$ in the $v$-direction is defined by:
$$ \Sigma_{NURBS}: \mathbf{S}(u,v) = \frac{\sum_{i=0}^{n} \sum_{j=0}^{m} N_{i,p}(u) N_{j,q}(v) w_{i,j} \mathbf{d}_{i,j}}{\sum_{i=0}^{n} \sum_{j=0}^{m} N_{i,p}(u) N_{j,q}(v) w_{i,j}} $$
where $\mathbf{d}_{i,j}$ are the control points, $w_{i,j}$ are the weights, and $N_{i,p}(u)$ and $N_{j,q}(v)$ are the B-spline basis functions. From this surface model $\mathbf{S}(u,v)$, the unit normal vector $\mathbf{n}_p$ at any point $\mathbf{p}$ on the datum surface can be calculated as:
$$ \mathbf{n}_p(u,v) = \frac{\frac{\partial \mathbf{S}}{\partial u} \times \frac{\partial \mathbf{S}}{\partial v}}{\left\| \frac{\partial \mathbf{S}}{\partial u} \times \frac{\partial \mathbf{S}}{\partial v} \right\|} $$
The direction of this normal is defined to point from the datum surface towards the material side of the actual gear being measured.
Relative Assessment Principle
Subsequently, an actual production bevel gear from the same batch is measured using the same optical system, yielding its own dense point cloud for each tooth flank:
$$ \Sigma_{act}: \mathbf{P}_{act}(i, j, k) = \{\{ \mathbf{p}_{act;1,1,1}, \mathbf{p}_{act;2,1,1}, …, \mathbf{p}_{act;m,1,1} \}, …, \{ \mathbf{p}_{act;1,n,l}, \mathbf{p}_{act;2,n,l}, …, \mathbf{p}_{act;m,n,l} \}\} $$
For assessment, the point cloud of the actual bevel gear is algorithmically aligned and registered to the coordinate system of the datum surface. The fundamental concept is to compare each measured point $\mathbf{p}_{act}$ from the actual bevel gear to the corresponding location on the continuous datum surface $\mathbf{S}(u,v)$. The deviation is calculated along the normal direction of the datum surface at that corresponding point. The relationship is given by the vector equation:
$$ \mathbf{p}_{act} = \mathbf{p}_{ref} + d_{norm} \cdot \mathbf{n}_p $$
where $\mathbf{p}_{ref}$ is the point on the datum surface corresponding to $\mathbf{p}_{act}$, and $\mathbf{n}_p$ is the unit normal vector at $\mathbf{p}_{ref}$. The scalar signed distance $d_{norm}$ is the normal deviation. Therefore, the deviation can be computed as:
$$ d_{norm} = (\mathbf{p}_{act} – \mathbf{p}_{ref}) \cdot \mathbf{n}_p = F(\mathbf{S}(u,v), \mathbf{p}_{act}) $$
This calculation is performed for the hundreds of thousands or millions of points in the measurement cloud, generating a full-field topographic deviation map for each tooth flank of the bevel gear. The statistical summary (maximum, minimum, mean, standard deviation) of these $d_{norm}$ values provides a quantitative assessment of the gear’s quality relative to the chosen datum bevel gear.
| Aspect | Traditional Theoretical Method | Proposed Relative Method |
|---|---|---|
| Datum Source | Mathematical model from design & machine settings | Physical master gear from the same production batch |
| Data Density | Sparse grid (e.g., 45 points/flank) | Dense 3D point cloud (e.g., millions of points/flank) |
| Key Challenge | Requires exact, often unavailable, process parameters | Requires selection of a high-quality master gear |
| Primary Output | Deviation from theoretical design | Deviation from batch master (process consistency) |
| Additional Benefit | Design validation | In-process stability monitoring |
Three-Dimensional Measurement System for Bevel Gears
The practical implementation of the relative method necessitates a system capable of capturing high-density 3D geometry of bevel gear teeth. A hybrid measurement system integrating a precision coordinate measurement framework with a non-contact optical sensor is ideal.
The experimental setup typically consists of a high-precision rotary axis (C-axis) on which the bevel gear is mounted. A line-structured light sensor is mounted on a multi-axis translation stage (e.g., X, Y, Z linear axes) allowing precise positioning relative to the gear. The line laser projector and camera of the sensor are fixed relative to each other. During measurement, the gear rotates step-by-step or continuously. At each angular position, the sensor is triggered to capture the profile line where the laser stripe intersects the tooth surface. By synchronizing the rotary motion with the sensor capture, profiles from multiple sections of the tooth are recorded, which are then merged in software to form a complete 3D point cloud of the tooth flank.
The coordinate transformation is crucial. Several coordinate systems are defined:
- Gear Coordinate System ($O_g – X_gY_gZ_g$): $Z_g$ coincides with the gear axis. It rotates with the gear.
- World Coordinate System ($O_0 – X_0Y_0Z_0$): Fixed system, with $Z_0$ aligned to the machine rotary axis. Often coincides with the gear system at a home position.
- Sensor Coordinate System ($O_s – X_sY_sZ_s$): Fixed to the laser sensor. $X_sO_sY_s$ plane is typically parallel to the laser plane.
A point $\mathbf{P_s} = (x_s, y_s, z_s)^T$ measured in the sensor coordinates is transformed into the fixed gear coordinate system through a series of homogeneous transformations:
$$ \mathbf{P_g} = ^g\mathbf{T}_c(\phi) \cdot ^c\mathbf{T}_0 \cdot ^0\mathbf{T}_s(\alpha, \beta, \gamma, t_x, t_y, t_z) \cdot \mathbf{P_s} $$
Where $^g\mathbf{T}_c(\phi)$ is the transformation from a carriage system (C) to the gear system, dependent on the gear rotation angle $\phi$. $^c\mathbf{T}_0$ is the fixed transformation from world to carriage. $^0\mathbf{T}_s$ is the transformation from sensor to world, defined by the sensor’s orientation angles ($\alpha, \beta, \gamma$, rotations about X, Y, Z) and positional offsets ($t_x, t_y, t_z$). This equation succinctly represents the measurement model: $\mathbf{P_g} = f(\phi, \mathbf{P_s}, \mathbf{\Theta})$, where $\mathbf{\Theta}$ encapsulates all sensor extrinsic calibration parameters.
| System Component / Parameter | Typical Specification / Value |
|---|---|
| Structured Light Sensor | e.g., 2D CMOS camera with line laser |
| Stand-off Distance | ~60 mm |
| Measurement Width (X) | ~15 mm |
| Measurement Depth (Z) | ±8 mm |
| Point Resolution / Repeatability | Sub-micron level (e.g., 0.4 µm) |
| Bevel Gear Specimen | |
| Number of Teeth | 9 |
| Module | 3.877 mm |
| Spiral Angle | 46.5° |
| Motion Axes | Rotary (C) for gear, Linear (X,Y,Z) for sensor |
| Key Math | Coordinate transform: $\mathbf{P_g} = ^g\mathbf{T}_c(\phi) \cdot ^c\mathbf{T}_0 \cdot ^0\mathbf{T}_s \cdot \mathbf{P_s}$ |
Experimental Verification and Analysis
Acquisition of the Datum Tooth Surface
A high-quality bevel gear from a production batch was selected as the datum gear. Its convex tooth flanks were measured using the described 3D optical system. The raw point cloud for all 9 teeth was captured, resulting in several million data points. This raw data was then processed: noise and outliers were filtered, and points corresponding to the active evaluation area of the tooth flank (excluding the very tip and root regions) were extracted. The point clouds from all teeth on the convex side were then averaged according to Equation $\mathbf{P}_{ref}(i, j) = \frac{1}{l} \sum_{k=1}^{l} \mathbf{P}_{0}(i, j, k)$ to create a single, representative point cloud for the datum convex flank. This averaged point set was subsequently modeled using a NURBS surface to create the continuous digital master $\mathbf{S}(u,v)$.
Measurement of Test Bevel Gears
Separate bevel gears from the same manufacturing batch were then measured using the identical system setup and measurement sequence. For each test bevel gear, the raw 3D point cloud of its convex flanks was acquired. The same data preprocessing steps (filtering, evaluation area extraction) were applied to ensure consistency. The result was a clean, dense point cloud $\mathbf{P}_{act}(i, j, k)$ for each gear under test, ready for comparison with the datum surface.
Deviation Calculation and Result Analysis
For each point $\mathbf{p}_{act}$ in the measured point cloud of a test bevel gear, the corresponding point $\mathbf{p}_{ref}$ on the NURBS datum surface $\mathbf{S}(u,v)$ was found via closest-point projection or parameter association. The normal deviation $d_{norm}$ was calculated using $d_{norm} = (\mathbf{p}_{act} – \mathbf{p}_{ref}) \cdot \mathbf{n}_p$. This process generated a full-field deviation map for each tooth flank. The results for one sample flank are visualized as a color-coded map on a 2D projection (unwrapped view), showing deviations typically within a range of a few micrometers. For instance, one gear exhibited a maximum positive deviation (material excess relative to datum) of +2.166 µm and a maximum negative deviation (material deficiency) of -2.284 µm.
To assess batch consistency, five bevel gears from the same batch were randomly selected and evaluated against the same datum gear. The summary statistics of their normal deviations are presented in the table below. The relatively small and consistent range of maximum and minimum deviations across the five samples indicates a stable manufacturing process for this batch of bevel gears. The relative method successfully highlights this consistency.
| Bevel Gear Sample | Max Normal Deviation (µm) | Min Normal Deviation (µm) |
|---|---|---|
| Gear 1 | +2.026 | -3.105 |
| Gear 2 | +2.146 | -2.057 |
| Gear 3 | +2.441 | -2.295 |
| Gear 4 | +2.555 | -2.209 |
| Gear 5 | +2.496 | -1.634 |
Conclusion
This paper has detailed a practical and effective relative evaluation method for assessing the three-dimensional quality of bevel gears, specifically addressing the common industrial challenge of missing precise theoretical manufacturing parameters. The method strategically uses a high-quality physical bevel gear from the production batch as a master reference. By combining this with dense 3D optical metrology, a complete topographic comparison is enabled. The core calculation, $d_{norm} = (\mathbf{p}_{act} – \mathbf{p}_{ref}) \cdot \mathbf{n}_p$, provides a direct measure of form deviation relative to the batch master.
The experimental validation confirms the method’s viability. It successfully generates detailed deviation maps for individual bevel gears and, when applied to multiple gears from a batch, provides clear insight into the stability of the production process. This approach overcomes the significant limitations of traditional sparse-point contact measurement and the dependency on complex theoretical bevel gear models. Future work will focus on extending the method to simultaneously acquire and evaluate both flanks (concave and convex) of the bevel gear across the full face width, providing an even more comprehensive assessment of overall gear quality and manufacturing process capability.