
In the realm of aero-engine design and maintenance, the central bevel gear stands as a critical component, responsible for transmitting rotational power from the engine core to various accessory units. These bevel gears operate under extreme conditions—high temperatures, substantial rotational speeds, and fluctuating loads—which can precipitate dynamic phenomena such as traveling wave resonance. This resonance, if unchecked, may lead to catastrophic failure modes like gear tooth fracture. Traditional design approaches often treat bevel gears as rigid bodies, focusing on static strength and fatigue life, but this overlooks the complex vibrational dynamics that arise in service. Consequently, a thorough understanding of the acoustic and vibration characteristics of bevel gears is paramount for ensuring reliability and safety. In this study, I delve into an experimental methodology that leverages acoustic measurement techniques to capture and analyze the vibrational behavior of bevel gears, offering a non-intrusive and highly sensitive alternative to conventional strain-gauge methods.
The core principle underpinning this investigation is the relationship between gear meshing dynamics and the resulting acoustic emissions. When bevel gears engage, their interaction generates vibrations that propagate as sound waves. By examining the acoustic signature, one can infer the vibrational state of the gears. The fundamental vibration equation for a gear pair can be simplified to represent the motion along the line of action:
$$m\ddot{x} + c\dot{x} + k(t)x = F_0 + k(t)e(t)$$
Here, \(x\) denotes the relative displacement along the meshing line, \(m\) is the equivalent mass of the gear pair, \(c\) represents the damping coefficient, \(k(t)\) is the time-varying meshing stiffness, \(F_0\) is the constant external load, and \(e(t)\) accounts for gear errors. For ideally manufactured bevel gears with uniform tooth spacing and under steady load, the primary vibration is driven by stiffness variations, leading to a harmonic series centered around the meshing frequency \(f_Z\):
$$x(t) = \sum_{n=1}^{N} X_n \cos(2\pi n f_Z t + \phi_n)$$
where \(X_n\) and \(\phi_n\) are the amplitude and phase of the \(n\)-th harmonic, respectively. The corresponding acoustic pressure at a point in the sound field, represented in terms of power spectral density, emphasizes these meshing frequency components:
$$|p(f)|^2 = \sum_{n=1}^{N} p_n^2 \delta(f – n f_Z)$$
This equation indicates that the acoustic power spectrum is dominated by the meshing frequency and its harmonics. Crucially, variations in the amplitude of these components can signal different vibrational modes. Specifically, peaks at the meshing frequency correspond to bending (traveling wave) and torsional vibrations of the bevel gears. When the excitation frequency aligns with a natural frequency of a particular nodal diameter mode, traveling wave resonance occurs, manifesting as pronounced amplitude increases in the acoustic spectrum.
Furthermore, early-stage faults in bevel gears, such as pitting, cracks, or wear, introduce modulation effects. The vibration signal becomes modulated in both amplitude and phase, which in the acoustic domain generates sidebands around the meshing frequency harmonics. The modulated signal can be expressed as:
$$x(t) = \sum_{n=1}^{N} X_n[1 + a_n(t)] \cos[2\pi n f_Z t + \phi_n + b_n(t)]$$
where \(a_n(t)\) and \(b_n(t)\) are amplitude and phase modulation functions. In the frequency domain, this results in sidebands at frequencies \(f_s = i f_Z \pm j f_r\), where \(f_r\) is the rotational frequency of the gear. Analyzing these sidebands provides diagnostic insights into the health of the bevel gears, allowing for the detection of incipient faults before they escalate.
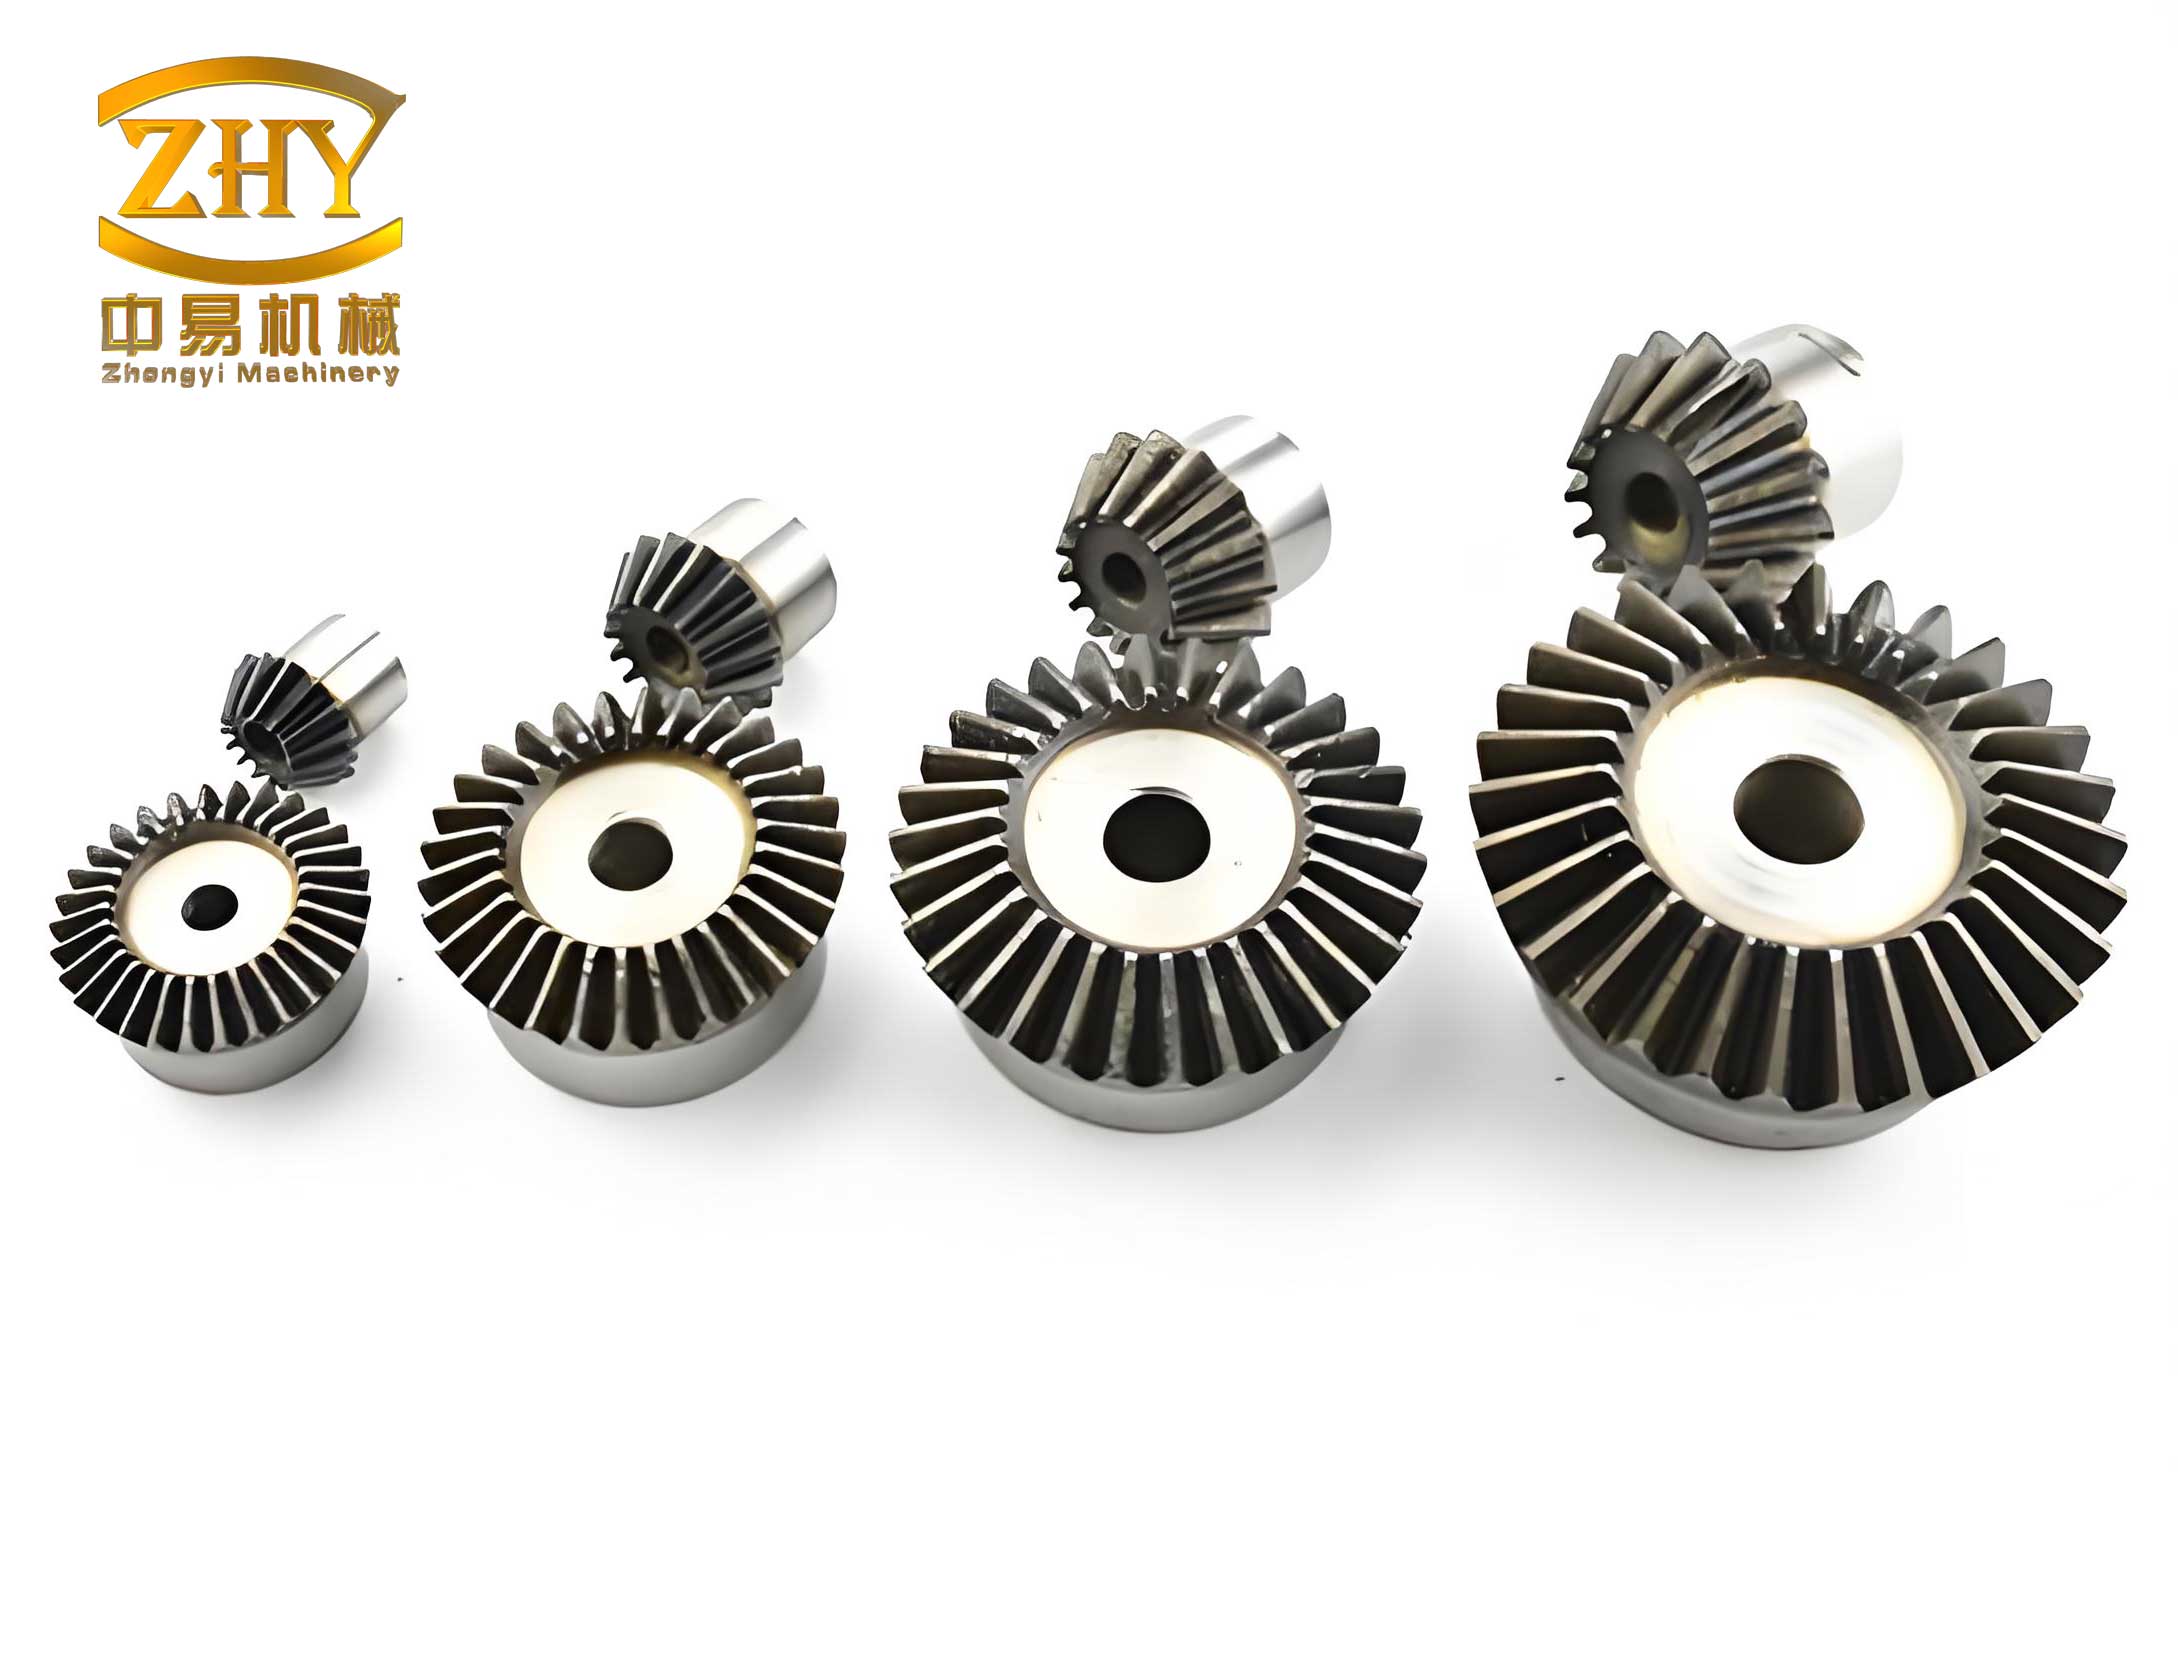
To empirically study these acoustic and vibration characteristics, a comprehensive test was conducted on a central bevel gear assembly from an aero-engine. The test rig simulated actual operating conditions, incorporating axial and radial loaders to mimic bearing forces, and included all relevant engine and aircraft accessories. The bevel gears in question featured a driven wheel capable of reaching up to 21,000 rpm, with the driving wheel having 51 teeth and the driven wheel 38 teeth. This configuration is typical for such central bevel gears, which must efficiently transfer power while minimizing dynamic instabilities.
Two primary measurement techniques were employed: dynamic strain gauging and acoustic sensing via waveguides. For strain measurement, a total of 30 strain gauges were strategically attached to both the driving and driven bevel gears to capture stress variations during operation. However, given the challenging environment—narrow oil spaces and high frequencies—the longevity and fidelity of strain gauges can be limited. Therefore, acoustic measurement using waveguides was implemented as a complementary, non-contact method. Waveguides were installed on the gearbox housing at two symmetric points to capture the original air-borne noise generated by the meshing bevel gears. The setup utilized 0.635 cm (1/4 inch) pre-polarized free-field microphones with a frequency response of 4 Hz to 70 kHz, connected to a DEWESOFT data acquisition system sampling at 200 kHz. This configuration ensured high-fidelity capture of the acoustic emissions from the bevel gears across the entire operational range.
The experimental procedure involved sweep tests across the driven wheel’s speed range, along with tests under various loading conditions. The acoustic data were analyzed to extract overall sound pressure levels, frequency spectra, and Campbell diagrams. The Campbell diagram, in particular, is instrumental in visualizing how frequency components evolve with rotational speed, enabling the identification of resonance conditions. For the bevel gears tested, the overall sound pressure level generally increased with speed, but notable peaks were observed at specific speeds, suggesting resonant events.
A detailed analysis of the meshing frequency amplitude variations revealed critical insights into the traveling wave resonance behavior of the bevel gears. The table below summarizes the peak sound pressure levels at the meshing frequency for various driven wheel speeds:
| Driven Wheel Speed (rpm) | Meshing Frequency (Hz) | Sound Pressure Level (dB) |
|---|---|---|
| 5,500 | 3,483 | 129 |
| 6,000 | 3,802 | 132 |
| 9,450 | 5,987 | 120 |
| 10,550 | 6,683 | 121 |
| 12,050 | 7,631 | 120 |
| 14,500 | 9,217 | 125 |
| 15,650 | 9,913 | 120 |
| 19,850 | 12,576 | 122 |
These peaks correspond to instances where the meshing frequency coincides with natural frequencies of the bevel gears, exciting traveling wave resonances. To validate this, dynamic strain measurements were compared. The strain data indicated resonance peaks at similar speeds, attributed to specific nodal diameter modes. For instance, at 5,500 rpm, a backward traveling wave of the 2nd nodal diameter was excited, while at 6,000 rpm, a forward traveling wave of the same mode occurred. The relationship between resonance frequency \(f_z^{\wedge}\), natural frequency \(f_m\), and rotational frequency \(f_r\) is given by:
$$f_z^{\wedge} = f_m \pm m f_r$$
where the plus sign denotes forward traveling waves and the minus sign backward traveling waves. Using this formula, the calculated excitation frequencies were compared with the acoustic meshing frequencies, as shown below:
| Strain Peak Speed (rpm) | Calculated \(f_z^{\wedge}\) (Hz) | Acoustic Meshing Frequency (Hz) | Frequency Error (%) |
|---|---|---|---|
| 5,500 | 3,481 | 3,483 | 0.06 |
| 6,000 | 3,860 | 3,802 | 1.53 |
| 11,960 | 7,574 | 7,631 | 0.74 |
| 13,960 | 8,841 | 9,217 | 4.10 |
| 19,693 | 12,774 | 12,576 | 1.57 |
The close agreement, with errors generally below 5%, confirms that acoustic measurements accurately capture the traveling wave resonance phenomena in these bevel gears. Moreover, additional peaks in the acoustic data at driven wheel speeds of 9,450 rpm, 10,550 rpm, and 15,650 rpm were linked to resonances of the driving bevel gear. For example, at a driving wheel speed of 7,041 rpm (corresponding to 9,450 rpm on the driven wheel), a backward traveling wave of the 2nd nodal diameter was excited. The comparison with design calculations further validates this:
| Driving Wheel Speed (rpm) | Acoustic Meshing Frequency (Hz) | Design Calculated Speed (rpm) | Calculated Frequency (Hz) | Frequency Error (%) |
|---|---|---|---|---|
| 7,041 | 5,987 | 7,206 (Backward 2nd) | 6,125 | 2.3 |
| 7,861 | 6,683 | 7,794 (Forward 2nd) | 6,624 | 0.8 |
| 11,661 | 9,913 | 12,262 (Forward 4th) | 10,422 | 5.0 |
This comprehensive analysis demonstrates that the acoustic signature not only reflects the driven bevel gear’s resonances but also those of the driving bevel gear, providing a holistic view of the system’s dynamic behavior.
Beyond resonance identification, the acoustic data revealed rich sideband structures, particularly in the speed range of 12,000 to 17,000 rpm. These sidebands are indicative of modulation effects caused by gear faults. Envelope analysis of the acoustic signal at 16,000 rpm, for instance, showed distinct sidebands around the meshing frequency, modulated by the driving wheel’s rotational frequency. The presence of such sidebands aligns with typical symptoms of surface pitting on bevel gears. Post-test inspection of the bevel gears confirmed initial pitting damage, underscoring the diagnostic capability of acoustic monitoring. The modulation phenomenon can be mathematically described by the sideband frequency formula:
$$f_s = i f_Z \pm j f_r \quad (i, j = 1, 2, 3, \dots)$$
where \(f_r\) is the rotational frequency of the faulty gear. By tracking these sidebands, early-stage faults in bevel gears can be detected, allowing for proactive maintenance and preventing catastrophic failures.
The advantages of acoustic testing for bevel gears are manifold. Compared to strain gauges, which are susceptible to durability issues in harsh environments and provide localized measurements, acoustic methods offer non-contact, full-field sensing with high sensitivity to high-frequency vibrations. This is especially important for bevel gears, as their meshing frequencies often exceed several kilohertz, where traditional vibration sensors may suffer from signal degradation due to complex transmission paths and background noise. The waveguide technique used here effectively isolates the original air-borne noise, minimizing contamination from other sources. Furthermore, the ability to capture both resonance characteristics and fault-induced modulations in a single measurement makes acoustic testing a powerful tool for the development and health monitoring of bevel gears.
In conclusion, this experimental study establishes acoustic measurement as a robust and effective method for characterizing the vibrational dynamics of aero-engine central bevel gears. Through detailed analysis of meshing frequency amplitudes and sideband structures, we can comprehensively identify traveling wave resonances and early fault conditions. The close correlation with strain measurements and design calculations validates the accuracy of this approach. For future work, integrating advanced signal processing techniques, such as order tracking and machine learning algorithms, could further enhance the diagnostic resolution for bevel gears operating in even more demanding conditions. Ultimately, understanding and monitoring the acoustic and vibration signatures of bevel gears is essential for advancing aero-engine reliability, safety, and performance, ensuring that these critical components meet the rigorous demands of modern aviation.