
The relentless pursuit of higher thrust-to-weight ratios and greater power density in modern aero-engines imposes severe demands on auxiliary transmission systems. The gearboxes within these systems are required to operate at increasingly high speeds and under significant loads while maintaining minimal weight. Among their critical components, bevel gears, particularly those in central drive configurations, are often designed with thin, disk-like webs for weight reduction. This structural similarity to rotating disks makes them highly susceptible to nodal-diameter type vibrations and, under specific conditions, to a dangerous phenomenon known as traveling wave resonance. Operating in harsh environments characterized by high rotational speeds, heavy loads, elevated temperatures, and oil mist, these bevel gears can experience resonant fatigue failure, posing a serious threat to engine integrity and flight safety.
Conventional methods for monitoring such dynamic behavior, like strain gauge measurements, are challenging to implement on actual engines. Their installation is complex, the survival rate of sensors in extreme conditions is low, and they are unsuitable for long-term fatigue monitoring. Therefore, developing a simple, accurate, and robust non-contact method for identifying and monitoring traveling wave resonance characteristics is of paramount importance for engine health management and further research into gear failure mechanisms.
This work presents an experimental investigation focused on the precise identification of traveling wave resonance in an aero-engine central drive bevel gear. We established and implemented a derived noise measurement methodology based on rigid-wall acoustic waveguide technology, complemented by a dynamic calibration system using a substitution method principle. This approach allows for accurate acoustic signal acquisition and subsequent data correction in complex operational environments. A comprehensive test was conducted on a gear component test rig under simulated conditions, employing synchronized noise and stress measurement techniques. The results successfully identify the resonant frequencies, critical speeds, and acoustic energy radiation associated with different nodal-diameter traveling wave modes of the driven bevel gear.
Theoretical Foundation of Traveling Wave Resonance in Bevel Gears
The geometry of a bevel gear web closely resembles that of a circular disk. Consequently, its vibration modes are analogous, featuring nodal-circle (NC), nodal-diameter (ND), and combined (NC-ND) patterns. Empirical evidence strongly indicates that thin-webbed bevel gears are most prone to nodal-diameter type vibrations. In this mode, the gear web vibrates transversely, forming a standing wave pattern with m diametrical nodes where displacement is zero. This standing wave can be decomposed into two constituent waves traveling in opposite directions around the circumference: a Forward Traveling Wave (FTW) rotating in the same direction as the gear spin, and a Backward Traveling Wave (BTW) rotating opposite to it.
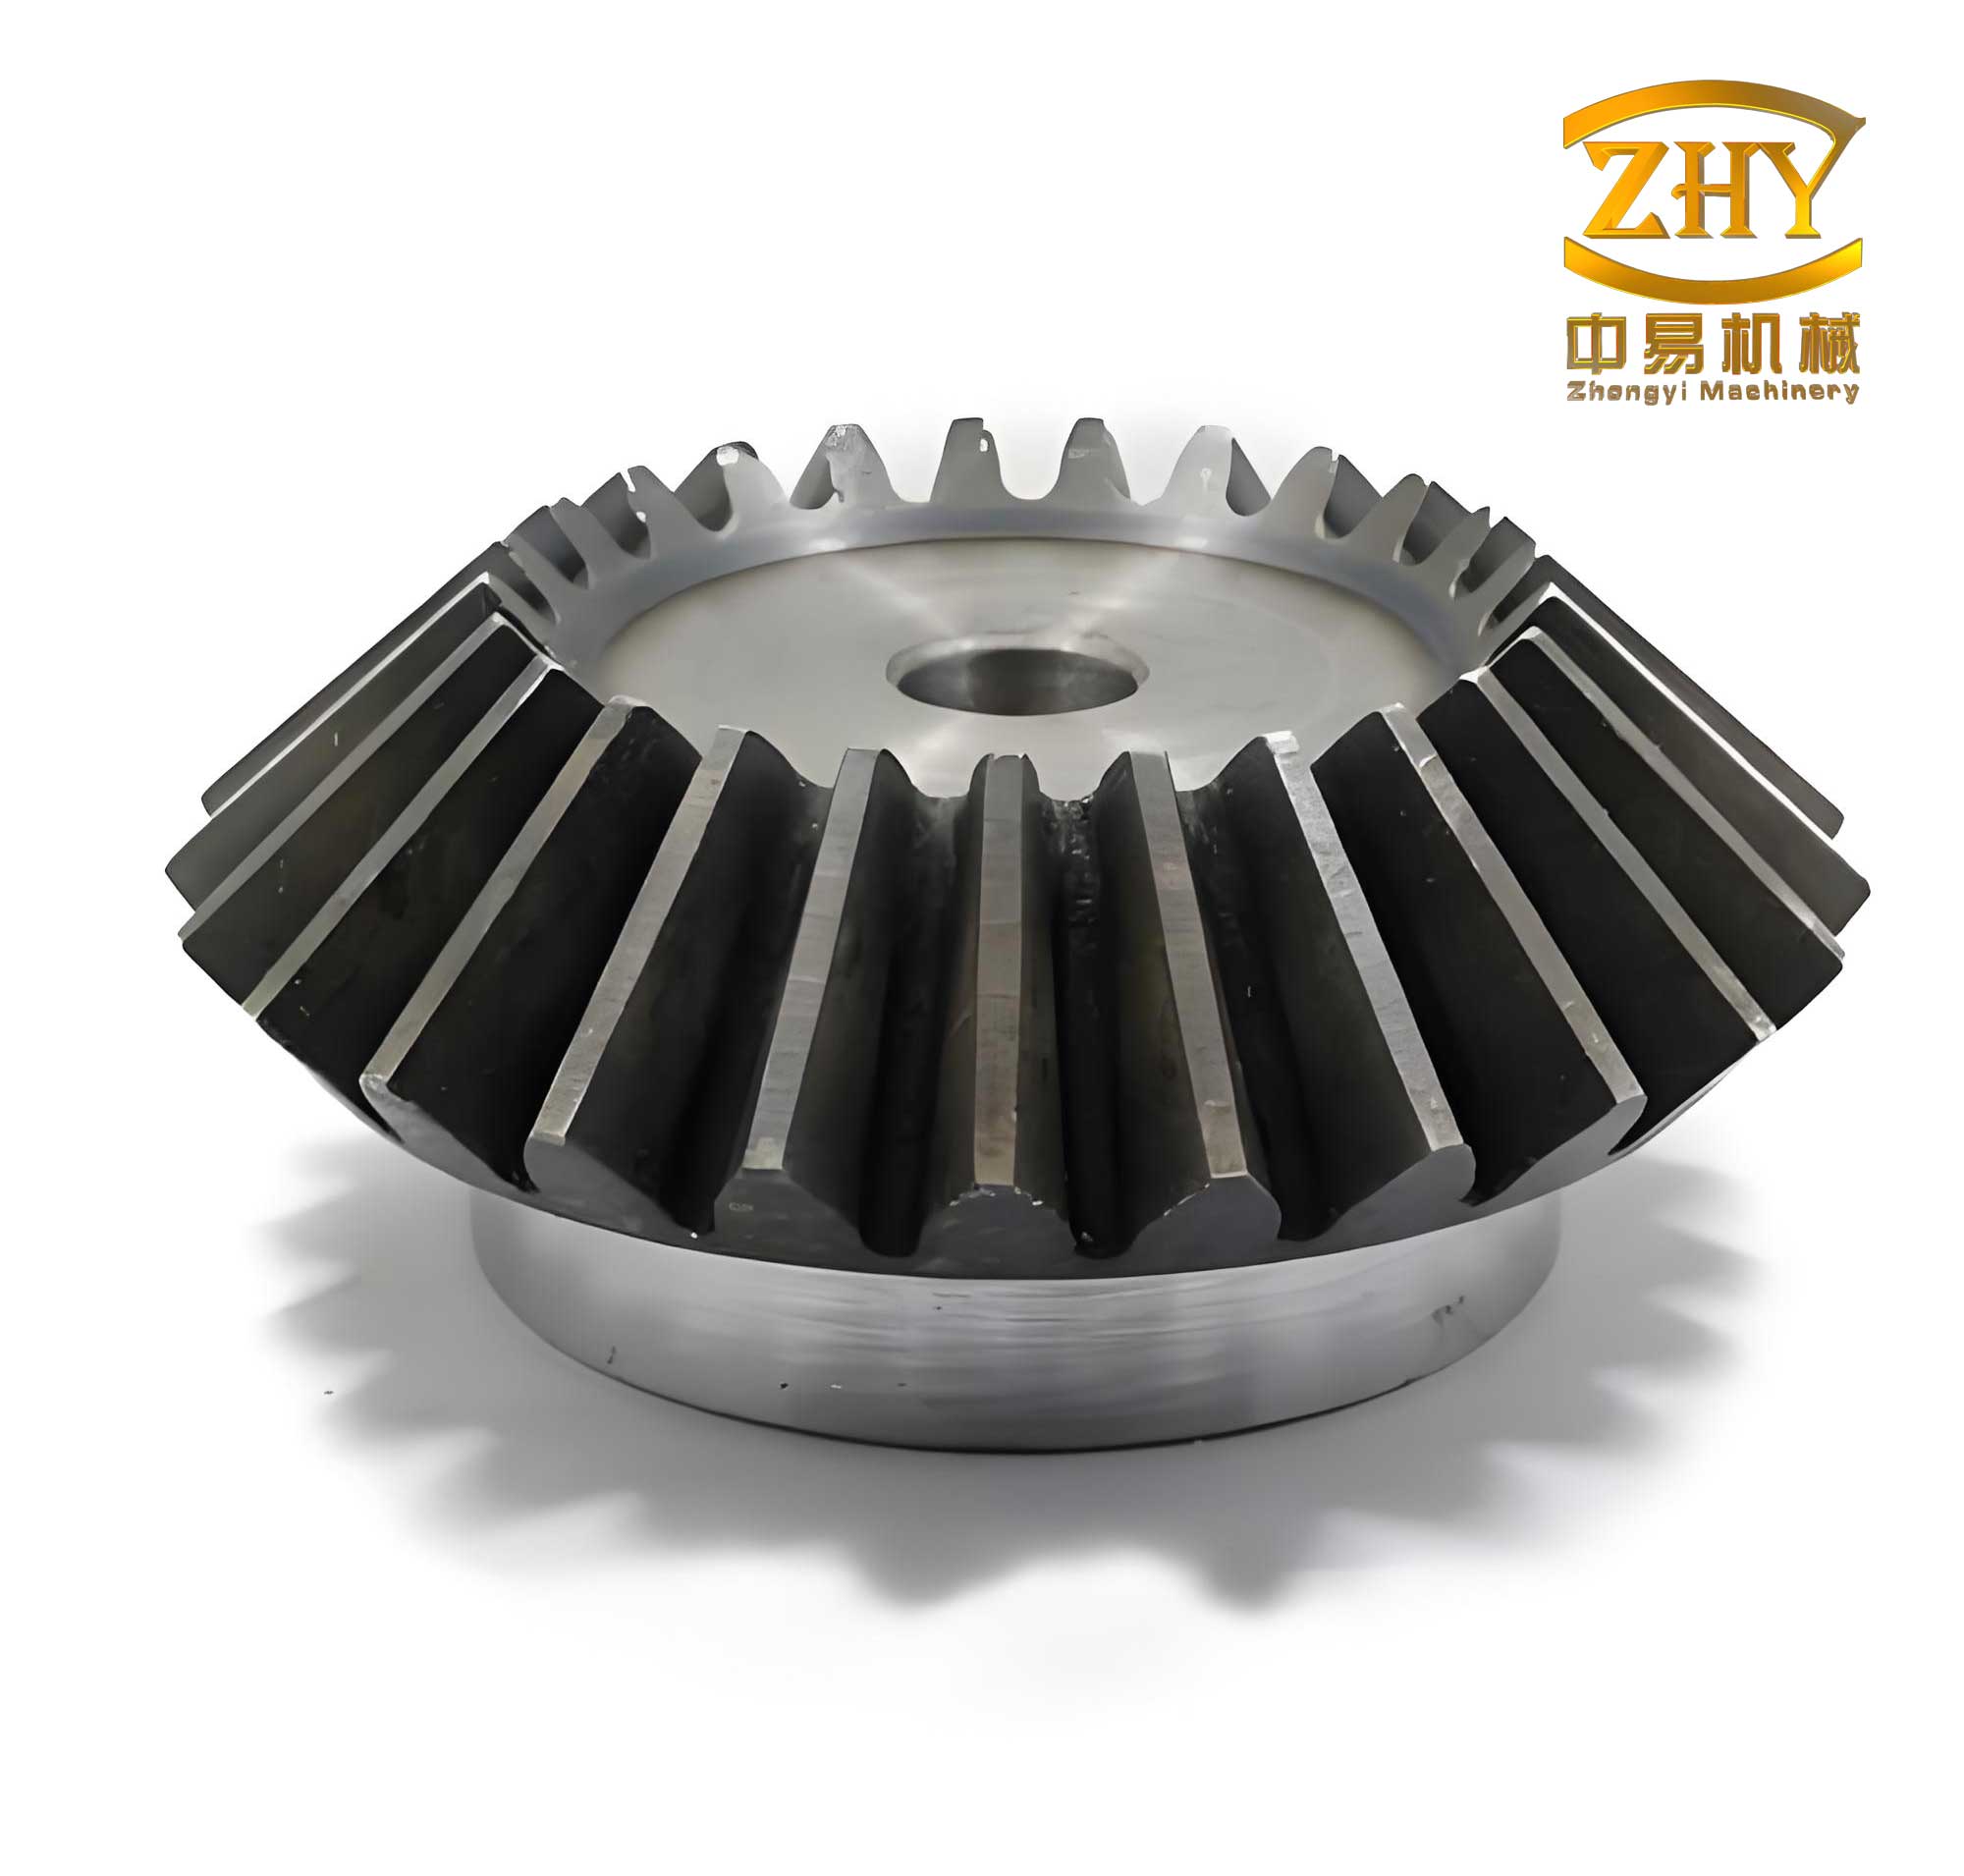
The transverse displacement z of a non-rotating disk in a ND vibration mode can be expressed as:
$$z = A(r) \cos(m\theta) \cos(\omega t)$$
where \(A(r)\) is the radial amplitude distribution, \(m\) is the number of nodal diameters, \(\theta\) is the circumferential angle, \(\omega\) is the natural angular frequency, and \(t\) is time.
When the gear rotates, this expression transforms, revealing the traveling wave components. Using trigonometric identities, it can be rewritten as:
$$z = \frac{1}{2} A(r) \left[ \cos(m\theta – \omega t) + \cos(m\theta + \omega t) \right]$$
The first term, \(\cos(m\theta – \omega t)\), represents the FTW, and the second term, \(\cos(m\theta + \omega t)\), represents the BTW. Their frequencies, as observed in a stationary (absolute) frame of reference, differ due to rotation. For the driven bevel gear, these frequencies are given by:
$$f_f = f_d + \frac{i N_2 m}{60} \quad \text{(Forward Traveling Wave)}$$
$$f_b = f_d – \frac{i N_2 m}{60} \quad \text{(Backward Traveling Wave)}$$
Here, \(f_f\) and \(f_b\) are the FTW and BTW frequencies, \(f_d\) is the dynamic natural frequency of the rotating gear, \(i\) is the gear ratio (\(i = Z_1 / Z_2\), where \(Z\) is the number of teeth), and \(N_2\) is the rotational speed of the driving gear (rpm).
Traveling wave resonance occurs when the frequency of a meshing excitation force coincides with one of these traveling wave frequencies. The primary excitation in bevel gears originates from the mesh frequency, \(f_e = (N_2 / 60) \cdot Z_1\). The conditions for resonance are:
1. The excitation frequency and the gear’s natural frequency are considered in the same coordinate frame (stationary frame for acoustics).
2. The excitation frequency equals either the FTW or BTW frequency: \(f_e = f_f\) or \(f_e = f_b\).
3. The excitation force does positive work on the vibration mode.
Substituting the resonance condition into the traveling wave frequency equations yields the critical driving gear speeds for resonance:
$$N_2^{\text{res}} = \frac{60 f_d}{i (Z_2 \mp m)}$$
where the minus sign corresponds to FTW resonance and the plus sign to BTW resonance. This formula highlights the dependency of the resonance speed on the dynamic frequency \(f_d\), the gear ratio, and the number of nodal diameters \(m\).
Methodology: Derived Acoustic Measurement and Dynamic Calibration
Acoustic Measurement Principle
When a bevel gear undergoes traveling wave resonance, its vibrating web acts as a potent acoustic source, radiating sound energy into the surrounding cavity. Under normal operation, this acoustic signature is relatively low. However, at the resonance condition, a pronounced spike in acoustic energy occurs. This sharp increase serves as a clear indicator of resonance. Acoustic measurement, being non-contact, offers significant advantages over strain gauges: simpler installation, no impact on the test article, and suitability for long-term monitoring in hostile environments. To enhance signal fidelity in the noisy, oil-contaminated environment of a gearbox, we employ a derived measurement technique using an acoustic waveguide.
Design of the Derived Noise Measurement System
The core of our measurement approach is a rigid-wall acoustic waveguide system. It comprises several key components designed to capture and transmit the acoustic signal with minimal distortion and high signal-to-noise ratio (SNR):
- Acoustic Waveguide: A straight, rigid tube (Φ8×1 mm copper pipe) inserted into the gearbox. Its inner diameter is selected to ensure only plane waves propagate within the frequency range of interest, suppressing higher-order acoustic modes.
- Microphone Housing: A specially designed mount that holds the pressure-field microphone (B&K 4938) flush with the inner wall of the waveguide. This prevents reflections at the microphone face.
- Semi-Infinite Attenuation Tube: Attached to the rear of the microphone housing, this tube is terminated with anechoic material to prevent sound reflections from the end of the system, ensuring an anechoic termination and minimizing standing waves within the waveguide.
- Data Acquisition: Signals are recorded using a high-fidelity system (LMS Scadas-III) with a sampling frequency of 51.2 kHz.
The system’s effectiveness relies on impedance matching. The inner diameters of the waveguide, housing, and attenuation tube are identical to prevent reflections due to cross-sectional discontinuities. The cutoff frequency for higher-order modes in a cylindrical duct is given by:
$$f_{co} = \frac{1.84 c_0}{2 \pi r}$$
where \(c_0\) is the speed of sound and \(r\) is the tube radius. For our waveguide, \(f_{co} \approx 33 \text{kHz}\), well above the frequencies associated with gear resonance (typically below 15 kHz), guaranteeing a pure plane wave field.
Dynamic Calibration and Signal Correction
A critical challenge with waveguide-based measurements is frequency-dependent signal attenuation caused by viscous and thermal losses along the tube wall. This attenuation, particularly at higher frequencies, distorts the amplitude spectrum. Previous studies often neglected this correction, leading to inaccuracies in reported sound pressure levels. To achieve precise amplitude measurement, we developed a digital closed-loop calibration system based on the substitution method.
The system uses a loudspeaker-driven traveling wave tube (TWT) to generate a known, broadband acoustic reference signal. The derived measurement system (waveguide + microphone) is placed in this reference field, and its response is recorded. It is then replaced by a reference microphone measuring the same field directly. The transfer function between the two measurements defines the full-frequency-band attenuation correction factor for the specific waveguide length.
The calibration yields a correction curve, \(SPL_F(f)\), representing the attenuation in decibels as a function of frequency. The true sound pressure level \(SPL_R\) at any frequency is then obtained by correcting the measured level \(SPL_M\):
$$SPL_R(f) = SPL_M(f) + SPL_F(f)$$
For the 1000 mm long waveguide used in our experiment, a representative attenuation correction curve is shown in the table below, derived from the calibration process.
| Frequency Band (Hz) | Approximate Attenuation \(SPL_F\) (dB) |
|---|---|
| 1000 – 4000 | 8 – 12 |
| 4000 – 9000 | 12 – 17 |
| 9000 – 13000 | 17 – 22 |
| 13000 – 20000 | 22 – 30 |
This calibration and correction procedure is fundamental to the accurate quantification of acoustic energy radiated during the resonance of the bevel gears.
Experimental Setup and Procedure
The experiment was conducted on a dedicated central drive bevel gear component test rig. The test articles consisted of a pair of spiral bevel gears with the following specifications:
| Parameter | Driving Gear | Driven Gear |
|---|---|---|
| Number of Teeth (Z) | 47 | 35 |
| Gear Ratio (i) | 47/35 ≈ 1.3429 | |
The primary excitation frequency is therefore the mesh frequency: \(f_e = N_2 \times 47 / 60\) Hz.
Sensor Installation
Synchronized Stress Measurement: To validate the acoustic method, four strain gauges were installed on the back face (web) of the driven bevel gear, near the tooth fillet. They were spaced at intervals of 8 and 9 teeth to capture the stress wave pattern. This provides dynamic frequency (\(f_d\)) and resonance speed data in the rotating frame.
Derived Acoustic Measurement: Two measurement ports were created on the gearbox casing. Two identical 1000 mm long waveguide systems were installed. The probe end of Waveguide 1 was positioned approximately 10 mm above the driven gear’s web, aligned with its center. Waveguide 2 was positioned at a 45-degree angular offset. To protect the microphone from oil ingress, fine-pore hydrophobic foam plugs were inserted at strategic points within the waveguides.
Test Profile
The test consisted of a controlled speed sweep of the driving gear (\(N_2\)). The speed was varied from 72% to 106% of the nominal maximum engine speed (\(N_r\)), including slow (MC) holds and rapid transients designed to excite and capture resonant conditions. Data from acoustic sensors, strain gauges, and the tachometer were recorded synchronously.
Results and Analysis
Precise Identification of Resonance Frequency and Speed
The time-frequency analysis (spectrogram) of the acoustic signal from Waveguide 1 clearly reveals distinct regions of high acoustic energy during the speed sweep. These manifest as bright ridges corresponding to constant frequencies in the absolute frame. Two dominant resonances were identified and are summarized in the table below, compared against results derived from the synchronized strain gauge measurements.
| Parameter | Acoustic Measurement (Stationary Frame) | Stress Measurement (Rotating Frame) | Relative Error |
|---|---|---|---|
| 3rd ND Forward Traveling Wave | |||
| Resonant Frequency \(f_{f3}\) (Hz) | 8715 | 8715.4* | 0.005% |
| Driving Gear Speed \(N_2\) (rpm) | 11126 | 11130 | 0.04% |
| 4th ND Backward Traveling Wave | |||
| Resonant Frequency \(f_{b4}\) (Hz) | 12015 | 12015.2* | 0.002% |
| Driving Gear Speed \(N_2\) (rpm) | 15337 | 15340 | 0.02% |
| *Calculated from measured dynamic frequency \(f_d\) and speed using Eqs. (3) & (4). | |||
The acoustic system directly measures the traveling wave resonance frequencies \(f_f\) and \(f_b\) in the stationary frame. The strain gauge system measures the dynamic natural frequency \(f_d\) and the resonance speed. The traveling wave frequencies can be calculated from these using the theoretical formulas, providing a benchmark. The exceptional agreement between the directly measured acoustic frequencies and the calculated ones, with errors less than 0.005%, and the close match in resonance speeds (errors within the speed control fluctuation band of ±5 rpm), validate the high precision of the derived acoustic measurement methodology. This accuracy surpasses that of simpler acoustic methods reported in earlier literature, which exhibited errors of 1-2.2%.
Analysis of Acoustic Energy Radiation
Applying the dynamic calibration corrections is crucial for assessing the true acoustic energy emitted during resonance. The measured sound pressure levels (SPL_M) at the identified resonance frequencies were corrected using the attenuation factor \(SPL_F\) specific to those frequencies and the 1000 mm waveguide length. The results for multiple data points (A1, A2, A3) during each resonance event are shown below.
| Vibration Mode | Data Point | Res. Freq. (Hz) | Measured SPL_M (dB) | Attenuation Corr. \(SPL_F\) (dB) | Corrected SPL_R (dB) | Avg. Corrected SPL (dB) |
|---|---|---|---|---|---|---|
| 3rd ND FTW | A1 | 8650 | 139.9 | 16.7 | 156.6 | 154.4 |
| A2 | 8685 | 140.2 | 14.2 | 154.4 | ||
| A3 | 8715 | 138.6 | 13.5 | 152.1 | ||
| 4th ND BTW | A1 | 11920 | 132.6 | 28.5 | 161.1 | 161.2 |
| A2 | 11960 | 132.7 | 28.3 | 161.0 | ||
| A3 | 12015 | 132.2 | 29.2 | 161.4 |
The corrected average sound pressure level for the 4th ND BTW resonance (161.2 dB) is 6.8 dB higher than that for the 3rd ND FTW resonance (154.4 dB). Since an increase of 3 dB represents a doubling of acoustic energy, the 4th ND BTW resonance radiates approximately \(2^{(6.8/3)} \approx 4.5\) times more acoustic energy than the 3rd ND FTW resonance. This significant increase in radiated energy indicates a more intense vibration state, suggesting that the 4th ND BTW resonance at a higher rotational speed presents a greater risk for dynamic overstress and potential fatigue failure in these bevel gears.
Conclusion
This experimental study successfully demonstrates a precise and robust method for identifying traveling wave resonance in aero-engine central drive bevel gears. The key findings and contributions are:
- Methodology Validation: The derived noise measurement system, based on rigid-wall acoustic waveguide technology and complemented by a full-frequency-band dynamic calibration procedure, proved highly effective. It enabled accurate, non-contact monitoring in a high-temperature, high-oil-mist environment. Cross-validation with synchronized strain gauge measurements confirmed its precision, with resonance frequency errors below 0.04% and speed errors below 0.005%.
- Resonance Characteristics: For the specific driven bevel gear tested, two primary traveling wave resonances were identified within the operational speed range: the 3rd Nodal Diameter Forward Traveling Wave and the 4th Nodal Diameter Backward Traveling Wave.
- Acoustic Energy Assessment: After applying necessary signal corrections, the acoustic energy radiation was quantified. The 4th ND BTW resonance was found to radiate approximately 4.5 times more sound energy than the 3rd ND FTW resonance. This underscores that resonance at higher speeds and higher modal orders can be significantly more dangerous, likely correlating with higher dynamic stresses.
The developed methodology provides a valuable tool for health monitoring and diagnostic systems on actual engines, where traditional sensor installation is prohibitive. Furthermore, the accurate identification of resonant conditions provides critical data for validating numerical models and for guiding the design of future bevel gears, for instance, through geometric or material optimization to shift dangerous resonances outside the engine’s operating envelope.