
In industrial machinery, the integrity of rotating components such as gear shafts is critical for operational safety and efficiency. I recently investigated a fatigue failure incident involving a helical gear shaft in the tilting mechanism of a 210-ton basic oxygen furnace at a steel plant. The gear shaft, which transmits motion and torque between the motor and the reducer, fractured unexpectedly, leading to downtime and potential safety hazards. This analysis aims to determine the root cause of the failure through a comprehensive fatigue life assessment, combining static strength evaluation and fatigue analysis using advanced simulation tools. The goal is to provide insights that can inform design optimizations and preventive maintenance strategies for similar gear shaft applications.
The helical gear shaft in question is part of a high-speed reducer unit. Its primary function is to convert motor input into controlled rotational output for furnace tilting operations, which include charging, tapping, and slagging. The fracture occurred near a threaded section adjacent to a shaft shoulder, a region prone to stress concentrations. Initial visual inspection suggested fatigue characteristics, such as crack initiation and propagation zones, prompting a detailed engineering analysis. In this study, I employ finite element analysis (FEA) for static stress evaluation and specialized fatigue software to predict life cycles, ensuring a holistic understanding of the gear shaft’s behavior under operational loads.
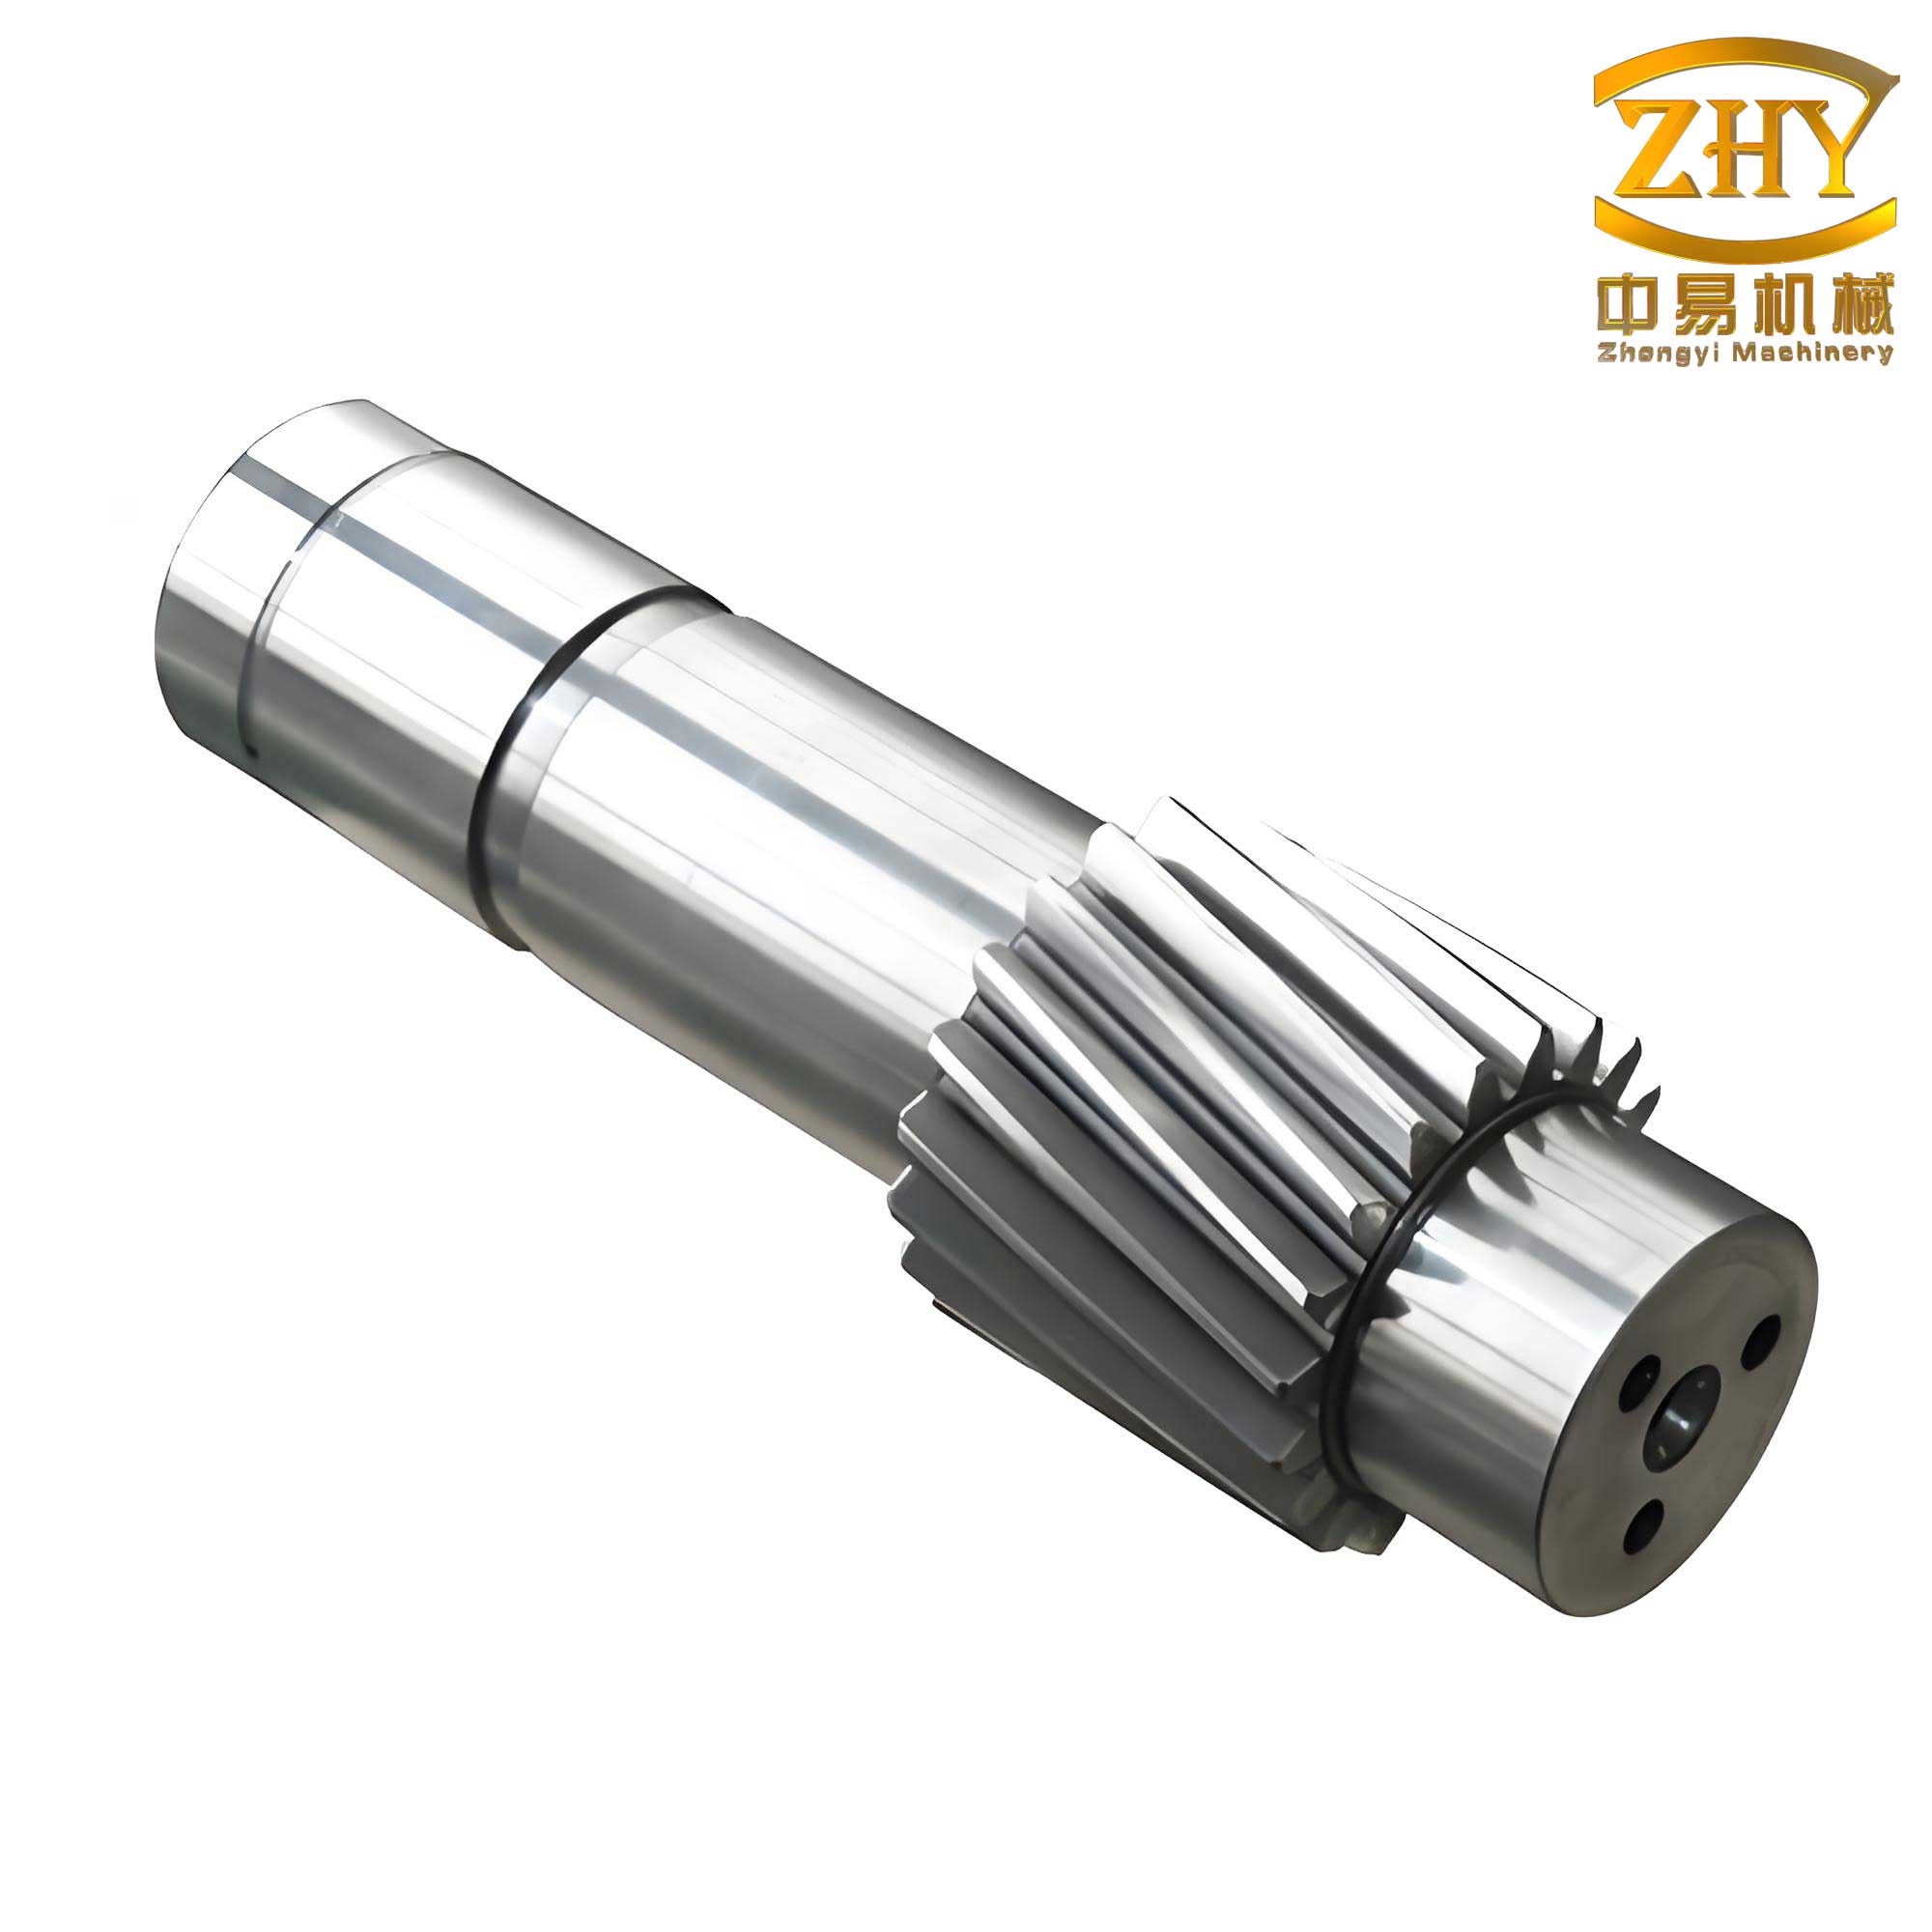
To begin, I developed a three-dimensional model of the helical gear shaft using SolidWorks software. The geometry includes key features such as the helical gear, bearing seats, keyways, and threaded sections. For computational efficiency, I simplified the model by removing minor fillets and non-critical details that do not significantly affect stress distribution. The simplified gear shaft was exported in Parasolid (*.x_t) format and imported into ANSYS for FEA preprocessing. This seamless data transfer ensures accuracy in geometric representation, which is essential for reliable stress analysis of the gear shaft.
The material selected for the gear shaft is 20CrNiMo alloy steel, known for its high strength and toughness in demanding environments. The mechanical properties are summarized in Table 1. These parameters form the basis for both elastic and plastic behavior simulations, particularly under cyclic loading conditions that govern fatigue life.
| Property | Value | Unit |
|---|---|---|
| Elastic Modulus (E) | 208 | GPa |
| Poisson’s Ratio (ν) | 0.295 | – |
| Yield Strength (σ_y) | 785 | MPa |
| Ultimate Tensile Strength (σ_u) | 980 | MPa |
| Density (ρ) | 7850 | kg/m³ |
In ANSYS, I assigned the SOLID185 element type, an 8-node brick element suitable for structural analyses. The mesh was refined in regions of high stress gradients, such as the gear teeth and keyway areas, with an element size of 0.007 m, while coarser meshing (0.01 m element size) was applied elsewhere. This resulted in a model with approximately 150,000 elements and 30,000 nodes, ensuring a balance between accuracy and computational cost for the gear shaft analysis. Convergence studies were performed to verify mesh independence, confirming that further refinement did not alter stress results by more than 2%.
The loading and boundary conditions were derived from the operational context of the gear shaft. The gear shaft is supported by three double-row tapered roller bearings, which constrain radial and axial movements. In the static analysis, I assumed fixed support conditions at the bearing locations to simulate instantaneous loading. The input torque from the motor is applied as a distributed force on the keyway surface, calculated based on the motor power and speed. For the helical gear, the meshing forces were simplified into equivalent normal distributed loads acting on the tooth faces. The torque transmission can be expressed using the fundamental relationship:
$$T = \frac{P}{\omega}$$
where \(T\) is the torque, \(P\) is the power, and \(\omega\) is the angular velocity. For this gear shaft, the motor power is 200 kW at 500 rpm, leading to an input torque of approximately 3820 N·m. The gear forces were derived from torque equilibrium, considering the gear geometry and pressure angle. The von Mises stress criterion was used to evaluate the static strength, as it accounts for multi-axial stress states common in gear shaft components.
The static FEA results revealed a maximum von Mises stress of 431.5 MPa, located at the transition region between the threaded section and shaft shoulder near the motor end. This stress concentration is attributed to geometric discontinuities, such as the thread run-out and sharp corners, which act as stress raisers. The calculated stress is below the yield strength of 785 MPa, with a safety factor of approximately 1.8 based on the yield criterion:
$$n_s = \frac{\sigma_y}{\sigma_{max}}$$
where \(n_s\) is the safety factor, \(\sigma_y\) is the yield strength, and \(\sigma_{max}\) is the maximum von Mises stress. However, despite this apparent static safety, the gear shaft failed in service, indicating that fatigue mechanisms, rather than static overload, were responsible. Fatigue failure occurs under cyclic loading at stresses below the ultimate strength, often initiating at stress concentration sites like those identified in the gear shaft.
To assess fatigue life, I employed the ANSYS/FE-SAFE integration, which combines FEA results with fatigue algorithms. The process involves importing the stress solution from ANSYS into FE-SAFE, along with material fatigue properties and load history data. For the gear shaft material, I used the Seeger method within FE-SAFE to estimate the S-N (stress-life) curve based on the ultimate tensile strength. The S-N relationship is typically expressed as:
$$\sigma_a = \sigma_f’ (2N_f)^b$$
where \(\sigma_a\) is the stress amplitude, \(\sigma_f’\) is the fatigue strength coefficient, \(N_f\) is the number of cycles to failure, and \(b\) is the fatigue strength exponent. For 20CrNiMo, the estimated endurance limit is around 450 MPa for fully reversed loading.
A critical input for fatigue analysis is the load time history, which represents the varying torque on the gear shaft during furnace operations. Since direct measurement was impractical, I reconstructed the load spectrum analytically. Using SolidWorks, I modeled the furnace and molten metal at different tilt angles to compute the tilting moment. The weight and center of gravity were determined via the software’s mass properties tool, allowing moment calculation as a function of angle. The tilting moment \(M_t\) for a given angle \(\theta\) is given by:
$$M_t(\theta) = W \cdot d(\theta)$$
where \(W\) is the total weight and \(d(\theta)\) is the horizontal distance from the pivot to the center of gravity. The tilting moment curve was simplified into key operational phases, such as tapping, charging, and blowing, with each phase assigned a representative torque value based on the maximum or average moment. The torque on the gear shaft \(T_{shaft}\) is related to the tilting moment through the gear ratio and efficiency:
$$T_{shaft} = \frac{M_t}{i \eta}$$
where \(i\) is the total reduction ratio and \(\eta\) is the mechanical efficiency. For this system, \(i = 50\) and \(\eta \approx 0.95\). The resulting load spectrum for one complete steelmaking cycle is summarized in Table 2, covering various operations with their durations and torque magnitudes.
| Operation Phase | Duration (min) | Motor Active Time (min) | Torque on Gear Shaft (N·m) | Stress Amplitude (MPa) |
|---|---|---|---|---|
| Tapping and Slagging | 10.0 | 2.40 | 1090.1 | 152.3 |
| Auxiliary Operations | 2.0 | 0.25 | -479.3 | 67.0 |
| Plugging Tap Hole | 1.0 | 0.38 | 428.0 | 59.8 |
| Charging and Charging | 5.0 | 0.19 | -339.4 | 47.4 |
| Return to Blow Position | 0.2 | 0.20 | 861.8 | 120.4 |
| Blowing | 16.0 | 0.00 | 0 | 0 |
| Sampling and Temperature Measurement | 2.5 | 0.60 | -1055.8 | 147.5 |
| Return to Upright | 0.3 | 0.30 | 1055.8 | 147.5 |
The stress amplitudes in Table 2 were derived from the torque values using the gear shaft geometry and stress concentration factors. The load spectrum exhibits both positive and negative torques, indicating fully reversed loading conditions that are severe for fatigue. I imported this spectrum into FE-SAFE as a series of loading blocks, applying the von Mises stress-based Goodman correction for mean stress effects. The Goodman equation adjusts the alternating stress \(\sigma_a\) for a given mean stress \(\sigma_m\):
$$\sigma_a = \sigma_{e} \left(1 – \frac{\sigma_m}{\sigma_u}\right)$$
where \(\sigma_e\) is the endurance limit and \(\sigma_u\) is the ultimate strength. This correction is crucial for the gear shaft, as non-zero mean stresses from constant load components can reduce fatigue life.
In FE-SAFE, I performed a fatigue analysis using the uniaxial stress-based approach with the Miner linear cumulative damage rule. The damage \(D\) for each load block is calculated as:
$$D_i = \frac{n_i}{N_i}$$
where \(n_i\) is the number of cycles at a given stress level, and \(N_i\) is the cycles to failure from the S-N curve. Total damage over one cycle is summed, and fatigue life is predicted as the number of cycles until \(D = 1\). The software generated contour plots of log fatigue life and safety factors across the gear shaft geometry.
The results indicated a minimum fatigue life of \(10^{5.377}\) cycles, equivalent to approximately 238,000 cycles. Given the motor speed of 500 rpm, this translates to an operational life of about 476 minutes before crack initiation is expected. The critical location corresponds precisely to the fracture site observed in the failed gear shaft: the thread run-out area near the motor end. The fatigue safety factor at this location was 0.73, confirming inadequate design margin under cyclic loads. The logarithmic life contour shows a symmetric distribution around the stress concentration, highlighting the vulnerability of this gear shaft region.
Further analysis of the stress history reveals that the highest damage contributions come from the tapping and return phases, where torque magnitudes exceed 1000 N·m. These transient events, combined with frequent start-stop cycles, create high stress amplitudes that drive crack initiation. The thread root acts as a natural stress raiser, with a theoretical stress concentration factor \(K_t\) estimated at 2.5 for sharp notches, amplifying local stresses well above the nominal values. The effective stress range \(\Delta \sigma_{eff}\) at the critical point can be expressed as:
$$\Delta \sigma_{eff} = K_f \cdot \Delta \sigma_{nom}$$
where \(K_f\) is the fatigue notch factor, which accounts for both geometric and material sensitivity. For the gear shaft material, \(K_f\) approaches \(K_t\) under high-cycle fatigue, leading to localized stress peaks that initiate microcracks.
To validate the fatigue model, I compared the predicted crack location with the fracture surface characteristics. The analysis aligns with typical fatigue failure patterns: crack initiation at the stress concentration, stable propagation through the cross-section, and final overload fracture. The gear shaft’s design, particularly the abrupt transition at the thread, exacerbates this issue. In contrast, a static analysis under braking conditions showed a maximum stress of only 56 MPa, far below the fatigue limit, confirming that fatigue is the dominant failure mode for this gear shaft during normal operation.
Based on these findings, I propose several design optimizations for the helical gear shaft. First, increasing the fillet radius at the thread run-out can reduce the stress concentration factor. A larger radius \(r\) decreases \(K_t\) according to empirical relations for shafts:
$$K_t \approx 1 + \frac{A}{\sqrt{r/d}}$$
where \(A\) is a constant and \(d\) is the shaft diameter. Second, surface treatments such as shot peening or nitriding can introduce compressive residual stresses, improving fatigue resistance by lowering the effective stress amplitude. The modified endurance limit \(\sigma_e’\) with residual stress \(\sigma_{res}\) is:
$$\sigma_e’ = \sigma_e + \kappa \sigma_{res}$$
where \(\kappa\) is a material constant. Third, material upgrade to a higher-grade alloy steel with superior fatigue properties could extend life, though at increased cost. Finally, real-time monitoring of torque fluctuations could enable predictive maintenance, scheduling gear shaft replacements before critical crack growth occurs.
In conclusion, this comprehensive analysis demonstrates that the fatigue failure of the helical gear shaft resulted from cyclic stresses concentrated at a geometric discontinuity. The integration of static FEA and fatigue life prediction using ANSYS/FE-SAFE provided accurate life estimates and identified the critical location matching the actual fracture. The gear shaft’s design, while statically adequate, lacked sufficient fatigue resistance under operational load spectra. By implementing design modifications such as improved fillets and surface hardening, the fatigue life of the gear shaft can be significantly enhanced, ensuring reliability in demanding industrial applications. This study underscores the importance of fatigue analysis in rotating machinery design, particularly for components like gear shafts subjected to complex dynamic loads.
Future work could involve experimental validation through strain gauge measurements on a prototype gear shaft, coupled with accelerated fatigue testing. Additionally, probabilistic methods could account for material variability and load uncertainties, offering a more robust life prediction framework for gear shaft systems in steelmaking and other heavy industries.