
The relentless pursuit of efficiency, compactness, and power density in modern automotive drivetrains places immense demands on critical components. Among these, the final drive unit, responsible for transferring power from the driveshaft to the wheels, operates under some of the most severe conditions. The hyperboloid gear pair, often termed a hypoid gear set, stands as the cornerstone of this assembly. Its defining characteristic—offset axes between the pinion and the gear—allows for a lower propeller shaft, enhancing vehicle design and ground clearance. Beyond this packaging advantage, hyperboloid gears offer superior load-bearing capacity, smoother meshing action due to their high contact ratio, and quieter operation compared to their bevel gear counterparts. However, these very advantages are contingent on the integrity of the gear tooth surfaces. In service, under the combined assault of high torque, fluctuating speeds, and variable road loads, the primary failure mode for these hardened components is often contact (or pitting) fatigue. This high-cycle fatigue phenomenon manifests as surface or subsurface cracks that propagate, leading to material spalling and ultimately, catastrophic gear failure. Therefore, developing a robust and accurate methodology for predicting the high-cycle fatigue life of automotive rear axle hyperboloid gears is paramount for ensuring drivetrain reliability, optimizing maintenance schedules, and preventing costly field failures.
Traditional fatigue analysis often relies on simplified models, constant amplitude loading assumptions, or commercial software black boxes that may not fully capture the intricate interplay of geometry, material behavior, and real-world loading sequences. This work presents a comprehensive, physics-based framework for the fatigue life assessment of hyperboloid gears. The methodology integrates several key disciplines: precise gear geometry generation, detailed finite element analysis for contact stress evaluation, statistical processing of real-world torque data to create a representative load spectrum, and the application of fundamental fatigue damage accumulation theories. By moving beyond constant-load simulations and embracing the stochastic nature of service loads, this approach aims to provide a more realistic and conservative estimate of gear durability, offering significant value for design validation and reliability engineering.
Precision Modeling of Hyperboloid Gear Geometry and Finite Element Discretization
The foundation of any accurate mechanical analysis lies in a faithful representation of the component’s geometry. For hyperboloid gears, this is particularly crucial due to their complex, non-developable tooth surfaces. The geometry is not defined by simple involutes but is generated through a simulated machining process (face-milling or face-hobbing) using imaginary crown gear cutters. The mathematical model is based on the theory of gearing, coordinate transformations, and the kinematics of the generating process. Key design parameters govern the final shape, including the number of teeth, module, spiral angle, pressure angle, and the all-important hypoid offset. A precise three-dimensional solid model of the gear pair is the first essential output of this process.
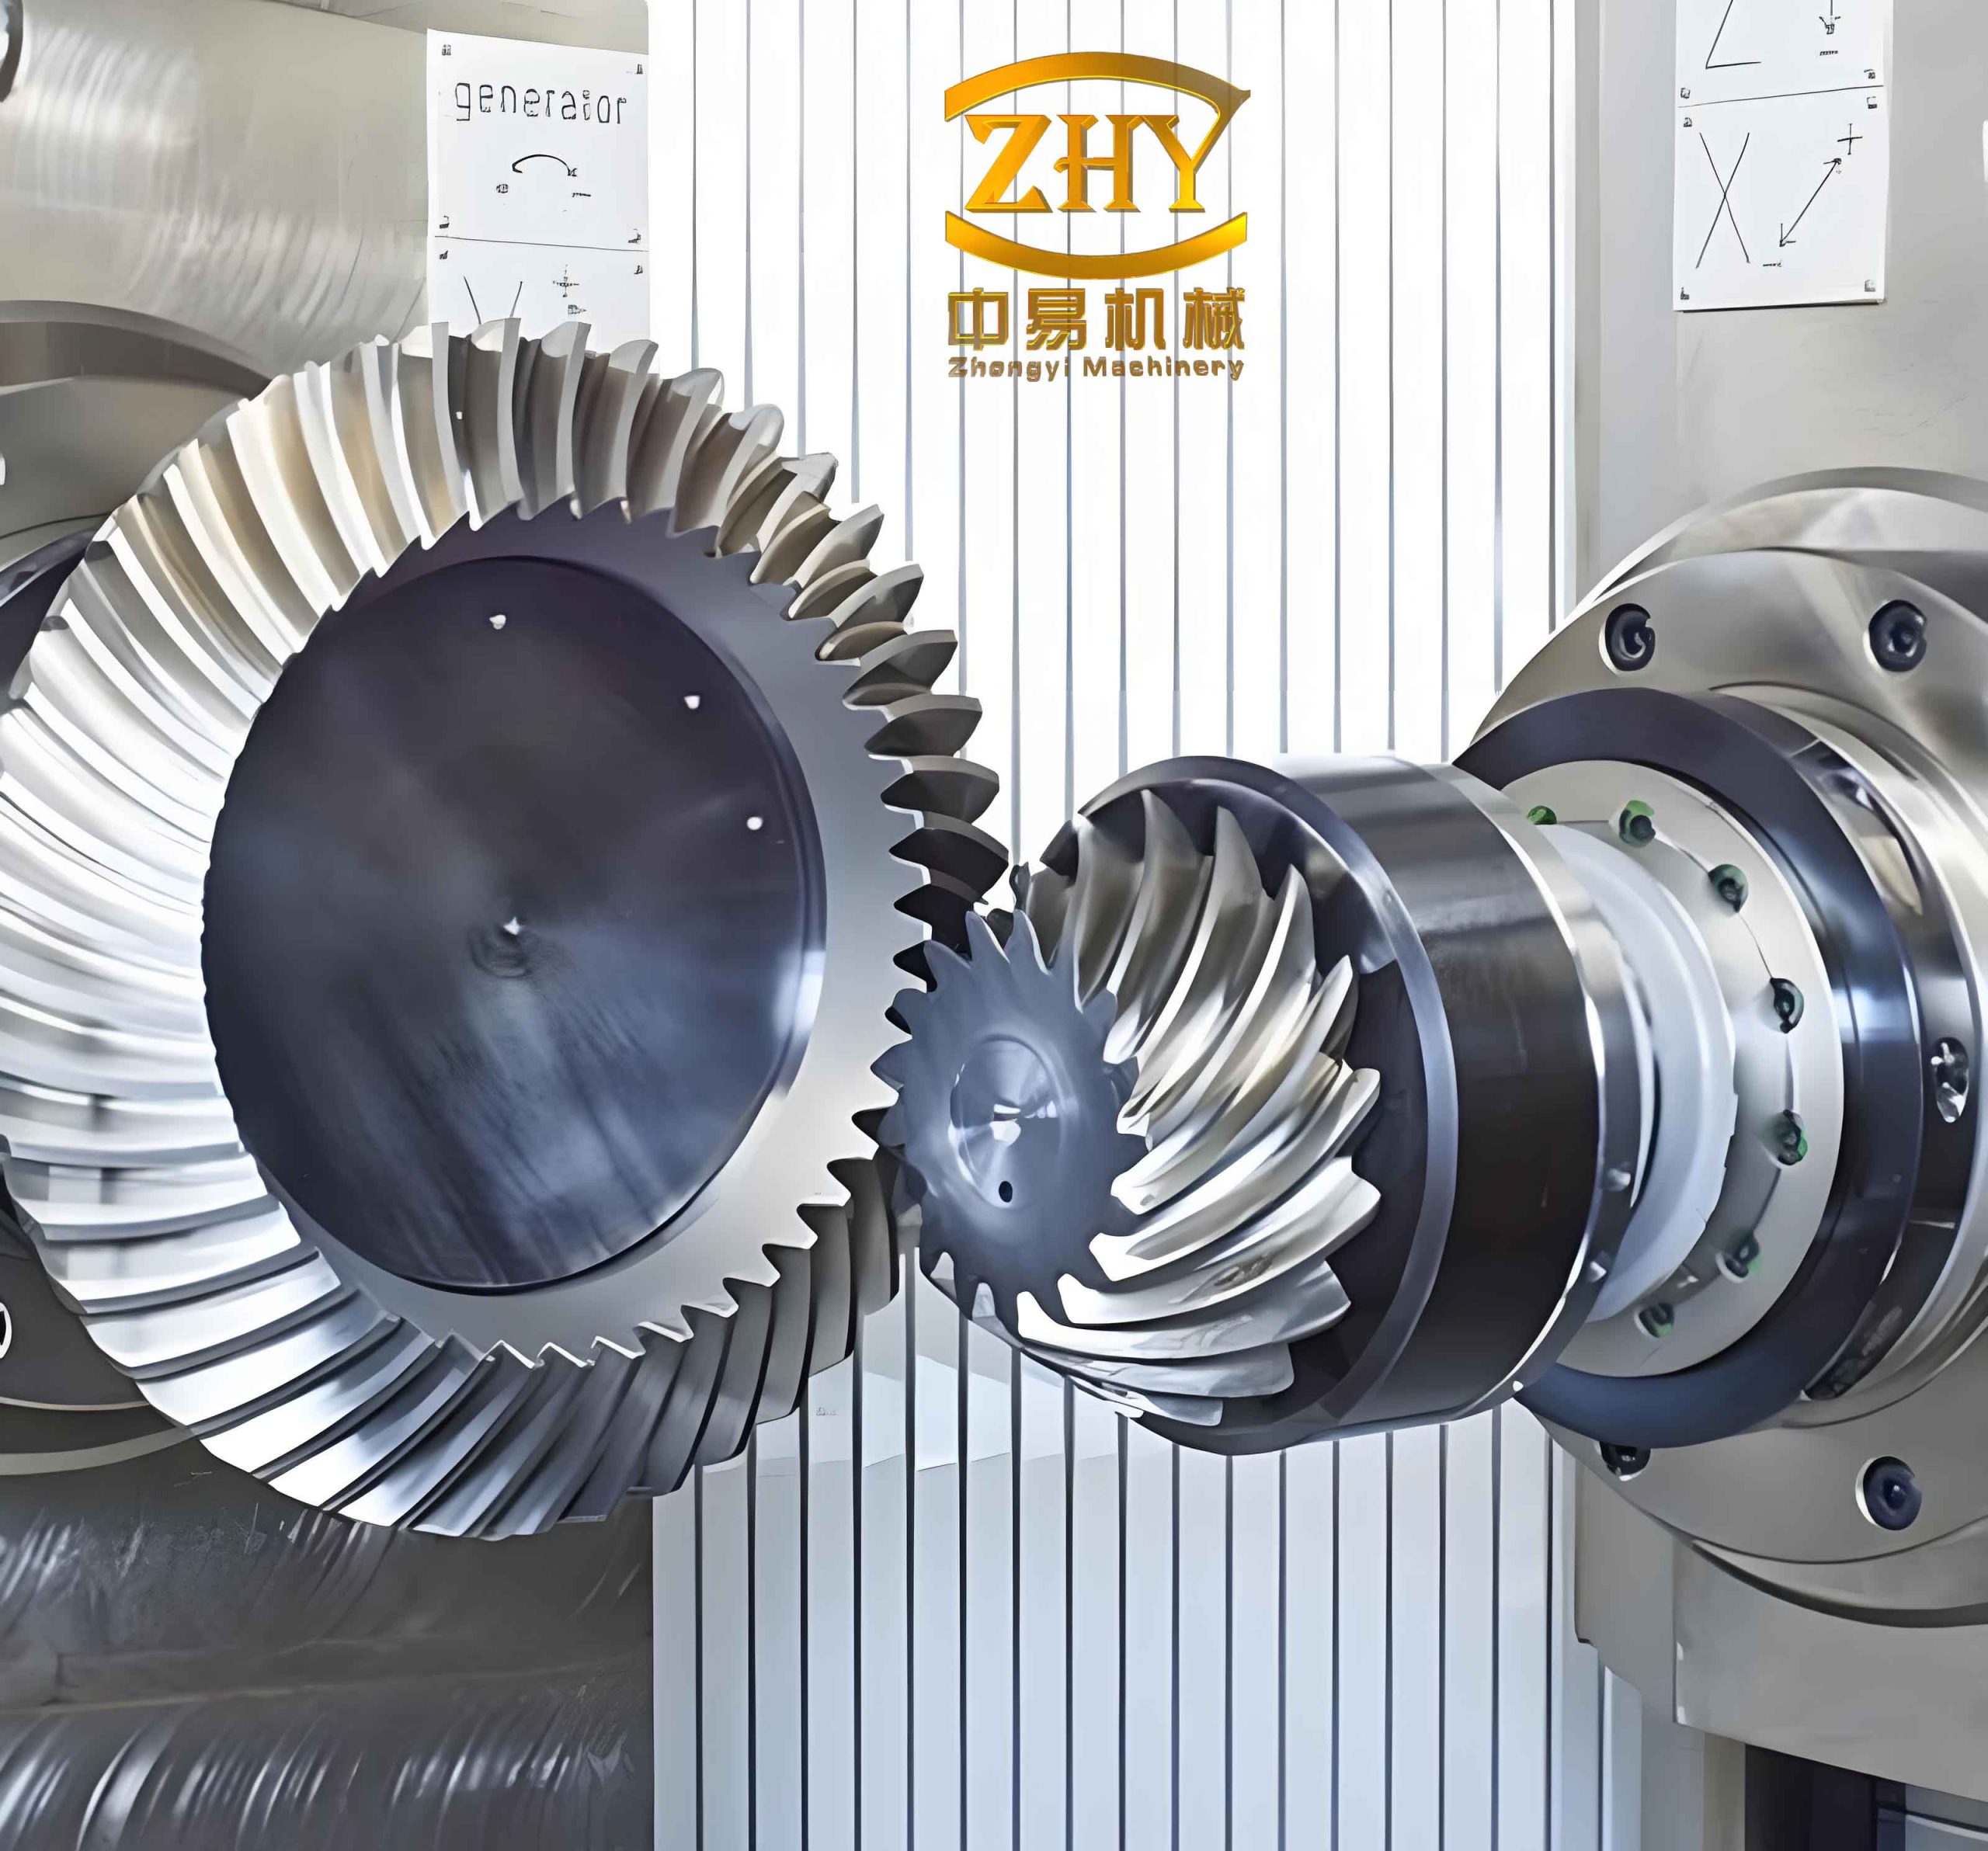
For the subsequent stress analysis, a high-fidelity finite element model is constructed. Given the symmetry and to manage computational cost, a sector model containing multiple teeth of the larger ring gear and the full pinion is typically employed. The choice of element type is critical for contact simulations. Second-order tetrahedral or hexahedral elements are often preferred in the contact regions to better capture stress gradients, while coarser meshing can be applied away from the zone of interest. A critical aspect is defining the surface-to-surface contact pairs between the potentially interacting flanks of the pinion and gear teeth. The material properties must be accurately defined. For automotive rear axle applications, case-hardened steels such as 20CrNiMo or similar alloys are standard. Their high core toughness and hard, wear-resistant surface layer are ideal for resisting contact fatigue. The essential material properties required for the model include:
| Material Property | Symbol | Typical Value (e.g., 20CrNiMo) |
|---|---|---|
| Young’s Modulus | \( E \) | 206 GPa |
| Poisson’s Ratio | \( \nu \) | 0.3 |
| Ultimate Tensile Strength | \( \sigma_u \) | ~1600 MPa |
| Yield Strength | \( \sigma_y \) | ~785 MPa |
The boundary conditions and load application must simulate the real meshing process. This involves constraining the gear hubs appropriately and applying a rotational displacement or torque to the pinion while allowing the ring gear to react. To avoid numerical instability, the analysis is often broken into steps: an initial “approach” step to establish contact, followed by the main loading step where the full torque is applied through a rotational boundary condition. Solving this nonlinear contact problem yields the detailed stress field across the meshing teeth, most importantly, the time-history of the maximum contact (Hertzian) stress at the potential failure site, which is typically near the center of the tooth flank.
Development of a Representative Service Load Spectrum
A gear in an automotive axle does not experience a single, constant torque. The input load is a stochastic process influenced by engine torque fluctuations, transmission shifts, vehicle acceleration/deceleration, and varying road resistance. Predicting fatigue life based on a nominal maximum torque is overly simplistic and non-conservative. A mission profile, or load spectrum, that statistically represents the distribution of loads over time is essential. This process begins with the acquisition of real-world data, typically torque measured at the pinion or axle shaft over a significant driving period encompassing various conditions (city, highway, mountain passes, etc.).
The raw torque-time signal, \( T(t) \), is then processed using cycle counting algorithms to reduce the complex history into a set of simple, constant-amplitude cycles that are equivalent in terms of fatigue damage. The most prevalent method is the Rainflow Counting algorithm. This algorithm identifies closed hysteresis loops in the stress/strain response, effectively extracting the ranges (amplitudes) and means of the load cycles from the time series. The output is a bivariate distribution: a list of torque amplitudes, \( T_a \), and their corresponding mean values, \( T_m \), along with their frequencies of occurrence.
Statistical analysis reveals that for vehicle components, load amplitudes often follow a Weibull distribution, while the mean loads tend to follow a Gaussian (Normal) distribution. The probability density functions (PDFs) are given by:
Weibull Distribution (Amplitude):
$$ f(T_a) = \frac{\alpha}{\beta} \left( \frac{T_a}{\beta} \right)^{\alpha – 1} e^{-(T_a / \beta)^\alpha} $$
where \( \alpha \) is the shape parameter and \( \beta \) is the scale parameter.
Gaussian Distribution (Mean):
$$ f(T_m) = \frac{1}{\sigma \sqrt{2\pi}} e^{-\frac{1}{2}\left( \frac{T_m – \mu}{\sigma} \right)^2} $$
where \( \mu \) is the mean value and \( \sigma \) is the standard deviation.
Measured data is usually limited. To extrapolate to the full life of the component (e.g., \( 10^6 \) cycles or more), the statistical distributions are used. The maximum expected load amplitude, \( T_{a,max} \), for a target probability of exceedance (e.g., \( 10^{-6} \)) is found by solving:
$$ P(T_a > T_{a,max}) = \int_{T_{a,max}}^{\infty} f(T_a) \, dT_a = 10^{-6} $$
A similar calculation is performed for the mean load. The full range of amplitudes and means is then divided into a number of levels (commonly 8 levels, as per established standards like the FZG standard). A two-dimensional load spectrum table is created, where each cell represents the number of cycles \( n_{ij} \) occurring at a specific combination of amplitude level \( i \) and mean level \( j \). This table is often condensed into a one-dimensional “programmed load spectrum” – a sequence of constant-amplitude load blocks that reproduce the cumulative damage of the stochastic history. A simplified 8-level spectrum might look like this:
| Block | Torque Amplitude \(T_a\) (Nm) | Torque Mean \(T_m\) (Nm) | Cycles \(n_i\) |
|---|---|---|---|
| 1 | 480 | 200 | 727,050 |
| 2 | 1,053 | 500 | 133,080 |
| 3 | 1,625 | 800 | 63,256 |
| 4 | 2,221 | 1,100 | 33,140 |
| 5 | 2,804 | 1,400 | 17,234 |
| 6 | 3,286 | 1,650 | 8,872 |
| 7 | 3,675 | 1,850 | 4,273 |
| 8 | 3,860 | 1,950 | 3,281 |
Contact Stress Analysis under Spectrum Loading
With the load spectrum defined, the next step is to map each torque level to a corresponding contact stress level on the hyperboloid gear tooth flank. Running a full nonlinear finite element analysis for every single cycle in the spectrum is computationally prohibitive. Instead, a stress-life (S-N) curve for the gear contact is established through a series of key simulations.
Finite element analyses are performed for a select set of constant torque levels covering the range from minimum to maximum. For each simulation, the maximum contact stress \( \sigma_{H} \) on the gear tooth is extracted. A typical stress distribution shows an elliptical contact patch, with the maximum stress located centrally. The relationship between applied pinion torque \( T \) and the resulting maximum contact stress is highly linear within the elastic range, allowing for a simple linear calibration:
$$ \sigma_{H} = k \cdot T + c $$
where \( k \) is the slope (stress per unit torque) and \( c \) is a constant intercept. For example, a calibration might yield:
$$ \sigma_{H} ( \text{MPa} ) = 0.16 \cdot T ( \text{Nm} ) + 525.9 $$
This equation serves as a transfer function to quickly convert any torque level from the load spectrum into its corresponding contact stress amplitude (\( \sigma_a \)) and mean stress (\( \sigma_m \)).
Fatigue Life Prediction Methodology
The high-cycle fatigue life prediction for the hyperboloid gear integrates the load spectrum, the stress conversion, and material fatigue properties through cumulative damage theory.
Material S-N Curve and Mean Stress Correction
The baseline fatigue data is the material’s S-N curve (Stress vs. Number of cycles to failure), typically obtained for fully reversed loading (\( R = -1 \)). For high-strength steels, the Basquin equation models the high-cycle region:
$$ \sigma_a = \sigma_f’ (2N_f)^b $$
where \( \sigma_a \) is the stress amplitude, \( \sigma_f’ \) is the fatigue strength coefficient, \( 2N_f \) is the number of reversals to failure, and \( b \) is the fatigue strength exponent.
However, the load spectrum contains cycles with non-zero mean stress (\( \sigma_m \neq 0 \)). Mean stress significantly affects fatigue life; tensile mean stress is detrimental, while compressive mean stress can be beneficial. The Goodman relation is a widely used model to correct the fully reversed fatigue strength \( \sigma_{-1} \) for the effect of mean stress:
$$ \sigma_a = \sigma_{-1} \left( 1 – \frac{\sigma_m}{\sigma_u} \right) $$
Here, \( \sigma_a \) is the allowable stress amplitude for a given mean stress \( \sigma_m \) and ultimate strength \( \sigma_u \). This equation is rearranged to find the equivalent fully reversed stress amplitude \( \sigma_{ar} \) for any cycle with amplitude \( \sigma_a \) and mean \( \sigma_m \):
$$ \sigma_{ar} = \frac{\sigma_a}{1 – \frac{\sigma_m}{\sigma_u}} $$
This equivalent stress is then used with the fully reversed S-N curve to find the fatigue life \( N_i \) for that specific cycle in the spectrum.
Cumulative Damage Models
To assess damage from the entire sequence of varying load cycles, cumulative damage rules are applied. Three classical theories are commonly evaluated for hyperboloid gear applications:
1. Miner’s Linear Damage Rule (Palmgren-Miner Rule):
This is the simplest and most common approach. It postulates that damage from each cycle is independent and linearly cumulative. The total damage \( D \) is:
$$ D = \sum_{i=1}^{k} \frac{n_i}{N_i} $$
where \( n_i \) is the number of cycles applied at stress level \( i \), and \( N_i \) is the number of cycles to failure at that same level from the S-N curve. Failure is predicted when \( D \geq 1 \). The total life in blocks is then \( 1/D \). While simple, it ignores load sequence effects (e.g., a high load followed by low loads may cause more damage than the linear sum).
2. Manson’s Double Linear Damage Rule:
This model attempts to account for sequence effects by conceptually separating the fatigue process into two phases: crack initiation (\( Phase I \)) and crack propagation (\( Phase II \)). The model requires the S-N data for two specific stress levels from the spectrum: the highest (\( \sigma_{max} \)) and the lowest (\( \sigma_{min} \)). The life at any level \( i \) is partitioned:
$$ N_{i, I} = N_i \exp(Z N_i^\phi), \quad N_{i, II} = N_i – N_{i, I} $$
where \( Z \) and \( \phi \) are parameters derived from \( N_{max} \) and \( N_{min} \). Damage is accumulated separately for each phase:
$$ D_I = \sum \frac{n_i}{N_{i, I}}, \quad D_{II} = \sum \frac{n_i}{N_{i, II}} $$
Failure occurs when both \( D_I \geq 1 \) and \( D_{II} \geq 1 \). The total life is the sum of the lives from each phase.
3. Corten-Dolan Nonlinear Damage Theory:
This theory explicitly models interaction effects, where a high-stress cycle not only causes its own damage but also influences the damage rate of subsequent lower-stress cycles. The life under spectrum loading \( N_g \) is given by:
$$ N_g = \frac{N_1}{\sum_{i=1}^{k} \alpha_i \left( \frac{\sigma_i}{\sigma_1} \right)^d} $$
where \( N_1 \) is the life at the highest stress level \( \sigma_1 \), \( \alpha_i \) is the fraction of cycles at level \( i \), and \( d \) is an empirical material constant (often related to the slope \( m \) of the S-N curve, e.g., \( d/m \approx 0.85 \)). This model generally yields more conservative (shorter) life predictions than Miner’s rule when high loads are present.
Results and Comparative Discussion
Applying the described methodology—converting the 8-level torque spectrum to contact stress, correcting for mean stress via Goodman, and calculating the cycles to failure for each level from the material S-N curve—allows for the computation of total damage per spectrum block. The predicted fatigue life, in terms of the number of complete spectrum blocks until failure, varies significantly based on the chosen cumulative damage rule.
| Cumulative Damage Theory | Calculated Damage per Block (D) | Predicted Fatigue Life (Blocks) | Relative Outcome |
|---|---|---|---|
| Miner’s Linear Rule | 4.5 × 10⁻⁹ | 2.2 × 10⁸ | Most Optimistic |
| Manson’s Double Linear Rule | ~6.1 × 10⁻⁹ | ~1.64 × 10⁸ | Moderate |
| Corten-Dolan Theory | ~6.2 × 10⁻⁹ | ~1.62 × 10⁸ | Most Conservative |
The results highlight a critical engineering insight. While all three predictions are of the same order of magnitude, Miner’s rule provides the longest life estimate. This is expected, as its linear, non-interactive nature tends to be non-conservative under variable amplitude loading containing high loads. Manson’s rule, by accounting for a two-stage failure process influenced by the extreme loads in the spectrum, predicts a life approximately 25% lower. The Corten-Dolan theory, which explicitly models the accelerating effect of high loads on subsequent damage accumulation, yields the most conservative estimate, nearly identical to Manson’s in this case but often lower in spectra with more severe overloads.
For the design and validation of automotive hyperboloid gears, this comparative analysis is invaluable. The choice of model involves a trade-off between simplicity and accuracy/conservatism. Miner’s rule, due to its simplicity, is deeply embedded in standards and initial design stages. However, for a definitive reliability assessment or when designing for a critical, high-performance application, the more conservative models like Corten-Dolan or a detailed fracture mechanics approach may be warranted. The framework established here allows engineers to bound the problem, understanding both the best-case and worst-case fatigue scenarios for the hyperboloid gear set under its specific mission profile.
Conclusion
This study has delineated a systematic and comprehensive framework for the high-cycle contact fatigue life assessment of automotive rear axle hyperboloid gears. The methodology successfully bridges the gap between high-fidelity mechanical modeling and the stochastic reality of service loading. By generating a precise finite element model to establish the torque-stress relationship, processing real-world operational data into a statistically valid load spectrum, and applying fundamental fatigue principles with mean stress correction, a robust predictive capability is achieved.
The core findings underscore the paramount importance of considering variable amplitude loading, as encapsulated in a load spectrum, rather than relying on single-point constant amplitude analyses. Furthermore, the comparative evaluation of cumulative damage rules reveals that the choice of fatigue accumulation model has a significant impact on the predicted life, with variations of 25% or more observed between the common Miner’s rule and more sophisticated models like Manson’s or Corten-Dolan’s. For critical durability validation, employing a conservative theory such as Corten-Dolan is advisable to account for load interaction effects that are absent in the linear model.
This integrated approach, combining geometry, mechanics, statistics, and materials science, provides a powerful tool for the design engineer. It enables the optimization of hyperboloid gear geometry and material selection against target durability goals, the planning of accelerated bench tests using the derived load spectrum, and ultimately, the enhancement of the reliability and longevity of the automotive drivetrain. Future work may involve coupling this stress-life approach with more detailed fracture mechanics models for crack growth prediction and incorporating the effects of residual stresses from manufacturing processes like carburizing and shot peening, further refining the accuracy of life predictions for these essential mechanical components.