
The pursuit of optimal performance, durability, and acoustic refinement in automotive drivetrains brings a critical component into sharp focus: the final drive gearset. In many rear-wheel-drive and all-wheel-drive vehicles, this crucial role is fulfilled by hyperboloidal gears, commonly known as hypoid gears. Their unique geometry allows for a substantial offset between the pinion and ring gear axes, enabling a lower center of gravity and more efficient packaging within the drive axle assembly. However, this very complexity makes their contact behavior under real-world operating conditions a paramount concern for design engineers. Traditional design-phase analysis often falls short of predicting actual performance because it fails to account for the systemic deflections of the entire axle system under load. This article delves into a comprehensive methodology for analyzing the loaded performance of hyperboloidal gears, bridging the gap between theoretical design and operational reality.
The foundational step in gear design is Tooth Contact Analysis (TCA). This process simulates the meshing of perfectly rigid gear teeth under no-load or very light load conditions. It provides essential insights into the contact pattern location, shape, and the resulting transmission error (TE)—the deviation from perfectly uniform angular velocity transfer, which is a primary exciter of gear noise. For hyperboloidal gears, TCA involves solving complex mathematical models derived from the gear machining process. The basic coordinate transformation from the tool to the gear surface can be represented generically. For a gear surface point $\mathbf{r}$, it is generated via the machine kinematics:
$$ \mathbf{r}(u, \theta, \phi) = [M_{tool}^{gear}(\phi)] \cdot \mathbf{r}_{tool}(u, \theta) $$
where $u$ and $\theta$ are surface parameters, $\phi$ is the machine rotation angle, and $[M]$ is the transformation matrix encapsulating all machine settings (tilt, swivel, offsets, etc.). TCA then solves for the conditions of continuous tangency between the pinion and gear surfaces under rotation, finding the contact path and the function relating pinion rotation $\phi_p$ to gear rotation $\phi_g$, from which TE is calculated as $TE(\phi_p) = \phi_g / \tau – \phi_p$, with $\tau$ being the gear ratio. While invaluable, this analysis presents a “blueprint” state, assuming ideal alignment and rigid components.
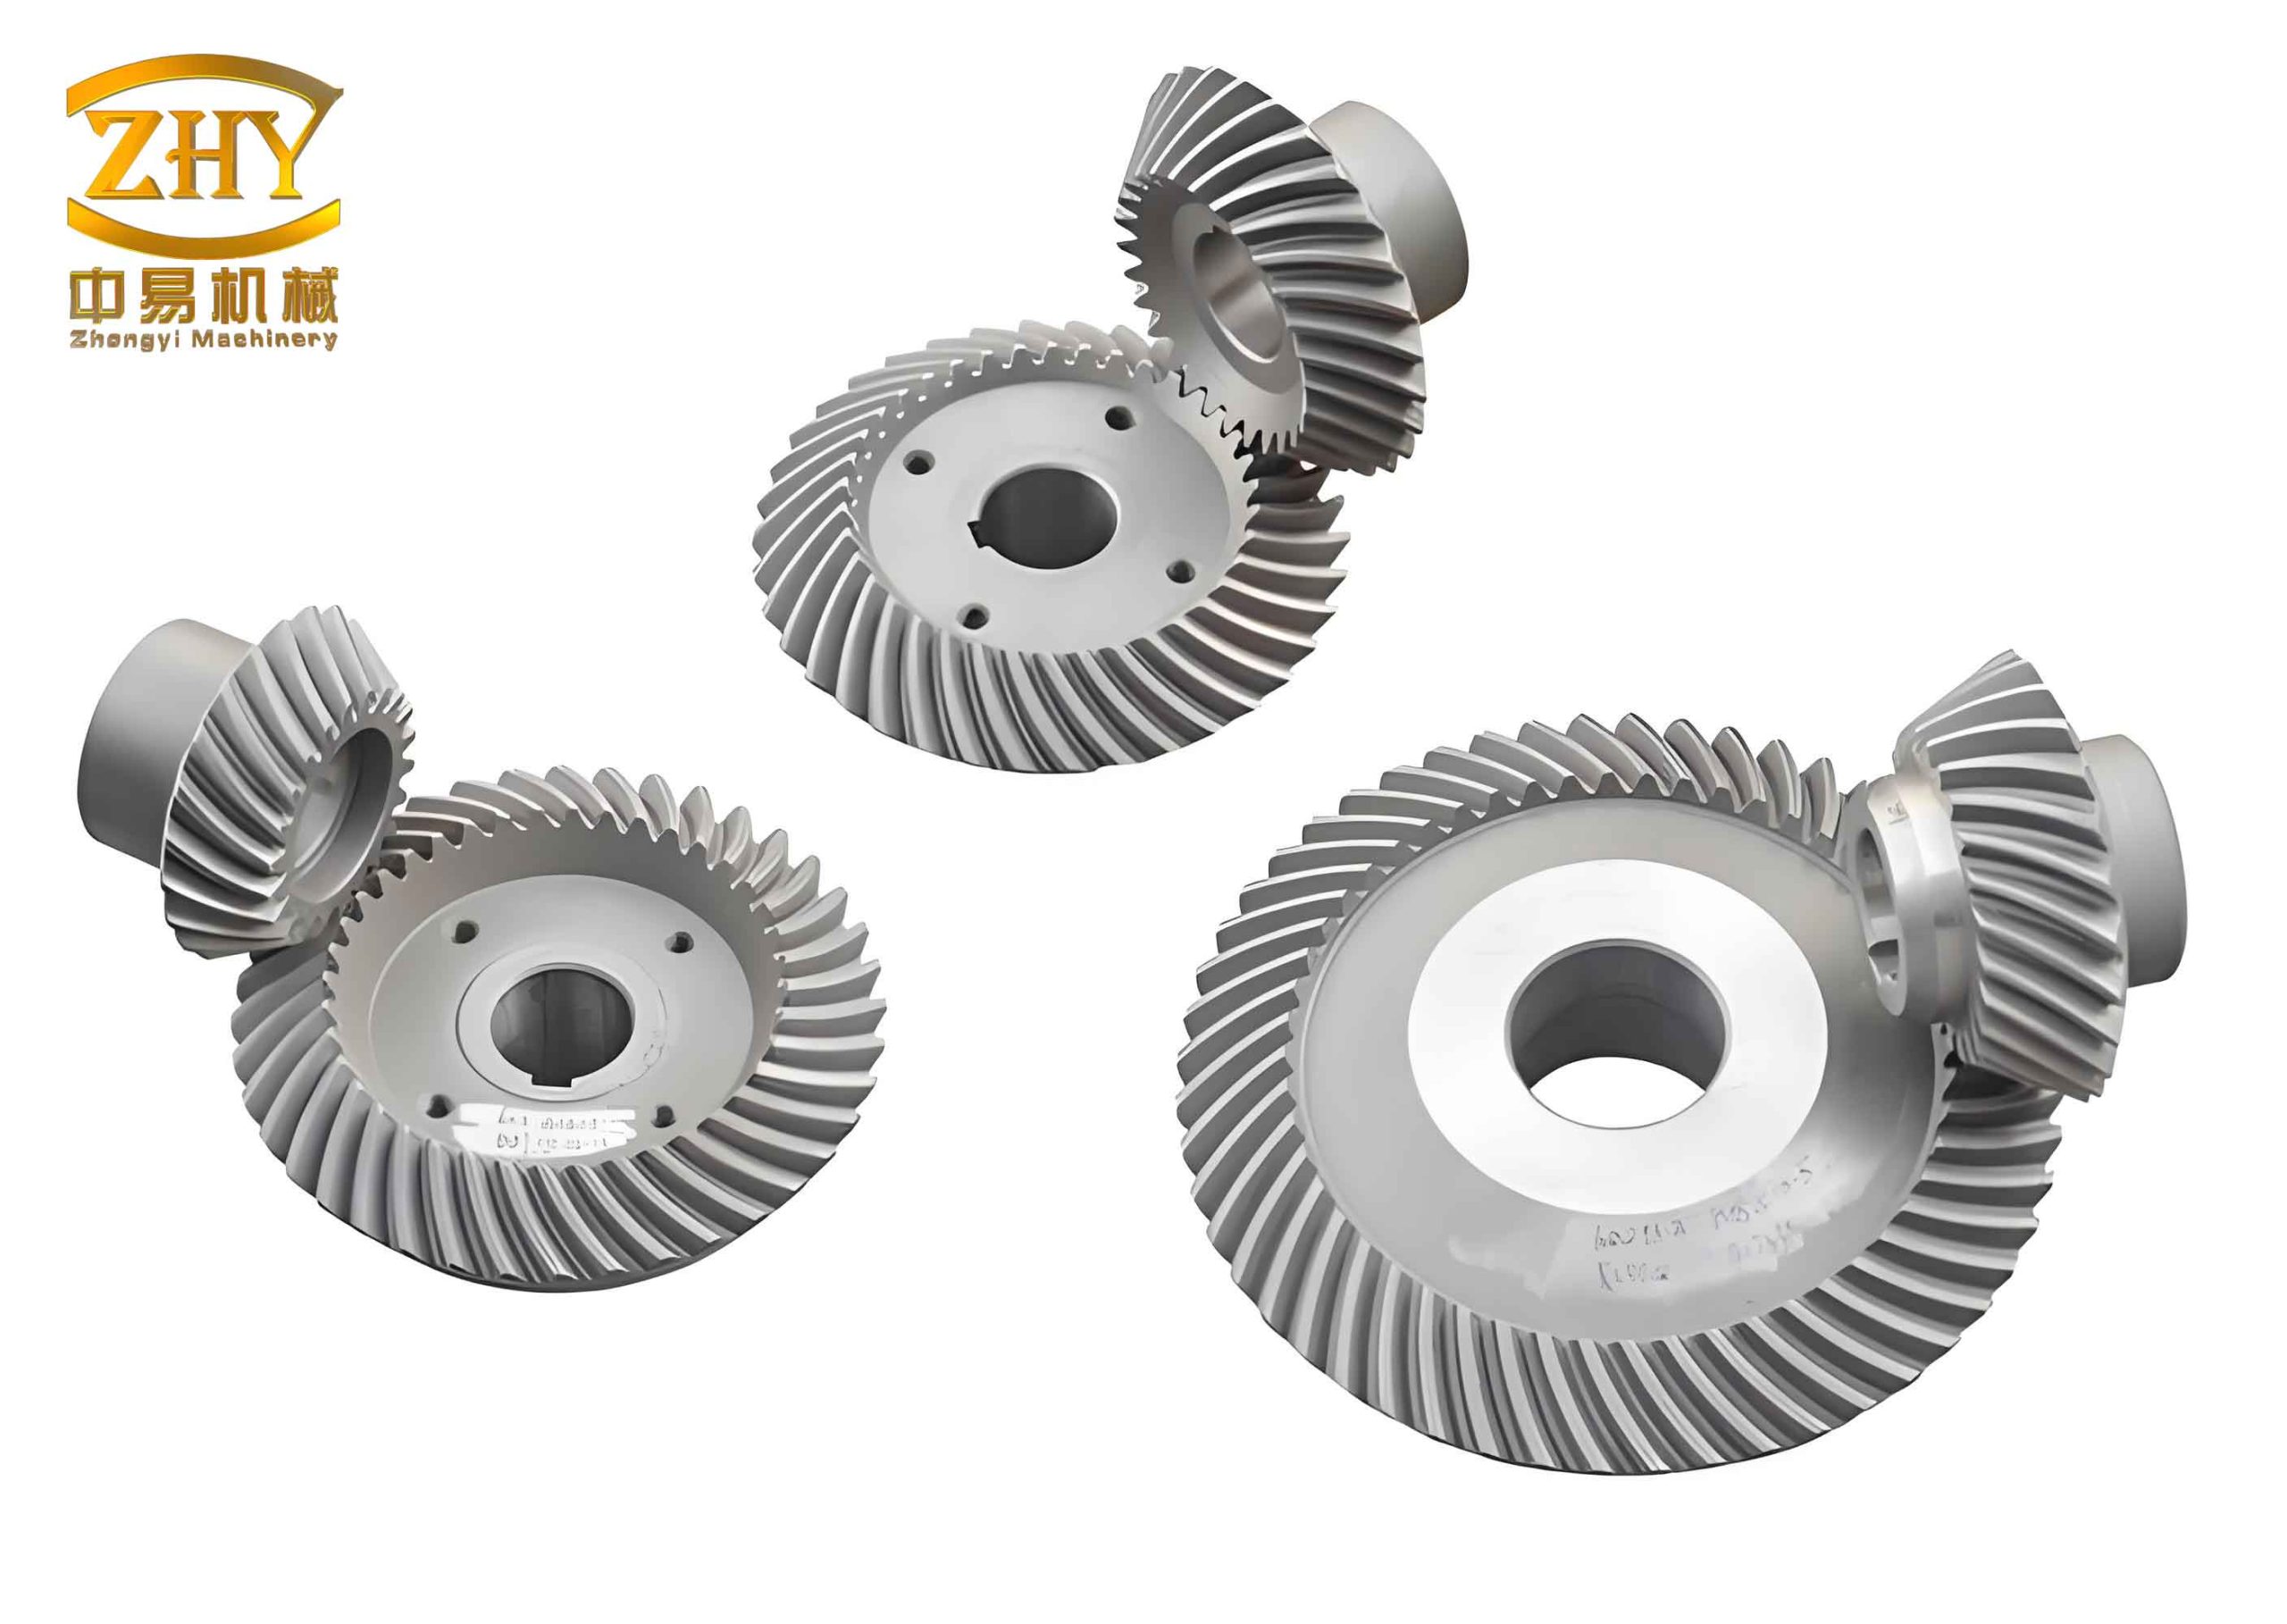
The reality within a working drive axle is starkly different. When torque is applied, significant forces are transmitted through the gear teeth to their supporting bearings and housing structures. These forces cause deflections. The pinion and ring gear, mounted within a deformable housing (the differential carrier) which is itself bolted to the axle tube, undergo relative displacement. This displacement from the theoretically aligned position is known as misalignment. For hyperboloidal gears, the critical misalignments are defined with respect to the pinion axis and its theoretical position relative to the ring gear. They are typically categorized as:
- Pinion Offset (ΔE): The vertical displacement of the pinion axis relative to the ring gear axis.
- Pinion Advance/Retreat (ΔXp): The axial movement of the pinion along its own axis.
- Gear Offset (ΔXg): The axial movement of the ring gear along its axis.
- Axis Angle Error (ΔΣ): A slight change in the nominal 90-degree intersection angle between the axes.
These misalignments are not manufacturing errors, but elastic deformations induced by load. They dramatically alter the contact pattern, pressure distribution, and transmission error compared to the TCA results. Therefore, moving from TCA to Loaded Tooth Contact Analysis (LTCA) is not merely an option but a necessity for accurate performance prediction. LTCA incorporates the elastic deflections of the gear teeth themselves (bending, shear, contact deformation) and the system-level misalignments calculated from the deflection of the entire assembly.
To perform a system-aware LTCA, a full virtual prototype of the drive axle is constructed. This model includes not just the detailed geometry of the hyperboloidal gears, but also the housing, bearings, and shafts. A finite element (FE) model of the housing is created and integrated. System deflection analysis is run for specific input torque loads. This analysis calculates the resulting bearing reactions and housing deformations to output the precise misalignment values (ΔE, ΔXp, etc.) for each load case. The following table exemplifies the kind of data generated, showing how misalignments grow non-linearly with applied torque.
| Input Torque (Nm) | ΔXp (μm) | ΔXg (μm) | ΔE (μm) | ΔΣ (mrad) |
|---|---|---|---|---|
| 100 | 17.5 | -22.5 | -41.4 | 0.132 |
| 200 | 41.5 | -39.1 | -77.3 | 0.262 |
| 300 | 66.5 | -54.4 | -113.2 | 0.388 |
| 400 | 91.0 | -70.3 | -149.1 | 0.514 |
With these load-dependent misalignments determined, the LTCA for the hyperboloidal gears is performed. The gear pair’s finite element model, incorporating detailed tooth geometry, is solved iteratively. The analysis finds the equilibrium state where the sum of contact forces balances the input torque, while satisfying the geometric constraints imposed by the misaligned positions and the elastic deformation of the teeth. The outputs are comprehensive: the loaded contact pattern, the loaded transmission error (LTE), and the distribution of contact stress (pressure) across the tooth face.
The evolution of the contact pattern with load is a critical observation. Under a light “roll test” load (mimicking the TCA condition), the contact patch is typically centered slightly toward the toe and heel to allow for a favorable shift under load. As torque increases and misalignments grow, the contact patch expands and migrates. For a correctly designed set of hyperboloidal gears, the patch should move centrally, avoiding the thin edges (toe, heel, top, and root) to prevent stress concentrations and edge loading. The contact stress $\sigma_c$ can be estimated conceptually by the Hertizian theory for curved surfaces, though LTCA provides a precise numerical distribution:
$$ \sigma_{c, max} \propto \sqrt[3]{ \frac{F_n E^*}{R^2} } $$
where $F_n$ is the normal tooth load, $E^*$ is the combined modulus of elasticity, and $R$ is the effective relative radius of curvature at the contact point. LTCA shows how $\sigma_{c, max}$ and its location change with applied torque.
Similarly, the Loaded Transmission Error curve changes shape and magnitude. While unloaded TE might be a symmetric, low-amplitude parabola, LTE typically shows increased amplitude and may become asymmetric due to the nonlinear effects of deflection and misalignment. Minimizing the amplitude and smoothing the harmonics of LTE is a direct path to reducing gear whine noise. The following table contrasts key performance indicators between the unloaded (TCA) and loaded (LTCA) states for a typical hyperboloidal gear set.
| Performance Metric | TCA (Unloaded/Blueprint) | LTCA (Under High Load) | Design Implication |
|---|---|---|---|
| Contact Pattern Location | Centered or slight bias | Shifts significantly (e.g., towards mid-face) | Must design initial pattern to *shift into* optimal zone under load. |
| Contact Pattern Size | Moderate, defined by ease-off topography | Larger due to tooth deflection flattening contact | Must ensure expanded patch stays clear of edges. |
| Transmission Error Amplitude | Low, controlled by ease-off | Higher, often with altered harmonic content | Primary driver for noise; target is to minimize LTE amplitude. |
| Peak Contact Stress | Not directly calculated | Explicitly calculated, location is critical | Must be below material endurance limit for required life (pitting resistance). |
| Root Bending Stress | Not calculated | Explicitly calculated | Must be below material fatigue strength for required life (root breakage). |
The ultimate validation of this virtual analysis comes from physical testing. A gearset, manufactured precisely to the design specifications (including tooth surface modifications or “ease-off”), is assembled into a complete drive axle. This axle is then mounted on a dynamometer test rig capable of applying controlled torque loads while potentially measuring vibration and noise. By applying a marking compound to the gear teeth and running the axle under various torque conditions, the actual loaded contact pattern can be recorded. The correlation between these physical patterns and the LTCA-predicted patterns is the gold standard for validating the model. A successful design shows the physical contact patch migrating and sizing in a manner highly consistent with the simulation, confirming that the system deflections and tooth deformations were accurately captured. This process closes the loop between design and reality for hyperboloidal gears.
In conclusion, the performance of hyperboloidal gears in automotive axles is intrinsically linked to their behavior under operating loads. Isolated tooth analysis is insufficient. A robust engineering process must integrate system-level deflection analysis to predict realistic gear mesh misalignments, feed these into a detailed Loaded Tooth Contact Analysis model of the gear pair, and validate the results against physical bench tests. This holistic approach enables engineers to proactively design tooth surface geometry (ease-off) that anticipates and compensates for load-induced deflections. The goal is to achieve a stable, centrally located contact pattern, minimized loaded transmission error, and acceptable stress levels across the entire operating envelope. Mastering this analytical chain is essential for developing durable, efficient, and quiet drive axles, pushing the boundaries of performance for the hyperboloidal gears at their heart.