
The reliable transmission of motion and power is a cornerstone of mechanical engineering, and among the various mechanisms employed, the spur and pinion system stands as one of the most fundamental and widely used. Its simplicity, efficiency, and capacity for precise speed and torque conversion make it indispensable in countless applications, from automotive transmissions and industrial machinery to delicate instrument drives. However, the very surfaces that enable this power transmission—the meshing teeth of the spur and pinion—are also the site of complex tribological interactions that ultimately dictate the system’s performance, efficiency, and longevity. Friction at the gear tooth interface is not merely a source of energy loss; it is a critical factor influencing contact stresses, wear mechanisms, fatigue life, and vibrational noise. A deep understanding of these frictional characteristics is therefore paramount for advancing gear design towards higher loads, greater efficiencies, and extended service life.
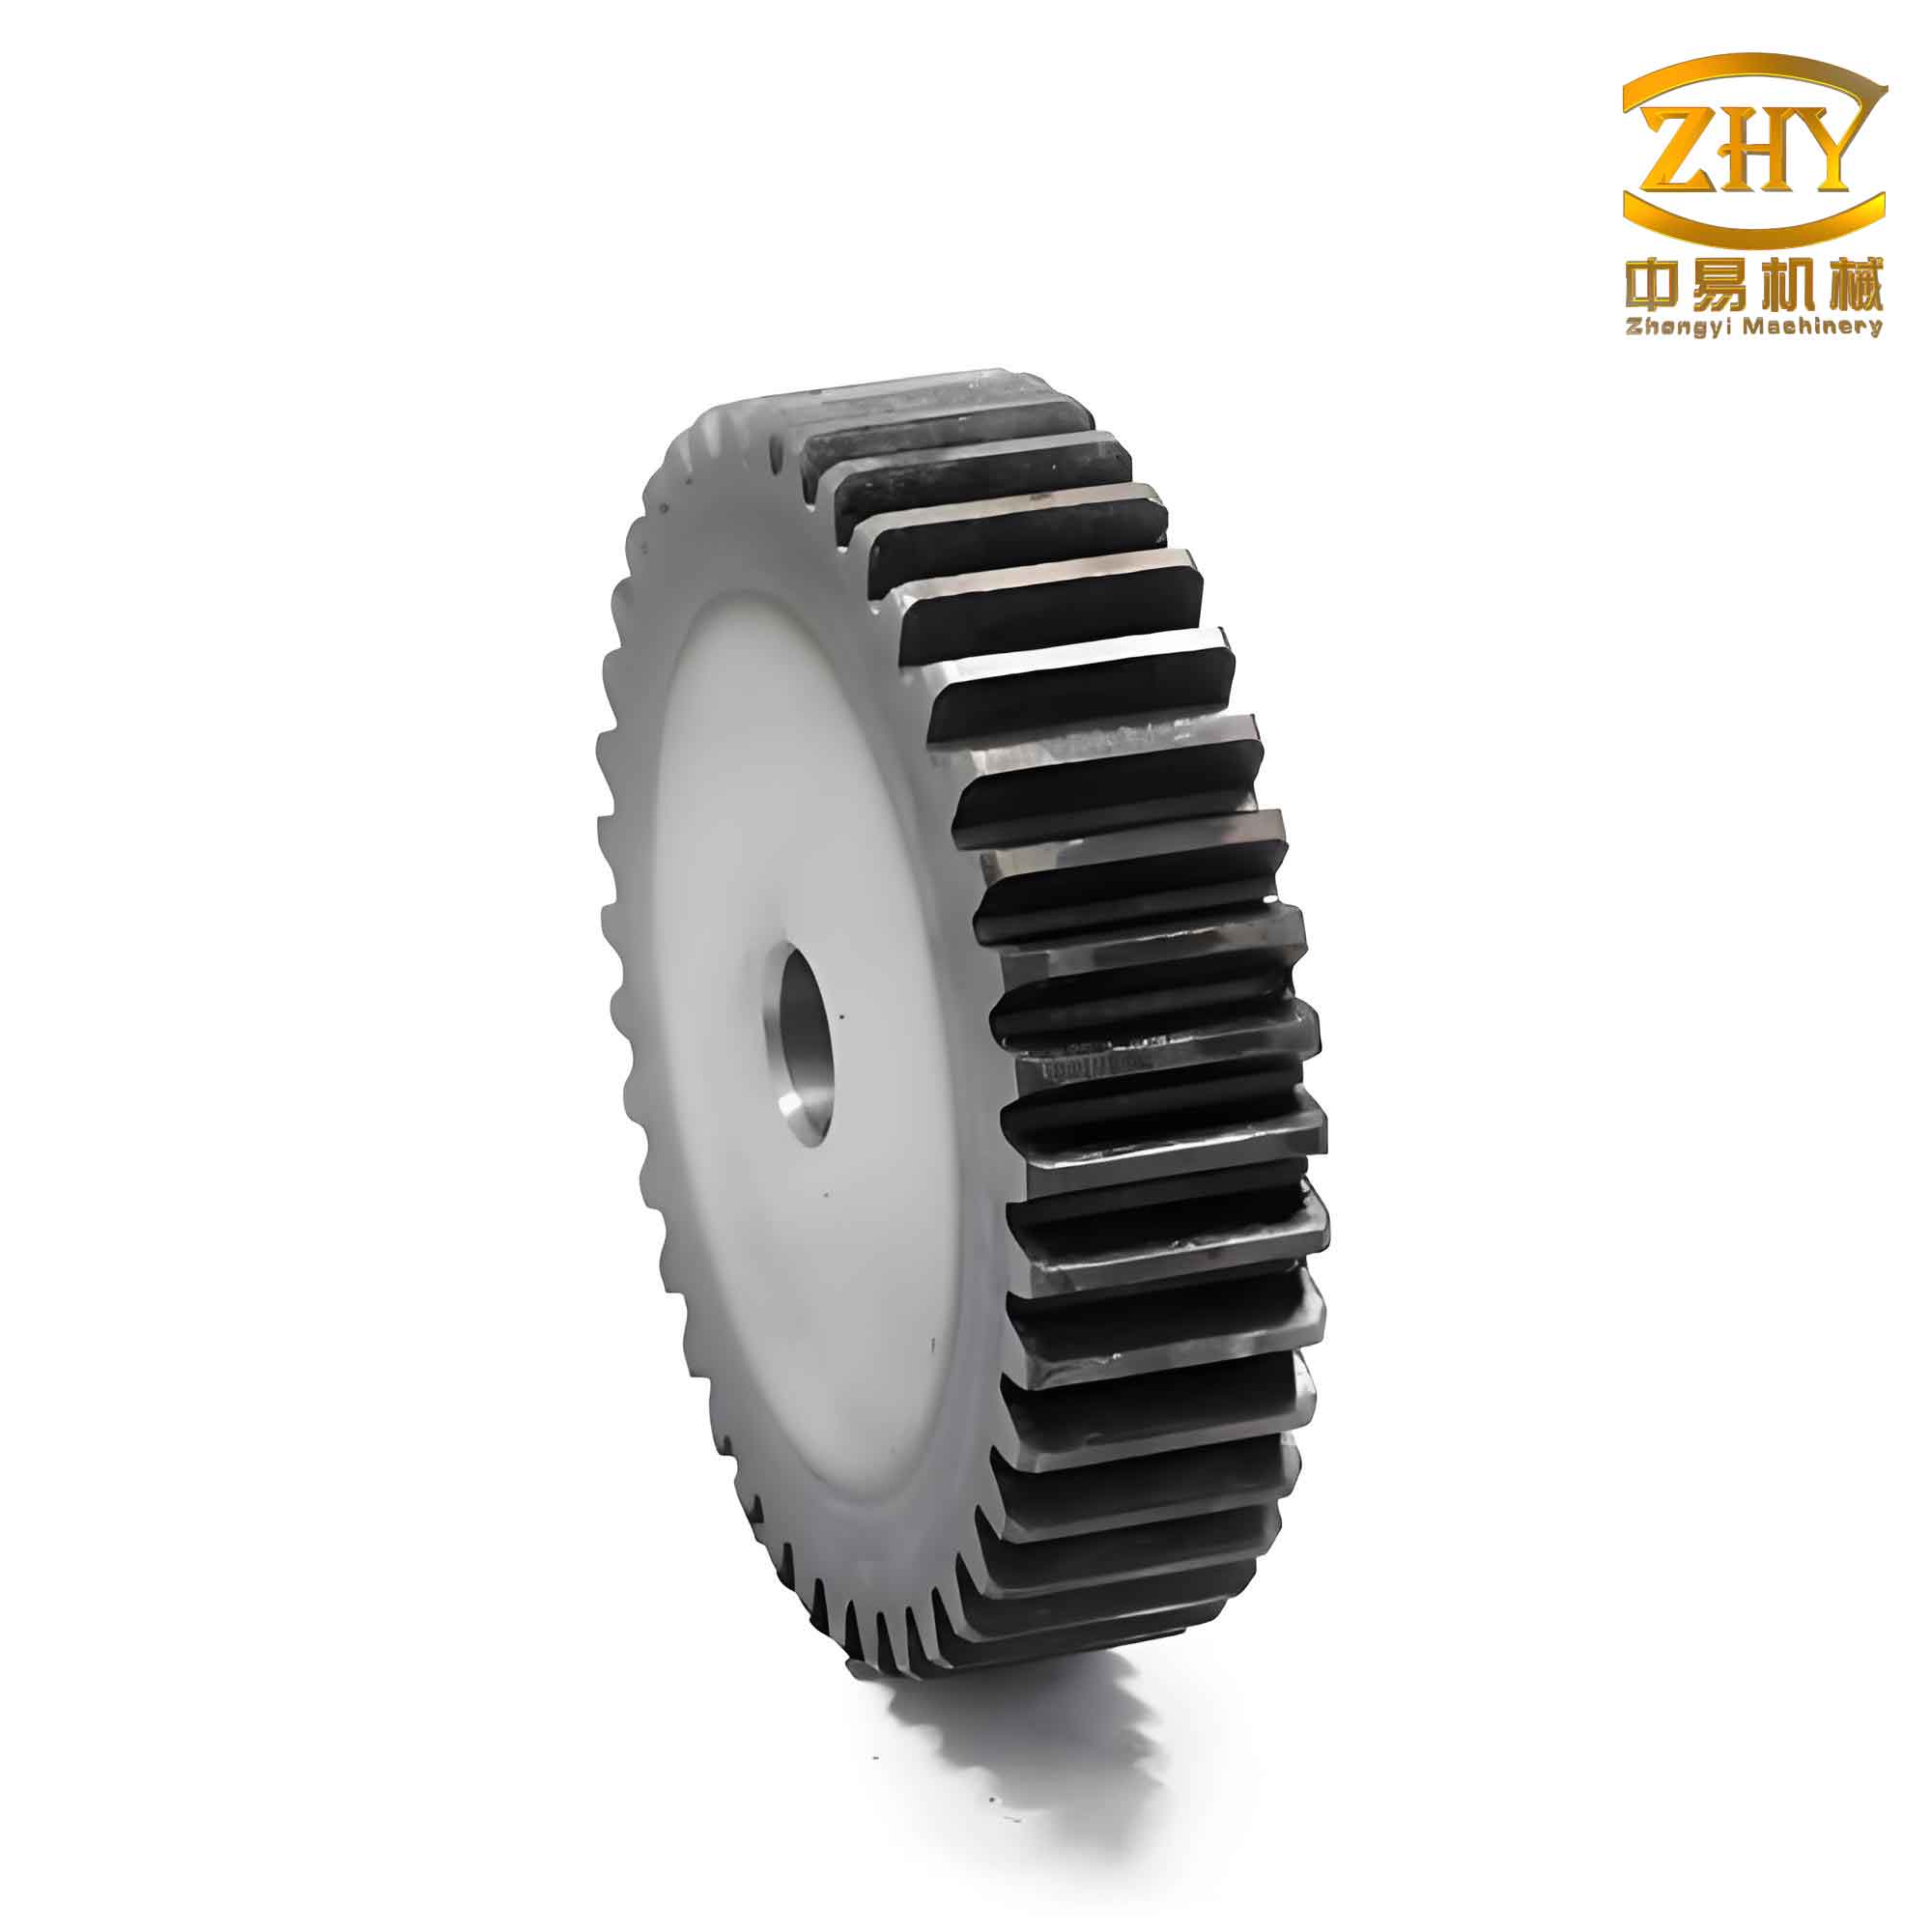
The analysis of spur and pinion systems has evolved significantly from classical Hertzian contact formulas to sophisticated computational techniques. Modern engineering relies heavily on Finite Element Analysis (FEA) to simulate the complex state of stress and deformation within gear teeth under load. By creating a detailed digital twin of the spur and pinion assembly, FEA allows engineers to probe conditions that are difficult or impossible to measure experimentally, such as the subsurface stress field or the precise distribution of contact pressure along the path of action. This capability is especially powerful when studying the influence of friction, a parameter that classical formulas often simplify or neglect. Integrating tribological models into FEA enables a coupled analysis where mechanical deformation and frictional forces interact, providing a far more realistic picture of gear tooth behavior. This article details a comprehensive methodology for constructing, simulating, and analyzing a spur and pinion pair, with a focused investigation on how the coefficient of friction governs key performance metrics like contact stress, frictional shear stress, and contact pressure.
Parametric Modeling of the Spur and Pinion Geometry
The foundation of any accurate simulation is a geometrically precise model. For involute spur gears, a parametric modeling approach is essential. This method defines the gear geometry through a set of fundamental parameters and mathematical relationships, ensuring accuracy and enabling easy modification for design iterations. The primary design parameters for a standard spur and pinion set are defined below.
| Parameter | Symbol | Formula / Value |
|---|---|---|
| Number of Teeth (Pinion) | \( z_1 \) | Design Input |
| Number of Teeth (Gear) | \( z_2 \) | Design Input |
| Module | \( m \) | Design Input |
| Pressure Angle | \( \alpha \) | Typically 20° |
| Face Width | \( b \) | Design Input |
| Addendum Coefficient | \( h_a^* \) | 1.0 (Standard) |
| Dedendum Coefficient | \( h_f^* \) | 1.25 (Standard) |
From these inputs, the key circle diameters for both the spur gear and the pinion are calculated. The pitch diameter is central to defining the gear mesh:
$$ d = m \cdot z $$
The radii of the other critical circles are derived as follows:
- Addendum Radius (Tip Radius): \( r_a = \frac{d}{2} + m \cdot h_a^* \)
- Dedendum Radius (Root Radius): \( r_f = \frac{d}{2} – m \cdot h_f^* \)
- Base Circle Radius: \( r_b = \frac{d}{2} \cdot \cos(\alpha) \)
The involute tooth profile, which ensures constant velocity ratio, is mathematically generated from the base circle. A parametric equation defines the coordinates of the involute curve as a function of an angle parameter \( t \):
$$
\begin{aligned}
x(t) &= r_b \left[ \sin(\theta(t)) – \theta(t) \cdot \cos(\theta(t)) \right] \\
y(t) &= r_b \left[ \cos(\theta(t)) + \theta(t) \cdot \sin(\theta(t)) \right]
\end{aligned}
$$
where \( \theta(t) = t \cdot \pi \) (in radians) and \( t \) varies to trace the profile from the root to the tip of the tooth. This curve is constructed in a Computer-Aided Design (CAD) software environment. A single tooth solid is created by extruding the profile along the face width. This tooth is then patterned circumferentially using the tooth count \( z \) to generate the complete spur or pinion body. Finally, the two gears are digitally assembled with their pitch circles tangent, establishing the correct center distance, \( a \), for a standard mesh:
$$ a = \frac{m \cdot (z_1 + z_2)}{2} $$
Finite Element Model Setup and Boundary Conditions
The assembled three-dimensional CAD model is imported into a Finite Element Analysis (FEA) software suite. To balance computational accuracy with resource efficiency, a sub-modeling strategy is often employed. Instead of analyzing the full spur and pinion wheels, a sector containing two or three meshing teeth is extracted. This sub-model must be constrained in a way that represents its connection to the rest of the gear body. The core steps in the FEA setup are as follows.
1. Material Property Definition: The spur and pinion are typically assigned the properties of common gear steels. For this analysis, a standard carbon steel is used.
| Property | Symbol | Value | Unit |
|---|---|---|---|
| Young’s Modulus | \( E \) | 210 | GPa |
| Poisson’s Ratio | \( \nu \) | 0.3 | – |
| Density | \( \rho \) | 7850 | kg/m³ |
| Yield Strength | \( \sigma_y \) | ≥ 350 | MPa |
2. Meshing: The geometry is discretized into finite elements. A critical region is the contact zone between the spur and pinion teeth. This area requires a refined, high-quality mesh to accurately capture the steep stress gradients. The rest of the tooth bodies can have a progressively coarser mesh. High-order tetrahedral or hexahedral elements are commonly used.
3. Defining Contact: A surface-to-surface contact pair is established between the potential contacting faces of the spur and pinion teeth. The pinion tooth surface is typically defined as the “contact” surface (master) and the gear tooth as the “target” surface (slave). The core of the friction analysis lies in the contact formulation. A Coulomb friction model is applied:
$$ f_s = \mu \cdot p $$
where \( f_s \) is the frictional shear stress, \( \mu \) is the coefficient of friction, and \( p \) is the contact pressure. The “Augmented Lagrange” or “Pure Penalty” contact algorithm is used to enforce this relationship, allowing for stick and slip conditions.
4. Applying Loads and Boundary Conditions (BCs): Realistic constraints are applied to simulate the gear’s operational mounting. The inner bore surfaces of both the spur and pinion models are constrained to represent their connection to shafts.
- Pinion (Driver): Nodes on the pinion bore are constrained in the radial direction to simulate a rigid shaft support. A rotational displacement (or torque) is applied about the pinion’s axis to represent the input drive.
- Spur Gear (Driven): Nodes on the spur gear bore are fully constrained in all translational degrees of freedom to represent a fixed, reactionary condition, though a resistive torque could also be applied.
5. Solving the Nonlinear Problem: The simulation solves for static structural equilibrium. The problem is nonlinear due to the changing contact area and status (sliding/sticking) as the spur and pinion teeth deform under load. Multiple load steps are used to apply the rotational displacement smoothly, aiding convergence.
Analysis of Frictional Effects on Gear Tooth Behavior
The central investigation involves running a series of simulations where the only variable changed is the coefficient of friction, \( \mu \), in the contact definition. A range of values is explored, from a near-frictionless condition (\( \mu \approx 0.05 \)) to a high-friction scenario (\( \mu = 0.8 \)), representative of poor lubrication or specific material pairings. For each case, key output variables are extracted from the FEA solution, primarily from the nodes and elements in the contact region.
Primary Output Variables:
- Contact Stress (\( \sigma_c \)): This is the von Mises or maximum principal stress in the region of contact. It indicates the intensity of the stress field that can lead to plastic deformation or fatigue crack initiation.
- Contact Pressure (\( p \)): The normal pressure distribution acting on the contacting surfaces of the spur and pinion. Its maximum value is a direct indicator of surface loading.
- Frictional Stress (\( f_s \)): The tangential shear stress at the interface, calculated as \( \mu \cdot p \). This stress is responsible for energy dissipation (heat generation) and can drive surface wear and micropitting.
The post-processing reveals a clear visual and quantitative trend. The contours of contact stress, frictional stress, and contact pressure on the tooth flanks intensify significantly as the coefficient of friction increases. The maximum values consistently occur near the pitch line or just below it on the spur and pinion teeth, aligning with theoretical expectations for single-tooth contact regions.
To quantify this relationship, the peak values of these three parameters are plotted against the coefficient of friction. The data reveals a distinct nonlinear trend that can be segmented into two regimes.
| Output Parameter | Regime I: Low μ (0 ≤ μ ≤ 0.3) | Regime II: High μ (0.3 < μ ≤ 0.8) |
|---|---|---|
| Maximum Contact Stress (\( \sigma_{c,max} \)) | Strong, near-linear increase. Slope is steep. | Continues to increase, but the rate of increase (slope) diminishes significantly. |
| Maximum Contact Pressure (\( p_{max} \)) | Pronounced increase. Directly impacts Hertzian-like stress calculations. | Increase becomes gradual, approaching an asymptotic trend. |
| Maximum Frictional Stress (\( f_{s, max} \)) | Rapid rise, governed by \( f_s = μ \cdot p \). | Increase continues but is tempered by the leveling off of contact pressure growth. |
The underlying mechanics for this behavior are instructive. In Regime I, the introduction of friction generates significant tangential tractions at the spur-pinion interface. These shear stresses alter the subsurface stress field predicted by pure normal contact (Hertz theory). They induce additional shear components and can raise the magnitude of the maximum orthogonal shear stress or von Mises stress, moving its location closer to the surface. This direct superposition effect leads to the strong initial rise in reported contact stress.
In Regime II, the relationship becomes more complex. As \( \mu \) grows, the high frictional shear forces begin to substantially impede tangential deformation (sliding) at the interface. The contact condition shifts towards “sticking” or partial sticking, which effectively changes the boundary condition. This constraint alters the overall deformation pattern of the spur and pinion teeth. While the friction force itself is still increasing, its effect on the total stress state is no longer a simple linear addition; the system’s compliance adjusts in response. Consequently, the stress and pressure parameters continue to increase but at a reduced rate.
Implications for Spur and Pinion Design and Performance
The findings from this frictional analysis have direct and critical implications for the design, application, and failure analysis of spur and pinion systems. The correlation between a higher coefficient of friction and elevated mechanical stresses provides a clear mechanistic link to common gear failure modes.
1. Fatigue Life and Pitting Resistance: Surface fatigue (pitting) is a primary failure mode for spur and pinion sets. It is driven by cyclic contact stresses. The analysis confirms that an increased \( \mu \) leads to higher maximum contact stress (\( \sigma_c \)) and contact pressure (\( p \)). According to fatigue life models, such as those based on the Lundberg-Palmgren theory, bearing (or gear) life is inversely proportional to stress raised to a high power (e.g., \( L_{10} \propto p^{-n} \), where n is often 9 for point contact). Therefore, even a modest rise in contact pressure due to friction can lead to a dramatic reduction in the predicted fatigue life of the spur and pinion. Managing friction is thus not just about efficiency but is a direct lever for improving durability and resistance to pitting.
2. Wear and Scuffing: The frictional shear stress (\( f_s \)) is the direct agent of adhesive and abrasive wear. As \( \mu \) increases, so does \( f_s \), accelerating surface material removal. More critically, a high coefficient of friction, combined with high sliding velocities and load, dramatically increases the risk of scuffing (severe adhesive wear). Scuffing is a catastrophic failure often related to lubrication breakdown. This analysis quantifies how the resulting high \( \mu \) creates the severe surface shear conditions that initiate this failure in the spur and pinion mesh.
3. System Efficiency, Heat Generation, and Noise: Frictional losses directly convert mechanical work into heat at the spur-pinion interface. The power loss due to friction, \( P_{loss} \), can be conceptually related to the integral of frictional stress over the sliding velocity and contact area. Higher \( \mu \) unequivocally leads to greater power loss and lower transmission efficiency. This generated heat must be dissipated to prevent thermal expansion, which can misalign the mesh, and degradation of the lubricant, which would further increase \( \mu \). Furthermore, friction is a primary excitation source for gear noise and vibration. Fluctuations in frictional force as teeth mesh can induce torsional and axial vibrations in the spur and pinion system.
Engineering Strategies for Friction Mitigation in Spur and Pinion Systems
Given the detrimental effects of high friction, the logical engineering imperative is to minimize the operational coefficient of friction in the spur and pinion mesh. This is achieved through a systems approach combining material science, surface engineering, and lubrication technology.
| Strategy Category | Specific Methods | Mechanism of Friction Reduction |
|---|---|---|
| Lubrication | Selection of high-performance gear oils (EP additives), Synthetic lubricants, Proper viscosity selection, Jet lubrication or oil mist systems. | Forms a fluid film (elastohydrodynamic lubrication) to separate surfaces, minimizing asperity contact. EP additives form protective tribofilms under high pressure. |
| Surface Finish & Treatment | Precision grinding, honing, superfinishing, Shot peening, Nitriding, Carburizing, Diamond-like carbon (DLC) coatings. | Reduces surface roughness to promote fluid film formation. Hardened surfaces and coatings resist asperity welding and adhesion. Compressive residual stress from peening improves fatigue life. |
| Geometry & Design | Profile and lead modifications (tip and root relief), Optimized pressure angle, Increased contact ratio. | Reduces edge loading and stress concentrations. Smoother load transfer between spur and pinion teeth reduces impact and sliding friction. |
| Material Selection | Hardened alloy steels (e.g., AISI 8620, 9310), Selecting dissimilar, compatible material pairs for pinion and gear. | High hardness reduces plastic deformation and adhesion. Compatible pairs reduce susceptibility to adhesive wear. |
In conclusion, the tribological performance of a spur and pinion system is inextricably linked to its mechanical integrity and operational efficiency. Through the integrated use of parametric CAD modeling and advanced nonlinear Finite Element Analysis, the profound influence of the coefficient of friction on gear tooth contact mechanics can be rigorously quantified. The results demonstrate a strong positive correlation between friction and the key drivers of failure: contact stress, contact pressure, and frictional shear stress. This relationship is most sensitive in the lower range of friction coefficients, underscoring the critical importance of effective lubrication and surface engineering. Therefore, a dedicated focus on minimizing friction through a holistic design-for-tribology approach is not merely beneficial but essential for developing next-generation spur and pinion drives that are capable of meeting ever-increasing demands for power density, longevity, and quiet operation. The methodologies and insights presented here provide a robust framework for engineers to optimize the performance and reliability of these fundamental mechanical components.