
The field of industrial metrology has undergone a significant transformation with the advent of machine vision. This technology, which synthesizes principles from artificial intelligence, geometric optics, electronics, computer graphics, information processing, and machine learning, offers unparalleled advantages: high precision, robust reliability, exceptional speed, and non-contact operation. In the context of modern smart manufacturing and industrial automation, machine vision is increasingly supplanting traditional manual inspection methods across diverse sectors including transportation, healthcare, and agriculture. This paradigm shift is particularly evident in precision manufacturing, where the demand for high-accuracy, automated quality control is paramount. One critical application area is the geometric inspection of power transmission components, where the spur and pinion gear plays a fundamental role. The traditional arsenal for measuring gear parameters, such as Coordinate Measuring Machines (CMMs) and specialized gauges, often suffers from operational complexity, high labor and management costs, low throughput, and sometimes insufficient precision. These limitations are increasingly at odds with the stringent quality requirements of contemporary industrial production. To address the need for high-precision, automated measurement of spur and pinion gear geometric parameters, this research focuses on developing a machine vision-based methodology, with tooth pitch deviation serving as a primary case study. This approach promises to overcome the drawbacks of contact-based methods, paving the way for faster, more reliable, and highly precise gear inspection.
Fundamentals and Definitions of Gear Pitch Measurement
The accurate transmission of motion and power in a gear pair is critically dependent on the precision of its tooth geometry. Among various gear error parameters, tooth pitch deviation is a fundamental indicator of manufacturing quality and operational performance. For a spur and pinion gear, pitch refers to the distance between corresponding points on adjacent teeth. Deviations from the theoretical pitch can lead to non-uniform motion transmission, increased vibration, noise, and accelerated wear. According to international gear accuracy standards (such as ISO 1328 or its national equivalents like GB/T 10095), pitch deviations are primarily categorized into three types:
| Deviation Type | Symbol | Definition |
|---|---|---|
| Single Pitch Deviation | $f_{pt}$ | The algebraic difference between the actual pitch and the theoretical pitch at a single tooth location. $f_{pt_i} = p_i – p$. |
| Cumulative Pitch Deviation (over k teeth) | $F_{pk}$ | The algebraic sum of the single pitch deviations over any sector of k teeth. $F_{pk} = \sum_{j=i}^{i+k-1} f_{pt_j}$. |
| Total Cumulative Pitch Deviation | $F_p$ | The difference between the maximum and minimum values of the cumulative pitch deviation $F_{pk}$ over the entire gear. $F_p = \max(F_{pk}) – \min(F_{pk})$. |
Here, $p = \pi m$ is the theoretical circular pitch, $m$ is the module, and $p_i$ is the actual measured pitch for tooth $i$. The value of $k$ is typically specified by the standard, often as the largest integer less than $z/8$ or $z/6$, where $z$ is the number of teeth. The accurate measurement of these parameters is essential for grading spur and pinion gear quality and predicting their functional behavior in assemblies.
Machine Vision-Based Measurement Principle
The core principle of machine vision metrology involves transforming a physical geometric quantity into a digital image from which measurements can be extracted. The process for a spur and pinion gear begins with an imaging system that projects the gear’s end-face onto a photoelectric sensor (camera sensor). This system converts the optical image into an electronic signal—a digital image. This image is then transmitted to a host computer (PC). Specialized image processing software analyzes the image to extract the necessary geometric features of the spur and pinion gear. Finally, based on a mathematical model of the imaging system, the software calculates the desired geometric parameters, such as pitch deviations.
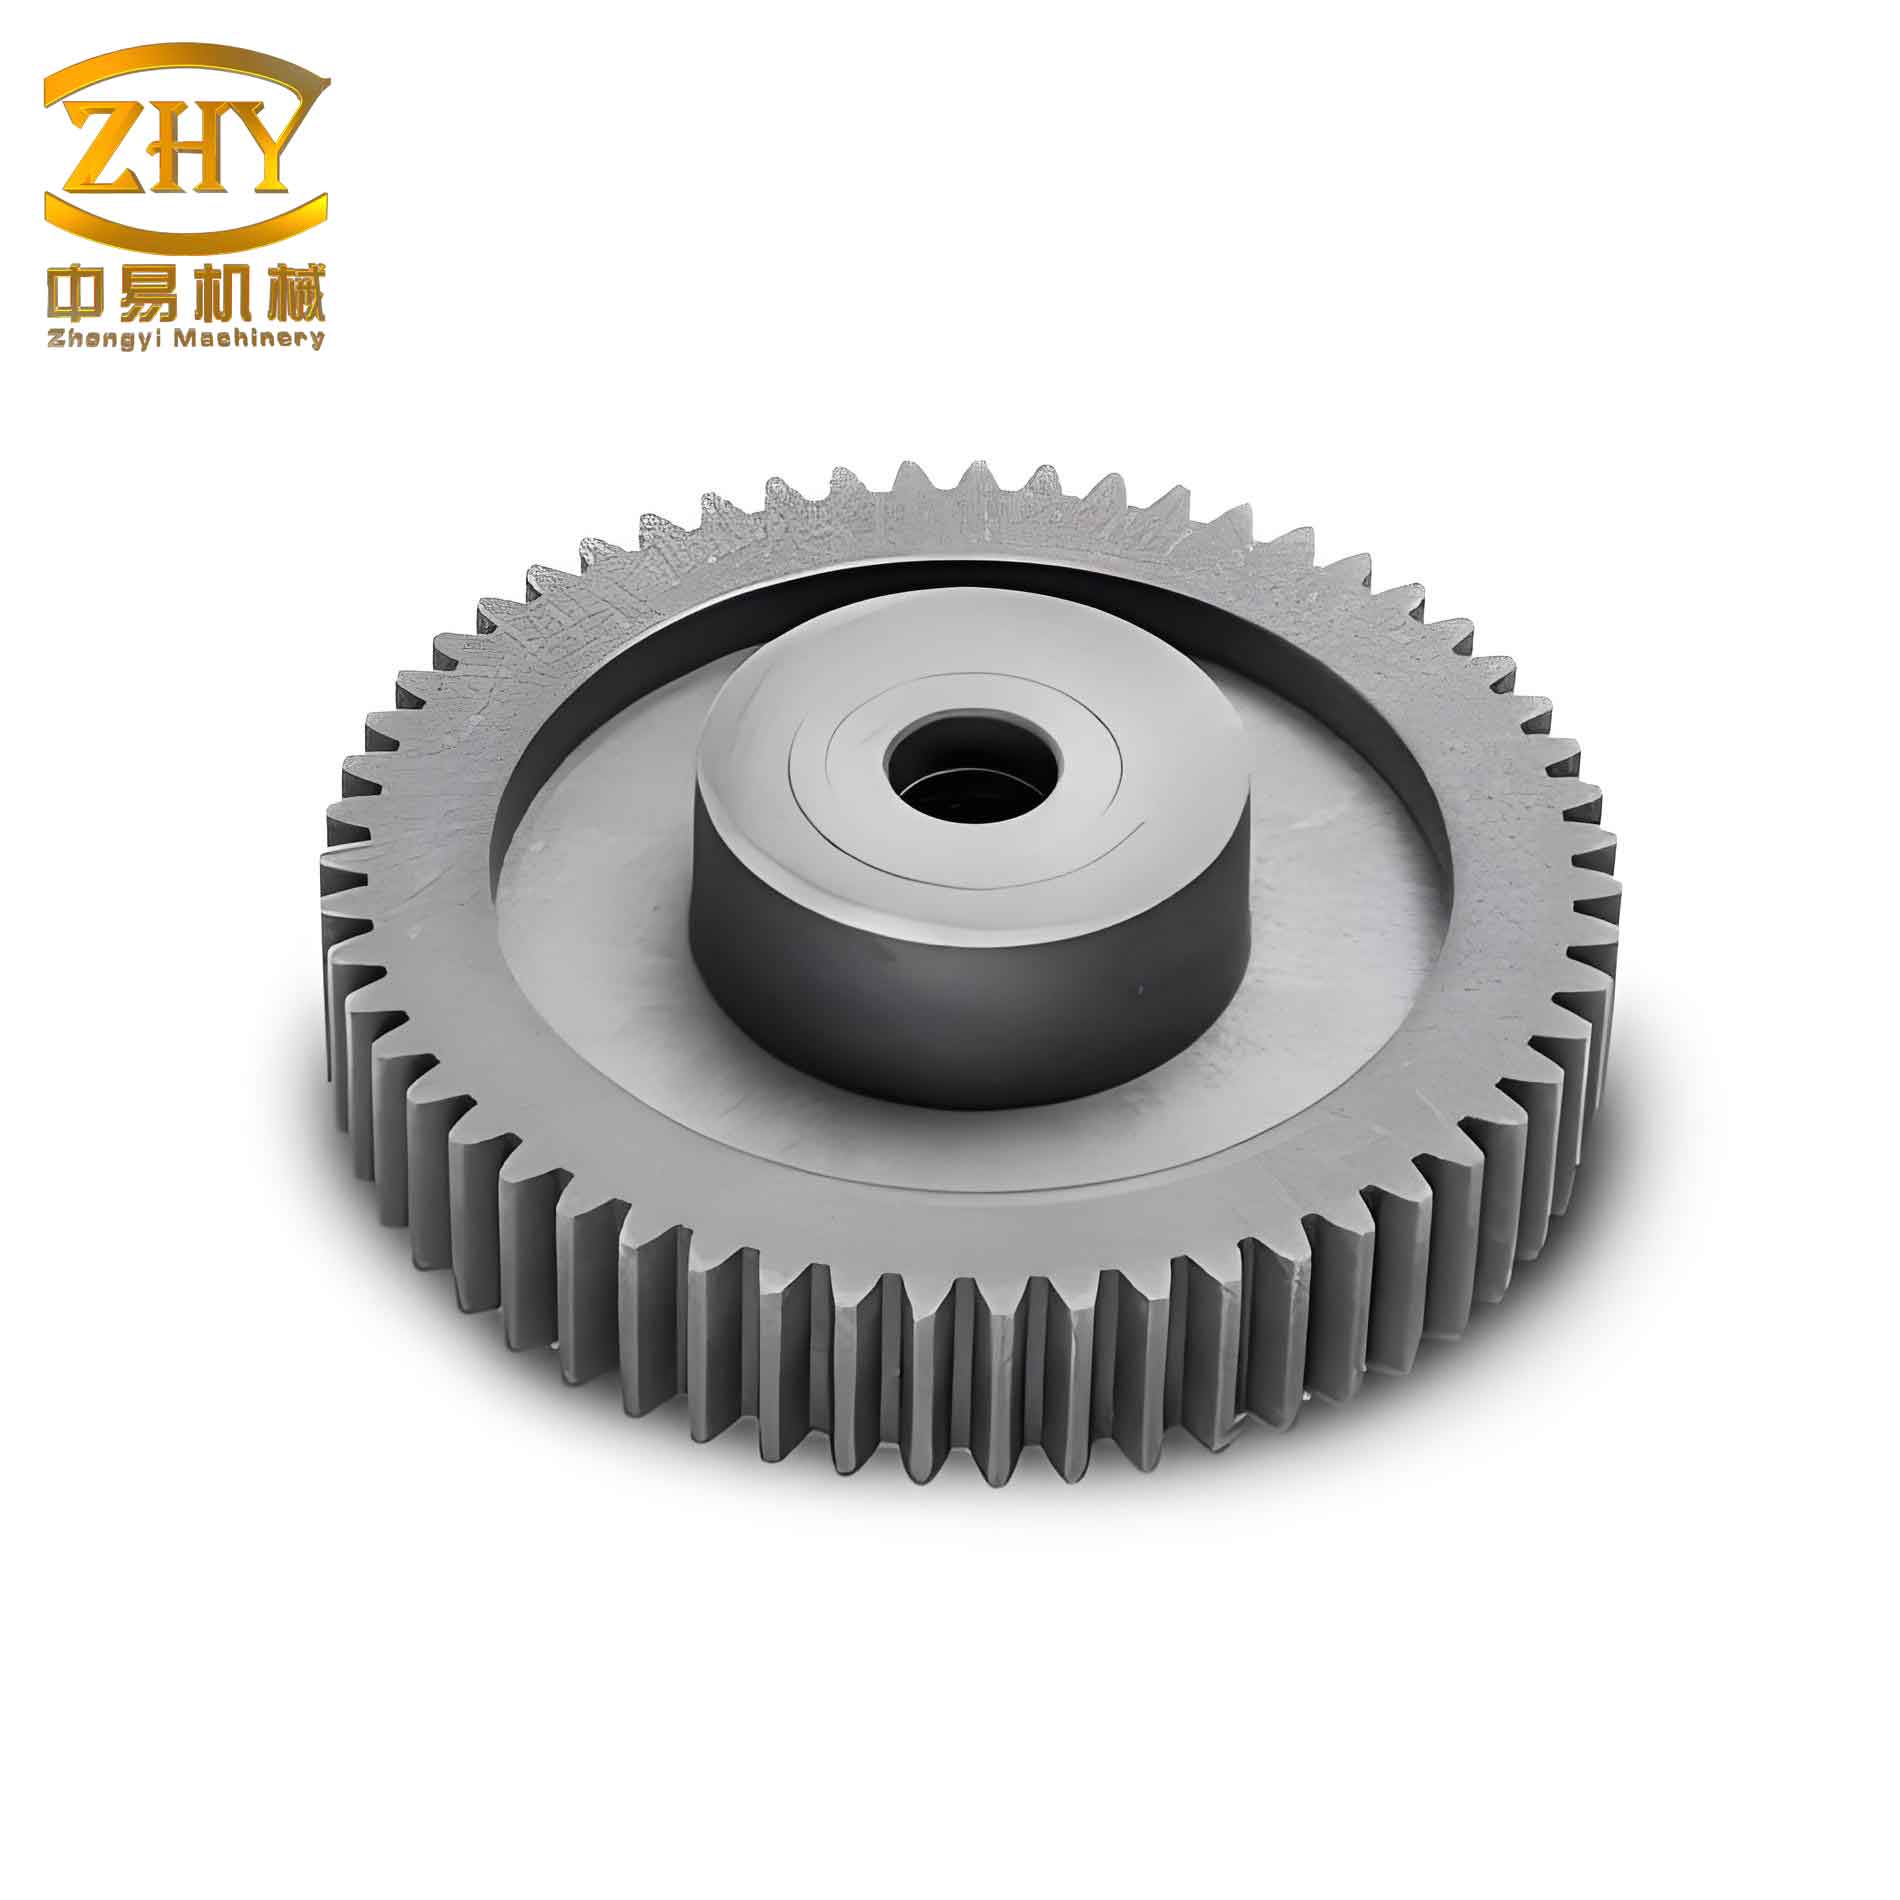
The mathematical foundation for distance measurement via imaging can be illustrated by measuring the arc length between two intersection points on the pitch circle of a spur and pinion gear. Let point $A$ and point $B$ be the intersections of the gear tooth flanks with the pitch circle. Their pixel coordinates in the acquired image are $(u_a, v_a)$ and $(u_b, v_b)$, respectively. The pixel distance $L_{pix}$ between them is:
$$L_{pix} = \sqrt{(u_a – u_b)^2 + (v_a – v_b)^2}$$
The corresponding actual arc length $L_{real}$ on the spur and pinion gear is then:
$$L_{real} = \tau \cdot L_{pix}$$
where $\tau$ is the pixel equivalent or scale factor, with units of mm/pixel. This factor represents the actual physical distance corresponding to a single pixel movement in the image plane and is fundamentally linked to the magnification of the imaging system. For a fixed monocular vision system with a constant working distance, the magnification is stable, allowing $\tau$ to be determined accurately through a one-time calibration process using a physical artifact of known dimensions, such as a precision calibration target or a standard scale.
Algorithm Design for Spur and Pinion Gear Pitch Measurement
Extracting pitch deviation data from a raw gear image requires a carefully orchestrated sequence of image processing and computational algorithms. The overall workflow can be broken down into several key stages.
Image Preprocessing Algorithm
The primary goal of preprocessing is to enhance image quality and emphasize the contour features of the spur and pinion gear while suppressing noise and irrelevant information. The standard pipeline is as follows:
- Gaussian Filtering: Raw images from industrial cameras often contain noise due to lighting inconsistencies, sensor limitations, or environmental factors. A Gaussian filter is applied to smooth the image, effectively reducing high-frequency noise while preserving essential edge information crucial for the subsequent contour detection of the spur and pinion gear.
- Image Binarization: This critical step converts the grayscale image into a binary (black and white) image. By selecting an appropriate threshold value based on the distinct intensity difference between the dark gear body/background and the bright edges or lit surfaces, the algorithm segments the image. The result is a simplified representation where the spur and pinion gear silhouette is prominently white against a black background, dramatically reducing data complexity.
- Morphological Operations (Dilation/Erosion): Binarization can sometimes create small holes, breaks in contours, or isolated noise pixels. Applying controlled dilation (expanding white regions) followed by erosion (shrinking them back) helps to bridge small gaps in the spur and pinion gear contour and remove tiny artifacts, resulting in a cleaner, more continuous boundary.
| Preprocessing Step | Purpose | Key Parameter/Technique |
|---|---|---|
| Gaussian Filter | Noise reduction, smoothing | Kernel size (e.g., 3×3, 5×5) |
| Binarization | Image segmentation, feature isolation | Global or adaptive thresholding |
| Morphology | Contour cleanup, artifact removal | Structuring element size and shape |
Imaging System Calibration
Accurate measurement hinges on a precise camera model. We employ Zhang’s flexible camera calibration method using a planar checkerboard pattern. This process determines two sets of critical parameters:
- Intrinsic Parameters: These describe the internal geometry of the camera.
- Focal length ($f_x$, $f_y$ in pixels).
- Principal point ($u_0$, $v_0$).
- Lens distortion coefficients.
- Extrinsic Parameters: These describe the position and orientation of the camera relative to the world for each calibration image.
Lens distortion, primarily radial and tangential, must be corrected. The corrected coordinates $(x_r, y_r)$ are derived from the distorted coordinates $(x_d, y_d)$ as follows, where $r^2 = x_d^2 + y_d^2$:
Radial Distortion:
$$x_r = x_d(1 + k_1 r^2 + k_2 r^4 + k_3 r^6)$$
$$y_r = y_d(1 + k_1 r^2 + k_2 r^4 + k_3 r^6)$$
Tangential Distortion:
$$x_r = x_d + [2p_1 x_d y_d + p_2(r^2+2x_d^2)]$$
$$y_r = y_d + [p_1(r^2+2y_d^2) + 2p_2 x_d y_d]$$
Here, $k_1, k_2, k_3$ are radial distortion coefficients and $p_1, p_2$ are tangential distortion coefficients. The pixel equivalent $\tau$ is directly obtained from the intrinsic matrix $M$. If $f_x = f / d_x$ and $f_y = f / d_y$, where $d_x$ and $d_y$ are the physical pixel dimensions, then the average pixel equivalent is:
$$\tau \approx \frac{1}{2}\left(\frac{1}{f_x} + \frac{1}{f_y}\right) \cdot f \approx \frac{d_x + d_y}{2}$$
In practice, $\tau$ is often determined more directly by imaging a calibration target of known physical length $L_{true}$ and measuring its length in pixels $L_{pix}$: $\tau = L_{true} / L_{pix}$.
Gear Contour and Feature Extraction Algorithm
With a preprocessed binary image, the next step is to extract the precise contour of the spur and pinion gear. We utilize the Sobel edge detection operator for its computational efficiency and effectiveness. The Sobel operator uses two 3×3 kernels to approximate the horizontal ($G_x$) and vertical ($G_y$) derivatives of the image intensity $I$:
$$G_x = \begin{bmatrix} -1 & 0 & +1 \\ -2 & 0 & +2 \\ -1 & 0 & +1 \end{bmatrix} * I, \quad G_y = \begin{bmatrix} -1 & -2 & -1 \\ 0 & 0 & 0 \\ +1 & +2 & +1 \end{bmatrix} * I$$
The gradient magnitude $G$ at each pixel, which indicates edge strength, is:
$$G = \sqrt{G_x^2 + G_y^2}$$
Pixels where $G$ exceeds a set threshold are classified as edge points. Applying this to the binary gear image yields a set of contour points representing the outer and inner boundaries (addendum and dedendum circles) of the spur and pinion gear.
Pitch Circle Construction
Pitch deviation is measured relative to the pitch circle. For a spur and pinion gear with unknown parameters, the pitch circle must be constructed algorithmically. The process requires determining the gear center, addendum radius ($r_a$), dedendum radius ($r_f$), number of teeth ($z$), and finally the module ($m$).
- Gear Center $(x_0, y_0)$: The outer and inner contours are separately fitted to circles using a least-squares algorithm. The gear center is taken as the average of the centers of these two fitted circles.
- Addendum Radius $r_a$: A convex hull is constructed around the outer contour. The intersection points of this hull with the contour are considered points on or near the addendum circle. The distance from the gear center to these points is averaged to compute $r_a$.
- Dedendum Radius $r_f$: The minimum distance $d_{min}$ from the outer contour to the gear center is found. Contour points whose distance to the center lies within a small interval $[d_{min}, d_{min} + \Delta d]$ are considered dedendum circle points. Their average distance to the center gives $r_f$.
- Number of Teeth $z$: A circle with radius $(r_a + r_f)/2$ is constructed centered at $(x_0, y_0)$. The number of intersections of this circle with the outer gear profile equals twice the number of teeth $z$.
- Module $m$: The theoretical relationship $r_a = m(z+2)/2$ is used to estimate the module: $m’ = 2r_a / (z+2)$. This value is then matched to the nearest standard module from the preferred series (e.g., ISO 54). The pitch circle radius $r$ is then definitively calculated as $r = m z / 2$.
Pitch Parameter Calculation Algorithm
Once the pitch circle (radius $r$, center $(x_0, y_0)$) is defined, it is superimposed on the gear contour image. The intersection points between the left and right tooth flanks and the pitch circle are detected and sorted angularly around the center. Let these $2z$ points be $P_1, P_2, …, P_{2z}$ with corresponding angles $\theta_1, \theta_2, …, \theta_{2z}$.
The actual pitch for the $i$-th tooth space (between flank $i$ and flank $i+2$) is the arc length on the pitch circle:
$$p_i = r \cdot \Delta\theta_i = \frac{m z}{2} \cdot (\theta_{i+2} – \theta_i)$$
where $\Delta\theta_i$ is the corrected angular difference between the flanks.
The three key pitch deviation parameters for the spur and pinion gear are then computed as follows:
Single Pitch Deviation: $$f_{pt_i} = p_i – \pi m$$
Cumulative Pitch Deviation (over k teeth): $$F_{pk} = \sum_{j=i}^{i+k-1} f_{pt_j}$$
Total Cumulative Pitch Deviation: $$F_p = \max_{ all\ sectors\ k}(F_{pk}) – \min_{ all\ sectors\ k}(F_{pk})$$
where $k$ is chosen per the relevant gear standard. This automated calculation provides a complete pitch error analysis for the inspected spur and pinion gear.
Experimental System Setup and Results Analysis
To validate the proposed machine vision methodology for spur and pinion gear pitch deviation measurement, a dedicated image measurement system platform was constructed.
System Configuration
The hardware setup was designed to ensure stability, clarity, and precision for imaging spur and pinion gears.
| Component | Model/Specification | Key Parameters |
|---|---|---|
| Industrial Camera | VMS14M33 CMOS | Resolution: 4320×2430, Pixel Size: 1.43µm, Sensor: 1/2.33″ |
| Lens | CW-FM1614-8MP (Fixed Focal) | Focal Length: 16mm, FOV: 21.8°x16.8°, Distortion: <0.05% |
| Light Source | LED Ring Light | Adjustable intensity, provides uniform frontal illumination |
| Mechanical Stage | Manual X-Y Stage & Vertical Stand | Provides precise positioning and focus adjustment |
| Computer | Standard PC | Running custom measurement software |
The system was calibrated using a standard checkerboard target. The resulting pixel equivalent $\tau$ was determined to be 0.00504 mm/pixel, establishing the fundamental scale for all subsequent spur and pinion gear measurements.
Software Interface
A dedicated graphical user interface (GUI) was developed using the PyQt5 toolkit to streamline the measurement process for spur and pinion gear inspection. The interface integrates functionalities for live image capture, system calibration (loading calibration parameters), image preprocessing control, automatic gear detection, parameter calculation, and results display. This integrated software environment makes the system accessible and efficient for operational use.
Pitch Deviation Measurement Results and Repeatability Analysis
A spur and pinion gear (Module $m=0.6$, Teeth $z=14$) was measured multiple times. The algorithm successfully identified the gear parameters and constructed the pitch circle. The table below shows a sample of single pitch deviation results measured from one image, using both the left and right flanks of the teeth as reference, demonstrating internal consistency.
| Tooth Index (i) | Left Flank $f_{pt_i}$ (µm) | Right Flank $f_{pt_i}$ (µm) |
|---|---|---|
| 1 | -0.131 | -2.787 |
| 2 | -7.395 | -0.111 |
| 3 | 0.411 | -1.295 |
| 4 | -22.115 | 5.829 |
| 5 | 21.317 | -10.414 |
| … | … | … |
| 14 | 10.032 | 26.304 |
| Max $|f_{pt}|$ | 35.055 | 39.830 |
The cumulative deviation plots derived from both flanks showed very similar patterns and total range values ($F_p$). For instance, the $F_p$ calculated from left flank data was 41.137 µm and from right flank data was 41.771 µm, confirming the robustness of the feature point extraction for the spur and pinion gear.
A critical test for any measurement system is its repeatability. The same spur and pinion gear was measured 10 times consecutively (without dismounting) to assess the system’s precision. The standard deviation $s$ was calculated using the Bessel formula:
$$s = \sqrt{\frac{\sum_{i=1}^{n}(x_i – \bar{x})^2}{n-1}}$$
where $x_i$ are the measurement results and $\bar{x}$ is their mean. The repeatability results for key parameters are summarized below:
| Measured Parameter | Standard Deviation (s) over 10 runs |
|---|---|
| Single Pitch Deviation (for a specific tooth) | 5.317 µm |
| Cumulative Pitch Deviation (k=2, for a specific sector) | 5.688 µm |
| Total Cumulative Pitch Deviation ($F_p$) | 3.671 µm |
To further validate the system’s capability across multiple samples, three different groups of spur and pinion gears (10 gears per group, same model within group) were tested. For each gear, the Total Cumulative Pitch Deviation $F_p$ was measured 10 times, and the standard deviation was computed. The maximum standard deviation observed among all 30 gears in the three groups was 5.314 µm. These results conclusively demonstrate that the developed machine vision system achieves a repeatability precision better than 6 µm for pitch deviation measurement on spur and pinion gears, meeting the requirements for effective and reliable industrial inspection.
Conclusion
This research has successfully developed and validated a machine vision-based methodology for the automated, non-contact detection of tooth pitch deviation in spur and pinion gears. The method leverages an imaging system to capture the gear’s end-face, followed by a comprehensive algorithmic pipeline encompassing image preprocessing, system calibration, robust edge detection, intelligent feature extraction (gear center, addendum/dedendum circles, tooth count), and automated pitch circle construction. Based on the formal definitions of pitch deviations, the system calculates the single pitch deviation, cumulative pitch deviation, and total cumulative pitch deviation with high precision.
Compared to traditional contact-based methods like CMMs or manual gauging, this vision-based approach for spur and pinion gear inspection offers significant advantages: it is faster, eliminates the risk of surface damage from probes, reduces operator dependency, and enables full automation. The experimental system, built with standard industrial vision components, demonstrated a measurement repeatability better than 6 µm, confirming its capability for precise and reliable quality control. The integration of all functionalities into a user-friendly software interface further enhances its practical utility. This work confirms that machine vision technology is a powerful and viable solution for advancing the state-of-the-art in gear metrology, particularly for the high-throughput, high-precision inspection of critical components like the spur and pinion gear.