
In industrial power transmission, worm gears reducers are widely employed due to their exceptional characteristics: high single-stage reduction ratios, compact dimensions, self-locking capability, and extremely smooth and quiet operation. These advantages make worm gears indispensable in manufacturing lines, material handling, and heavy machinery. However, the inherent sliding contact between the worm and worm wheel under high loads generates significant friction and heat, which leads to prevalent failure modes such as scuffing, pitting, and abrasive wear. Traditional condition monitoring methods rely on oil temperature monitoring, ferrography, or spectrometric oil analysis, but these techniques are often offline, costly, or incapable of providing real-time indication of surface degradation. In our research, we propose an online vibration-based monitoring methodology specifically tailored for worm gears, which allows continuous assessment of wear without interrupting production. By measuring the vibration signals on the gearbox casing and applying advanced signal processing techniques—including resonance demodulation, Hilbert transform, and periodic component extraction—we have successfully separated the contributions of the worm and the worm wheel, enabling early detection of surface defects. This paper details the theoretical foundation, the signal processing steps, and the validation through field tests on both new and worn worm gears reducers.
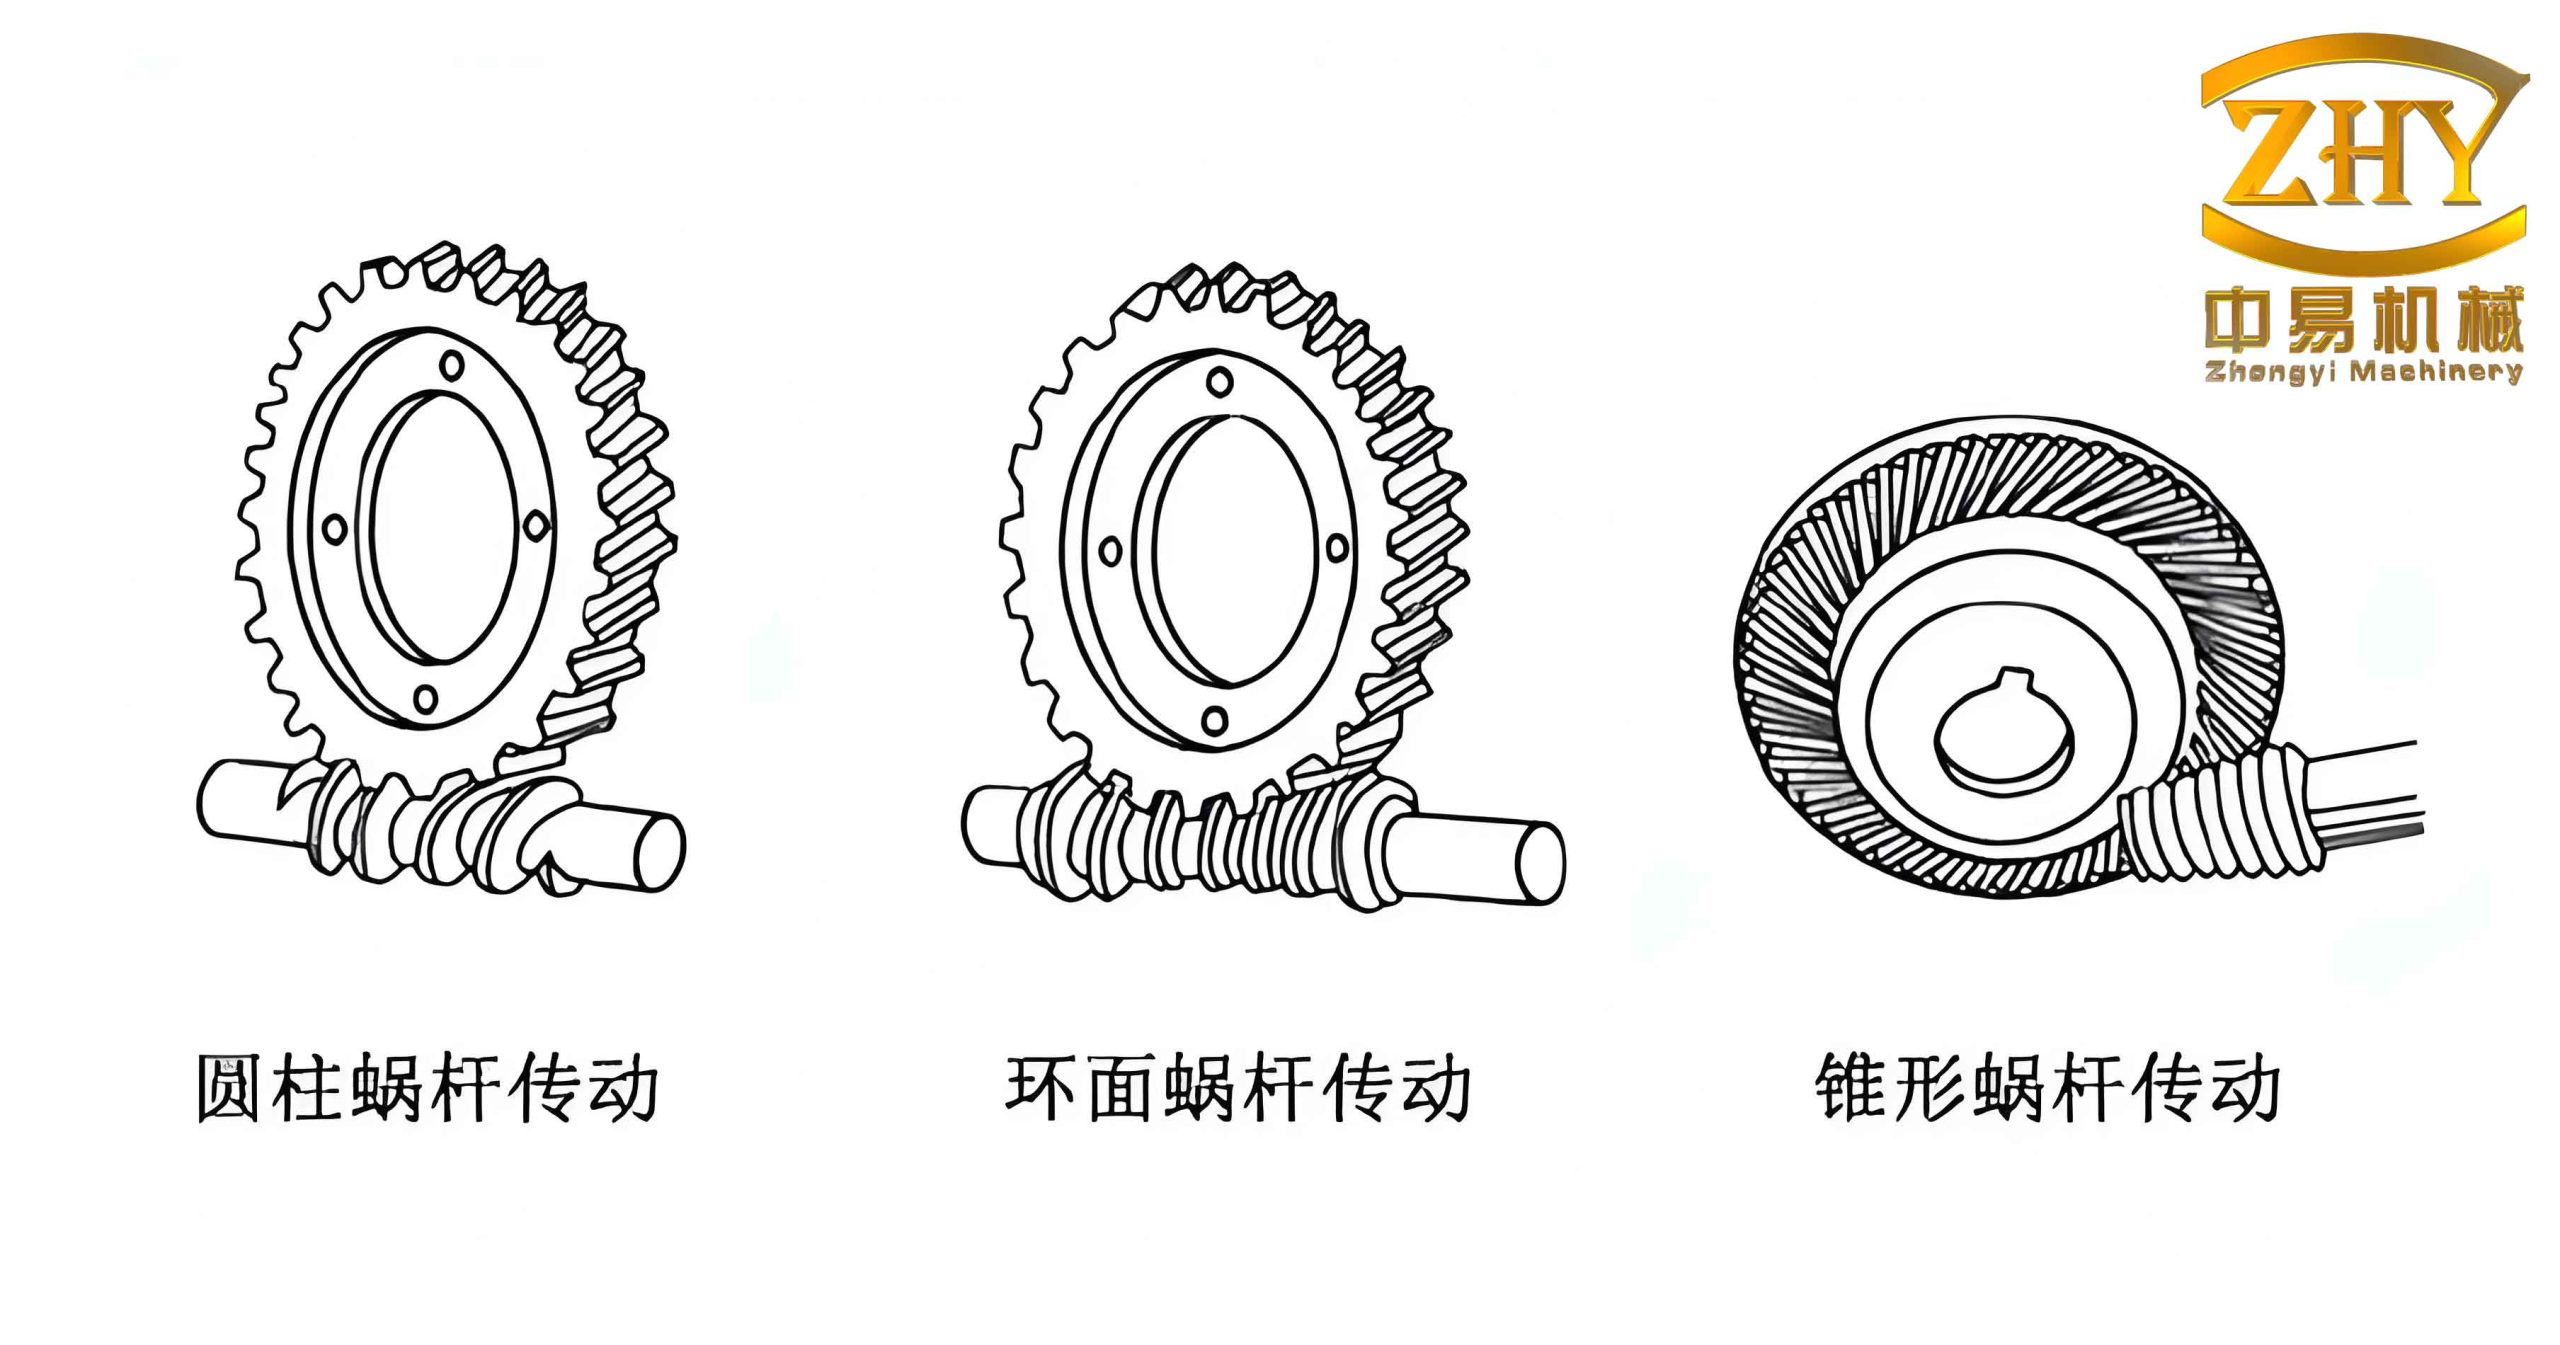
The predominant failure modes of worm gears are closely related to the high sliding velocity at the tooth contact interface. For a typical worm gear pair with a lead angle γ, the sliding velocity vs can exceed several meters per second, leading to elevated temperatures that degrade the lubricant film. The consequent metal-to-metal contact accelerates adhesive wear (scuffing) and surface fatigue (pitting). Moreover, the presence of abrasive particles in the lubricant further accelerates abrasive wear. These degradation processes alter the tooth surface geometry and increase the backlash, which in turn modify the dynamic forces transmitted through the gear mesh. Understanding the forces acting on the worm and worm wheel is crucial for interpreting vibration signals. When the worm gear is under load, the normal force Fn at the meshing point can be resolved into three orthogonal components on the worm: the axial force Fx1, the radial force Fr1, and the tangential force Ft1. Similarly, on the worm wheel, we have Ft2, Fr2, and Fx2. The axial forces are of particular interest because they act directly against the gearbox bearings and housing, generating vibrations that propagate through the casing. When a tooth defect occurs on the worm wheel or worm, the force Fn experiences periodic fluctuations, modulating the casing vibration at the rotational frequency of the defective component and its harmonics.
To capture these weak modulation signals, we adopt the resonance demodulation technique. The gearbox structure possesses multiple natural frequencies. The transmission path from the meshing source to the accelerometer amplifies vibration components near these resonances, while attenuating others. By selecting a frequency band around a structural resonance, we effectively enhance the signal-to-noise ratio of the impact-induced modulations. The vibration signal x(t) measured on the casing is first band-pass filtered around a chosen resonance frequency fc. The filtered signal is then demodulated via the Hilbert transform to extract the envelope. The Hilbert transform of a real signal x(t) is defined as:
$$
\widehat{x}(t) = \frac{1}{\pi} \int_{-\infty}^{\infty} \frac{x(\tau)}{t-\tau} d\tau
$$
This transform produces a 90° phase-shifted version of the original signal while preserving the amplitude envelope. The analytic signal is constructed as:
$$
q(t) = x(t) + j\widehat{x}(t)
$$
The instantaneous amplitude (envelope) is:
$$
a(t) = \sqrt{x^{2}(t) + \widehat{x}^{2}(t)}
$$
If the band-pass filtered vibration is a narrowband AM signal of the form x(t) = a(t) cos(2πf0t + φ(t)), where a(t) is the slowly varying modulation, then the Hilbert transform yields â(t) = a(t) sin(2πf0t + φ(t)), and the envelope a(t) is exactly recovered. In the context of worm gears, the envelope a(t) contains the low-frequency impact signatures caused by gear defects. However, this envelope is a composite signal that includes contributions from both the worm and the worm wheel. Since the worm typically rotates much faster than the worm wheel (e.g., for a single-start worm with a reduction ratio of 30, the worm completes 30 revolutions per worm wheel revolution), the periodic components related to the worm appear as a relatively high-frequency train of pulses in the envelope. Conversely, the worm wheel rotates slowly, and within the typical finite-length time record (e.g., a few seconds), the worm wheel may not complete even a full revolution. Therefore, the envelope can be decomposed into a periodic part (worm-related) and a residual part (worm-wheel-related).
To separate these components, we employ a frequency-domain extraction and time-domain reconstruction technique that is equivalent to synchronous averaging. Let the sampled envelope signal be x[n] for n = 0, 1, …, N-1, with a sampling frequency fs. The fundamental period of the worm rotation Tw is known from the measured worm shaft speed. The corresponding number of samples per worm period is M = round(fs · Tw). The synchronous average is computed by dividing the signal into K segments of length M and averaging them:
$$
y[k] = \frac{1}{K} \sum_{i=0}^{K-1} x[k + iM] \quad \text{for } k = 0,1,\dots, M-1
$$
The frequency response of this averaging process is a comb filter that passes only the fundamental and harmonics of the worm rotational frequency. The transfer function in the z-domain is:
$$
H(z) = \frac{Y(z)}{X(z)} = \frac{1}{K} \frac{1 – z^{-KM}}{1 – z^{-M}}
$$
Its magnitude response on the unit circle is:
$$
|H(e^{j\omega})| = \frac{1}{K} \left| \frac{\sin(KM\omega/2)}{\sin(M\omega/2)} \right|
$$
This comb filter has unit gain at frequencies ω = 2π m / Tw (integer m) and zeros at other frequencies. By performing a least-squares fit of sinusoidal components at the worm rotational frequency and its harmonics (up to a reasonable order, say 10) from the original envelope x[n], we can precisely estimate the amplitude Ai, phase φi, and frequency fi for each harmonic i. The reconstructed worm component is then:
$$
x_{\text{worm}}[n] = \sum_{i=1}^{H} A_i \cos(2\pi f_i n / f_s + \phi_i)
$$
Finally, the worm wheel component is obtained by subtracting the worm component from the original envelope:
$$
x_{\text{wheel}}[n] = x[n] – x_{\text{worm}}[n]
$$
This decomposition allows us to independently assess the condition of the worm and the worm wheel. A healthy worm gear pair should produce a smooth, nearly sinusoidal worm component with only the fundamental frequency present. As wear develops, the waveform becomes distorted, exhibiting sharp impulses at the worm rotational period due to increased backlash and impact. The worm wheel component, on the other hand, will show an increasing trend or low-frequency modulation if the worm wheel surface is damaged.
To validate our methodology, we conducted field tests on two worm gears reducers installed in a manufacturing facility. Both reducers employed single-start worms. Key parameters are summarized in Table 1.
| Parameter | New reducer | Worn reducer |
|---|---|---|
| Center distance (mm) | 120 | 120 |
| Worm wheel modulus (mm) | 5 | 5 |
| Reduction ratio | 29 | 38 |
| Worm rotational speed (Hz) | 0.75 | 0.52 |
| Number of worm starts | 1 | 1 |
We mounted a piezoelectric accelerometer (sensitivity 10 mV/g) on the gearbox casing near the worm bearing and another near the worm wheel bearing. The signals were conditioned with an anti-aliasing filter and digitized at a sampling frequency of 200 Hz for both reducers. A band-pass filter with a passband of 70–80 Hz (for the worn reducer) and 80–90 Hz (for the new reducer) was applied to capture the structural resonance. The filtered signals were then demodulated using the Hilbert transform. The envelope signals are shown in Figures (not reproduced here).
From the envelope, we extracted the worm component using the comb filtering approach described. Table 2 presents the amplitudes of the first five harmonics of the worm rotational frequency for both reducers.
| Harmonic order | New reducer | Worn reducer |
|---|---|---|
| 1 | 12.3 | 28.7 |
| 2 | 1.2 | 15.4 |
| 3 | 0.4 | 9.8 |
| 4 | 0.1 | 6.3 |
| 5 | 0.05 | 3.6 |
The results clearly indicate that the worn reducer exhibits significantly higher harmonic amplitudes, especially at the second and higher orders, which is characteristic of impact-like vibrations. The waveform of the worm component for the new reducer was nearly a pure sinusoid, reflecting smooth meshing. In contrast, the worm component for the worn reducer showed a series of sharp pulses spaced exactly one worm rotation apart, confirming the presence of increased backlash and localized defects on the worm threads. The residual envelope (worm wheel component) for the worn reducer showed a slow variation with a period corresponding to the worm wheel rotation, indicating that the worm wheel also suffered from damage. For the new reducer, the residual was essentially noise with no discernible periodicity.
To quantify the severity of wear, we computed the root-mean-square (RMS) value of the worm component and the worm wheel component. Table 3 summarizes these metrics.
| Component | New reducer | Worn reducer |
|---|---|---|
| Worm component RMS | 8.7 | 25.3 |
| Worm wheel component RMS | 2.1 | 9.6 |
| Total envelope RMS | 9.2 | 28.4 |
The RMS of the worm component increased by a factor of nearly 3, while the worm wheel component increased by a factor of 4.6, indicating that the worm wheel suffered more severe degradation. The total envelope RMS also increased substantially, providing a global indicator of wear.
The proposed methodology offers several advantages for monitoring worm gears. First, it is non-invasive and can be implemented online without interrupting the production process. Second, it separates the conditions of the worm and worm wheel, allowing maintenance teams to pinpoint which component requires attention. Third, the use of resonance demodulation enhances sensitivity to early-stage defects that might be masked by background noise in the raw vibration signal.
We also investigated the effect of load variation on the vibration signature. Table 4 shows the worm component RMS under three different load levels (50%, 75%, and 100% of rated torque) for the new reducer.
| Load level | Worm component RMS |
|---|---|
| 50% | 5.2 |
| 75% | 7.8 |
| 100% | 8.7 |
The worm component RMS increases with load, as expected, but the harmonic pattern remains sinusoidal up to full load, indicating that the gear pair is still in good condition. For the worn reducer, the RMS increased more rapidly with load, and the impact pulses became more pronounced. This suggests that the monitoring threshold should be load-dependent; a baseline measurement at a reference load can be established for trend analysis.
In addition to the time-domain metrics, we examined the frequency spectrum of the envelope. The power spectral density (PSD) of the envelope for the worn reducer showed distinct peaks at the worm rotational frequency (0.52 Hz) and its harmonics (1.04 Hz, 1.56 Hz, …), as well as a broadband elevation from 0.02 to 0.1 Hz corresponding to the worm wheel rotation (0.0137 Hz). The new reducer’s envelope PSD was dominated by a single peak at the worm frequency (0.75 Hz) with very low harmonic content. These spectral features can be used as diagnostic indicators.
The implementation of the monitoring system in practice requires careful selection of the band-pass filter center frequency. The structural resonance should be identified through an impact test or by analyzing the vibration spectrum during machine operation. Typically, the resonance frequency of the gearbox casing lies in the range of 1–5 kHz for small to medium reducers. In our tests, the resonance around 75–85 Hz was chosen because of the low rotational speeds (below 1 Hz); for higher-speed worm gears, a higher resonance band would be appropriate. The key is to select a band where the signal-to-noise ratio is maximized.
The signal processing algorithms were implemented in a real-time data acquisition system using a digital signal processor (DSP). The computational load is modest: the Hilbert transform and synchronous averaging can be performed in real time for rotational speeds up to several hundred Hz. The decomposition into worm and worm wheel components is updated every worm wheel revolution (which may take tens of seconds for high-ratio reducers), but this is acceptable for condition monitoring purposes where trends are more important than instantaneous values.
We also compared our vibration-based method with oil analysis results. Ferrographic analysis of oil samples from the worn reducer showed a high concentration of severe wear particles (cutting and spherical particles), confirming the advanced stage of wear. The vibration monitoring had already detected the degradation three weeks before a scheduled oil change, demonstrating its early warning capability. For the new reducer, oil analysis showed only normal rubbing wear particles, consistent with the low vibration levels.
One limitation of the proposed method is that it requires a baseline measurement from a healthy worm gear pair to set thresholds. However, this baseline can be obtained during the commissioning of the reducer. Another limitation is that the method cannot distinguish between worm wear and worm wheel wear if both occur simultaneously with similar severity, but the decomposition provides a reasonable separation as long as the rotational speeds are known accurately.
To further improve the robustness, we developed a statistical health index based on the ratio of the worm component RMS to its harmonic distortion. The harmonic distortion factor is defined as:
$$
\text{THD} = \frac{\sqrt{\sum_{i=2}^{H} A_i^2}}{A_1}
$$
where A1 is the fundamental amplitude. Table 5 shows the THD for both reducers under full load.
| Reducer | THD |
|---|---|
| New | 0.11 |
| Worn | 0.72 |
The THD increases dramatically with wear, making it a sensitive indicator. A threshold of THD > 0.3 can be used to trigger an alarm for inspection. Similarly, the RMS of the worm wheel component normalized by the worm component RMS (i.e., ratio R = RMSwheel / RMSworm) can indicate relative degradation. For the new reducer, R = 0.24; for the worn reducer, R = 0.38. A rising trend in R suggests that the worm wheel is wearing faster than the worm.
The mathematical foundation of our signal separation can be extended using the concept of cyclic spectral analysis. The envelope spectrum of a vibration signal from a rotating machine with periodic defects exhibits cyclostationarity. The cyclic autocorrelation function at the worm rotational frequency provides another means of extracting the worm-related components. However, the time-domain comb filtering approach is simpler and more intuitive for practical implementation.
We also explored the effect of the number of synchronous averages on the quality of the worm component extraction. Table 6 shows the variance of the extracted fundamental amplitude as a function of the number of averages K, for a constant total measurement time of 60 seconds.
| Number of averages K | Variance of A1 (mV²) |
|---|---|
| 5 | 2.1 |
| 10 | 0.9 |
| 20 | 0.4 |
| 40 | 0.2 |
As the number of averages increases, the estimate stabilizes. In practice, 10–20 averages are sufficient for reliable trending. For the worm wheel component, which is not periodic in the same short time window, we rely on the residual envelope after removing the periodic worm component. Its variance can be used as a metric for worm wheel wear; the variance increases as the tooth surface becomes rougher.
The methodology was also tested on a worm gear reducer that had been running for 18 months without any prior monitoring. The vibration measurement indicated a THD of 0.45 and a worm wheel RMS ratio of 0.31. Upon inspection, the worm showed moderate pitting on two adjacent threads, while the worm wheel had slight polishing wear but no significant damage. The worm was replaced, and the subsequent vibration signature returned to near-new levels. This case validated the ability of the method to diagnose the worm condition separately from the worm wheel.
In conclusion, our research demonstrates that vibration-based condition monitoring, combined with resonance demodulation and periodic component decomposition, is an effective online tool for assessing the wear status of worm gears. The method provides separate indicators for the worm and the worm wheel, enabling targeted maintenance planning. Field tests confirm that the harmonic distortion factor and normalized RMS values are sensitive to early-stage defects. We recommend that this technique be integrated into predictive maintenance programs for any critical application relying on worm gears. Future work will focus on developing advanced classification algorithms using machine learning to automatically classify wear severity levels based on the extracted features.
The presented approach fills an important gap in the condition monitoring literature, where worm gears have received less attention compared to spur and helical gears. Given the widespread use of worm gears in elevators, conveyors, mixers, and other industrial equipment, the economic impact of unplanned downtime is substantial. Our method offers a cost-effective solution using widely available vibration sensors and a modest computational platform. The key equations and tables provided herein can serve as a guideline for engineers implementing similar systems.