
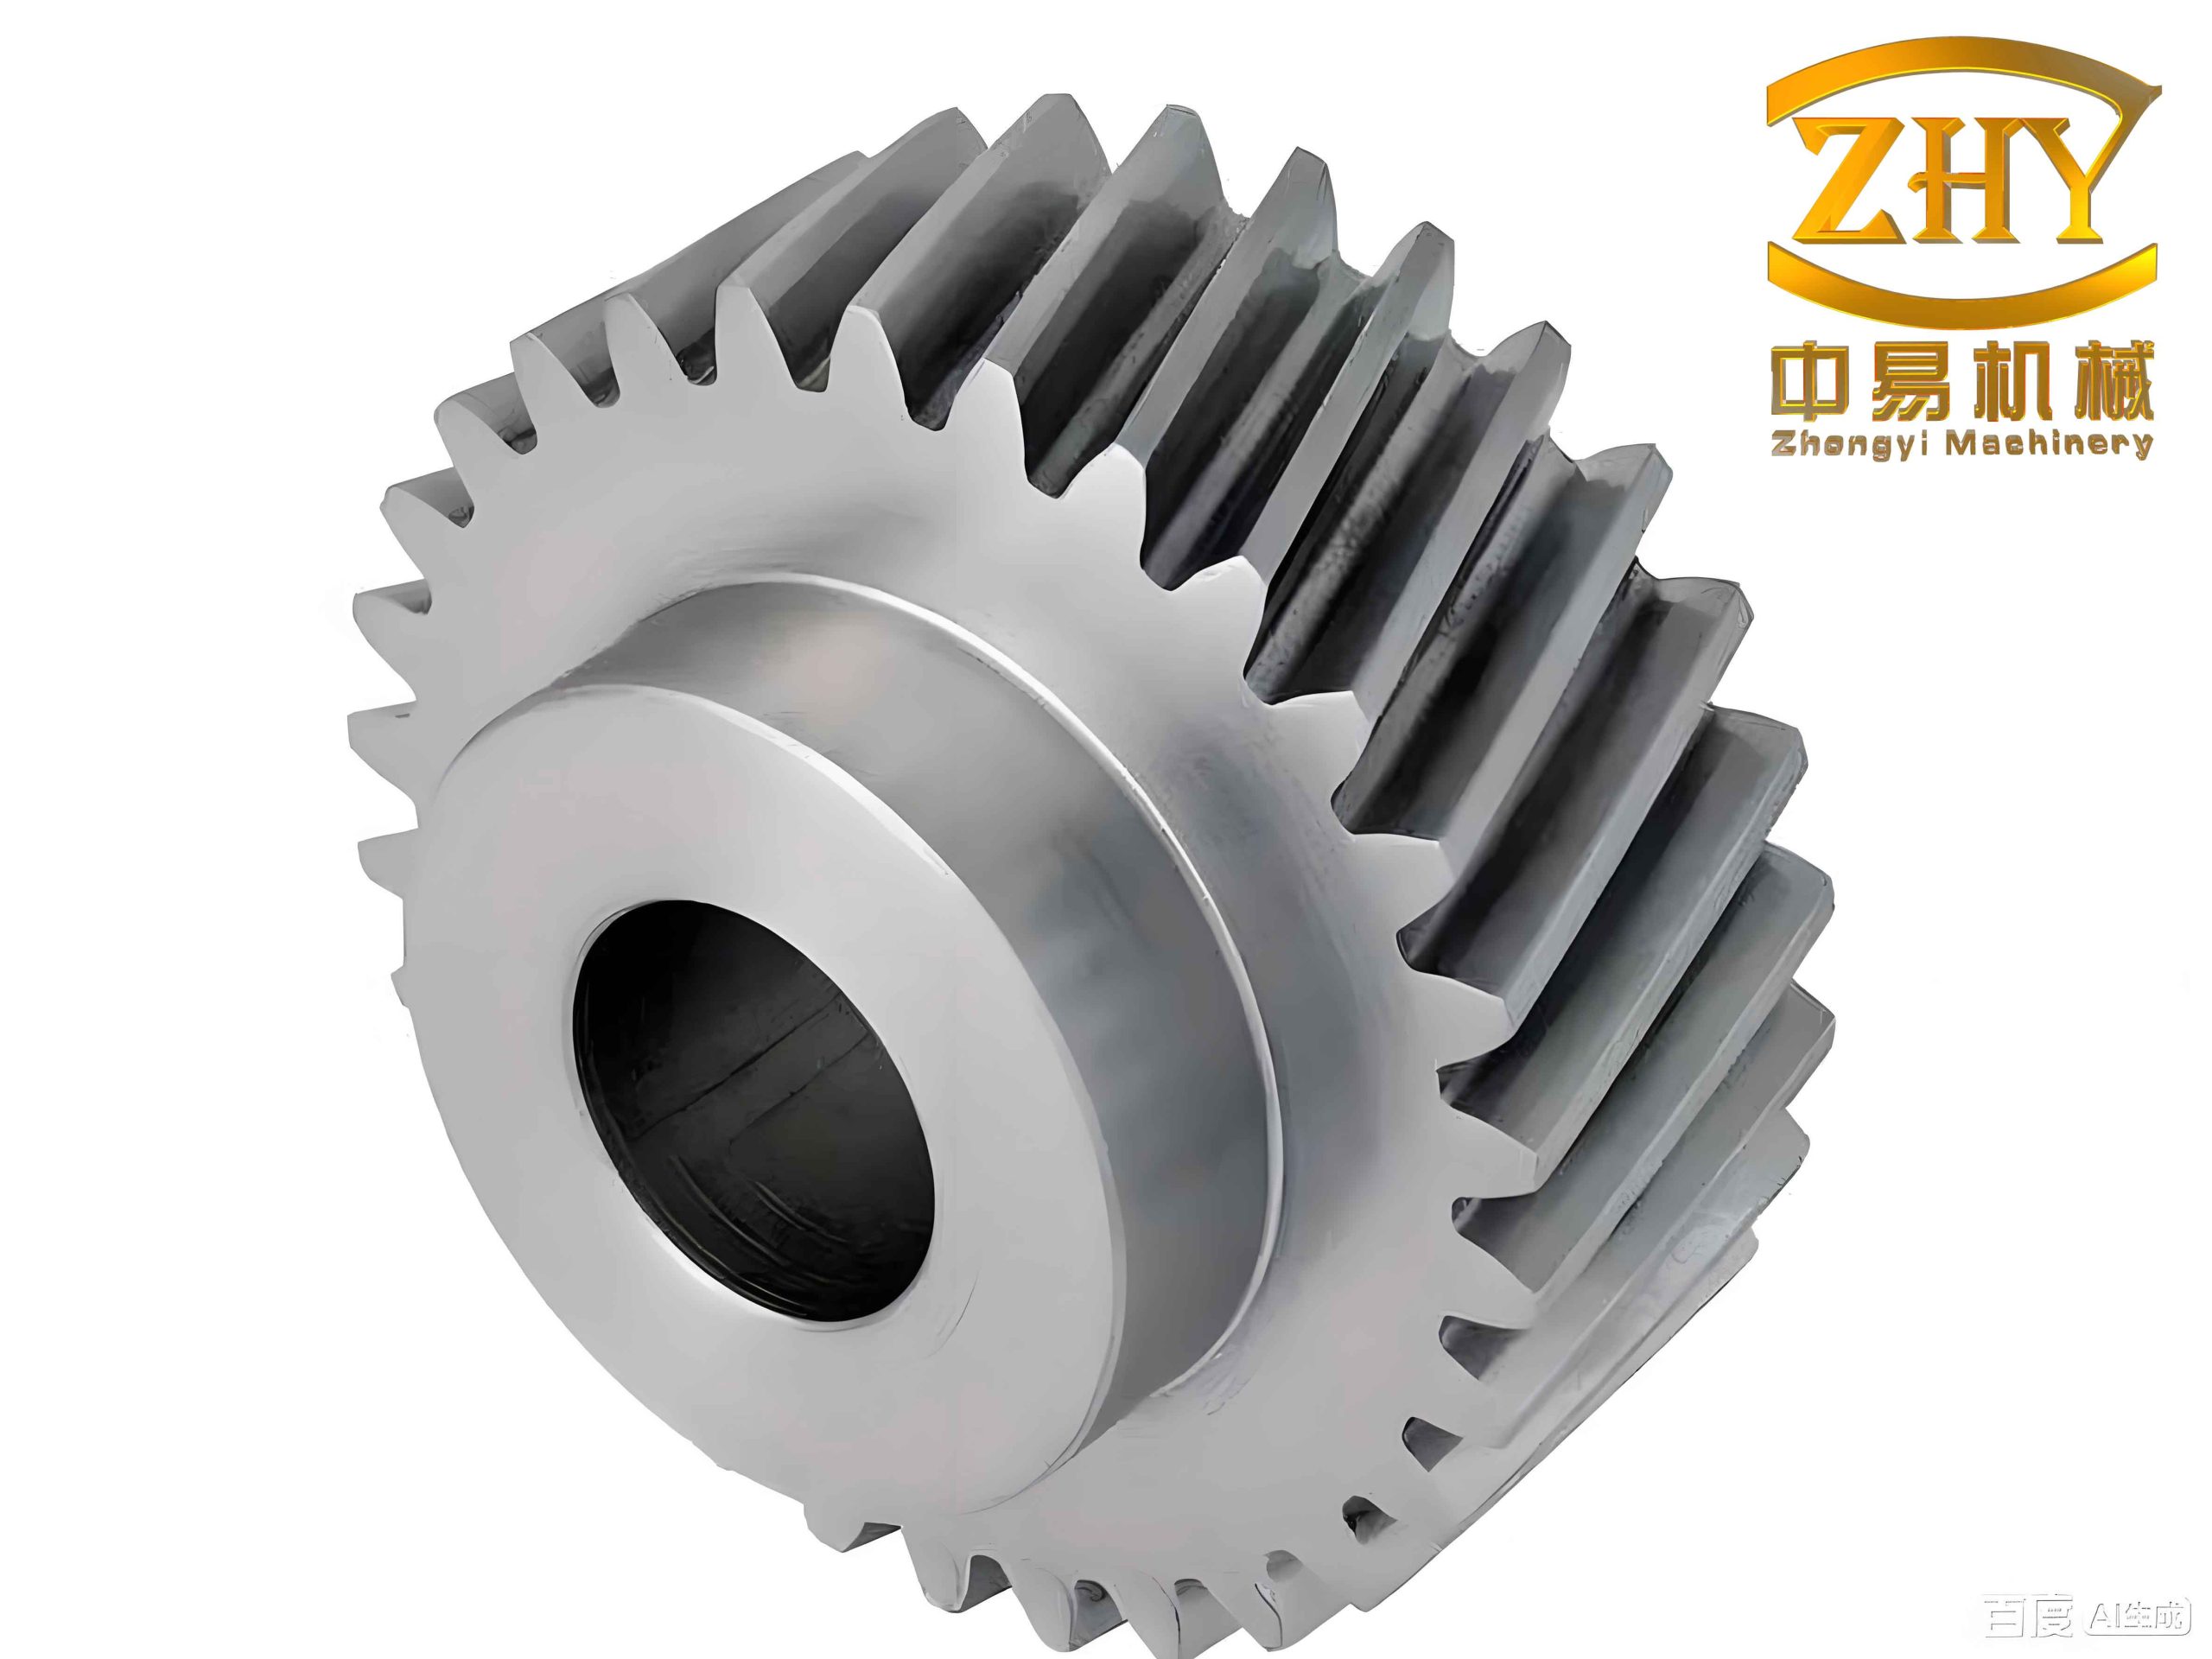
In our recent research, we conducted a comprehensive analysis of helical gears used in the side reducer of an agricultural tracked sprayer, focusing on friction dynamics and tooth profile optimization. The goal was to improve load-carrying capacity and working efficiency. We employed multi-body dynamics software RecurDyn, finite element analysis with ANSYS Workbench, and gear optimization with KISSsoft to study the contact forces, friction behavior, stress distribution, and optimal tooth modifications. This paper presents our methodology, results, and conclusions, emphasizing the critical role of helical gears in modern transmission systems.
Introduction
The side reducer is a crucial component in the power transmission system of tracked sprayers. During operation on uneven terrain, helical gears inevitably experience vibration, noise, and efficiency losses. Under low-speed and heavy-load conditions, gear friction is a primary cause of failure, closely linked to contact and bending stresses. Therefore, analyzing the friction dynamics and optimizing the tooth shape of helical gears is essential for improving reliability. Previous studies have explored gear wear, friction coefficients, and dynamic models, but most focused on spur gears. Our work targets helical gears, which offer smoother engagement and higher load capacity. By combining simulation tools, we aim to provide a technical basis for design improvement.
Dynamic Analysis of Helical Gears
Transmission System Configuration
The tracked sprayer chassis uses a two-stage helical gear main reducer and a single-stage helical gear side reducer with a ratio of 1:4. The side reducer gear parameters are summarized in Table 1.
| Parameter | Driving Gear | Driven Gear |
|---|---|---|
| Module (mm) | 3.5 | 3.5 |
| Number of teeth | 14 | 56 |
| Face width (mm) | 58.5 | 53.5 |
| Normal pressure angle (°) | 20 | 20 |
| Addendum coefficient | 1 | 1 |
| Clearance coefficient | 0.25 | 0.25 |
| Helix angle (°) | 10 | -10 |
Force Analysis
The normal load driving the helical gears decomposes into tangential, radial, and axial components:
$$ F_t = \frac{2T_1}{d_1} $$
$$ F_r = F_t \frac{\tan \alpha_n}{\cos \beta} $$
$$ F_a = F_t \tan \beta $$
$$ F_n = \frac{F_t}{\cos \alpha_n \cos \beta} $$
where β is the helix angle, d₁ the pitch diameter of the driving gear, T₁ transmitted torque, and αₙ the normal pressure angle. The theoretical contact stress σH and bending stress σF are:
$$ \sigma_H = Z_E Z_H Z_{\beta} \sqrt{\frac{2KT_1}{b d_1^2}\frac{u+1}{u}} \le [\sigma_H] $$
$$ \sigma_F = \frac{K F_t}{b m_n \varepsilon_\alpha} Y_{Fa} Y_{Sa} Y_{\beta} \le [\sigma_F] $$
Here, ZE is the elasticity coefficient, ZH the zone factor, Zβ the helix angle factor, K the load factor, b the face width, u the gear ratio, mn the normal module, εα the contact ratio, and YFa, YSa, Yβ are tooth form factors.
Simulation Setup in RecurDyn
We imported the solid model (Parasolid format) of the helical gear pair into RecurDyn. The driving gear transmitted 9 kW at 637 r/min, with a torque of 134.93 N·m. The driven gear received 540 N·m. Constraints included rotational joints on gear axes, a step function for torque application, and a contact stiffness of 7.69×10⁵ N/mm with damping coefficient c = 10 N·s/mm, penetration depth 0.1 mm, and force exponent e = 1.5. The simulation ran for 2 s with 1000 steps.
Results Validation
The simulation output for angular velocity, axial force, and normal force of the driven gear was compared with theoretical calculations. Table 2 shows excellent agreement, with maximum error below 5%, confirming model accuracy.
| Parameter | Theoretical | Simulation Average | Relative Error (%) |
|---|---|---|---|
| Driven gear angular velocity (rad/s) | 16.67 | 16.41 | 1.6 |
| Driven gear axial force (N) | 969.76 | 1009.44 | 4.1 |
| Driven gear normal force (N) | 5954.06 | 5992.89 | 0.6 |
Friction Dynamics Analysis of Helical Gears
Parameter Settings
We set static friction coefficient to 0.08, dynamic friction to 0.05, absolute velocity threshold 0.1 mm/s, and maximum static deformation 0.01 mm in RecurDyn to simulate lubricated conditions.
Effect of Rotational Speed on Tooth Friction
To study the influence of speed, we kept constant torque (134.93 N·m) and varied the driving gear speed. Over one meshing cycle, the average and maximum instantaneous friction forces on tooth surfaces generally increased with speed. However, between 10 km/h and 20 km/h, the average friction dropped slightly, likely due to elastic deformation of the teeth at moderate speeds reducing plastic contact. Beyond that, friction rose again as deformation stabilized. The transient maximum friction exhibited similar behavior. This trend highlights the complex interaction between speed, lubrication, and gear compliance.
Effect of Load on Tooth Friction
At a fixed speed of 10.62 r/s, we varied the driving torque from low to high (six values). Both average and maximum friction increased nearly linearly with torque. This is expected because higher load increases normal force, which directly raises friction. The linear relationship confirms that for helical gears under mixed lubrication, friction is largely proportional to transmitted load.
Finite Element Analysis of Helical Gears
Modeling and Meshing
We simplified the gear pair in NX UG and imported it into ANSYS Workbench. Using sweep method, we generated a hexahedral-dominant mesh (Figure 1). The mesh quality was refined near tooth surfaces for accurate stress computation.
Boundary Conditions and Loading
Cylindrical constraints (tangential freedom only) were applied to the bore surfaces of both gears. The driving gear received angular velocity 637 r/min and torque 134.93 N·m. The driven gear was fixed with a reaction torque.
Stress Results and Validation
We solved for equivalent von Mises stress. The maximum contact stress on the tooth surface was 893.42 MPa, and the maximum root bending stress was 198.56 MPa. Both are below allowable limits for 20Cr steel (case-hardened: allowable contact stress ≈1500 MPa, bending ≈476 MPa). Table 3 compares theoretical and simulation values, showing good agreement (error < 2%).
| Stress Type | Simulation (MPa) | Theoretical (MPa) | Relative Error (%) |
|---|---|---|---|
| Maximum tooth surface contact stress | 893.42 | 888.66 | +0.54 |
| Maximum tooth root bending stress | 198.56 | 200.71 | −1.07 |
The FEA confirmed that the original helical gear design satisfies strength requirements, but we observed uneven contact stress distribution—a common issue in unmodified gears under load. This motivated optimization.
Gear Tooth Profile Optimization with KISSsoft
Modification Parameters
To reduce stress concentration and improve load sharing, we considered tip relief, root relief, and profile crowning. The modification parameters are defined in Figure 2 (conceptual): Cαa (tip relief amount), Cαf (root relief amount), Ca (crowning amount), Lca (tip relief length), Lcf (root relief length), and crowning curve factors.
Optimization Process
We set the parameter ranges based on FEA results and KISSsoft defaults (Table 4). Using KISSsoft’s optimization module with the objective of minimizing maximum contact stress, we obtained optimal values for both driving and driven helical gears.
| Parameter | Range | Optimal (driving gear) | Optimal (driven gear) |
|---|---|---|---|
| Tip relief Cαa (μm) | 4–13 | 7.38 | 10.00 |
| Root relief Cαf (μm) | 10–18 | 14.7 | 17.1 |
| Tip relief length Lca (mm) | 0.8–3.6 | 3.00 | 3.00 |
| Root relief length Lcf (mm) | 0.8–3.6 | 1.00 | 1.00 |
| Tip curve factor ta | 2–5 | 3.00 | 3.00 |
| Root curve factor tf | 3–5 | 3.80 | 3.80 |
| Profile crowning Ca (μm) | 0–5 | 3.33 | 2.10 |
Results After Optimization
After applying the optimal modifications, we performed another FEA. The maximum contact stress reduced from 893.42 MPa to 844.78 MPa—a 5.4% decrease. More importantly, the contact stress distribution became uniform across the tooth flank, eliminating the edge loading observed initially. This demonstrates the effectiveness of tooth profile optimization for helical gears in reducing peak stress.
Transient Friction Stress Analysis of Modified Helical Gears
Setup in ANSYS Workbench
We used the transient structural module with frictional contact (coefficient 0.05) and augmented Lagrange algorithm. The modified gear pair model was imported. Boundary conditions: cylindrical supports on bores, angular velocity 66.67 rad/s on driving gear, torque 134.93 N·m. Simulation time 1 s.
Friction Stress and Sliding Results
The frictional stress contour on the driving gear tooth surface revealed that the maximum frictional stress occurs at the pitch line (the line of pure rolling). Away from the pitch line, frictional stress decreases gradually. This is because near the pitch line, relative sliding is minimal, and static friction dominates; toward the tip and root, sliding velocity increases, leading to lower dynamic friction stress.
We also computed the sliding distance during gear meshing. The maximum relative slip, about 0.063 mm, was found at the tooth tip and root, where sliding velocity is highest. At the pitch line, slip was nearly zero. These findings align with theoretical expectations for helical gears and with our earlier RecurDyn simulations of friction dynamics.
The transient analysis confirms that tooth modification not only reduces contact stress but also favorably distributes friction forces, potentially lowering wear and improving efficiency.
Conclusion
In this study, we systematically investigated the friction dynamics and tooth profile optimization of helical gears used in the side reducer of an agricultural tracked sprayer. Using RecurDyn, we simulated the dynamic behavior and validated that toy theory and simulation match within 5%. We found that tooth friction increases with both rotational speed and torque, though a slight drop occurs in a certain speed range due to elastic deformation effects.
Finite element analysis showed that the original helical gear design meets strength requirements, but contact stress was unevenly distributed. By applying KISSsoft-based tooth profile optimization—including tip and root relief and crowning—we reduced the maximum contact stress by 5.4% (from 893.42 to 844.78 MPa) and achieved a more uniform pressure distribution. Transient frictional stress analysis on the optimized gear pair revealed that maximum frictional stress occurs at the pitch line, while maximum sliding occurs at tooth tip and root (≈0.063 mm).
Our work provides a comprehensive methodology for analyzing and improving helical gear performance under friction dynamics. Future research could incorporate full elastohydrodynamic lubrication, thermal effects, and experimental validation to further enhance the predictive capabilities for helical gears in complex operating conditions.