
Chapter 1 Introduction
1.1 Research Background
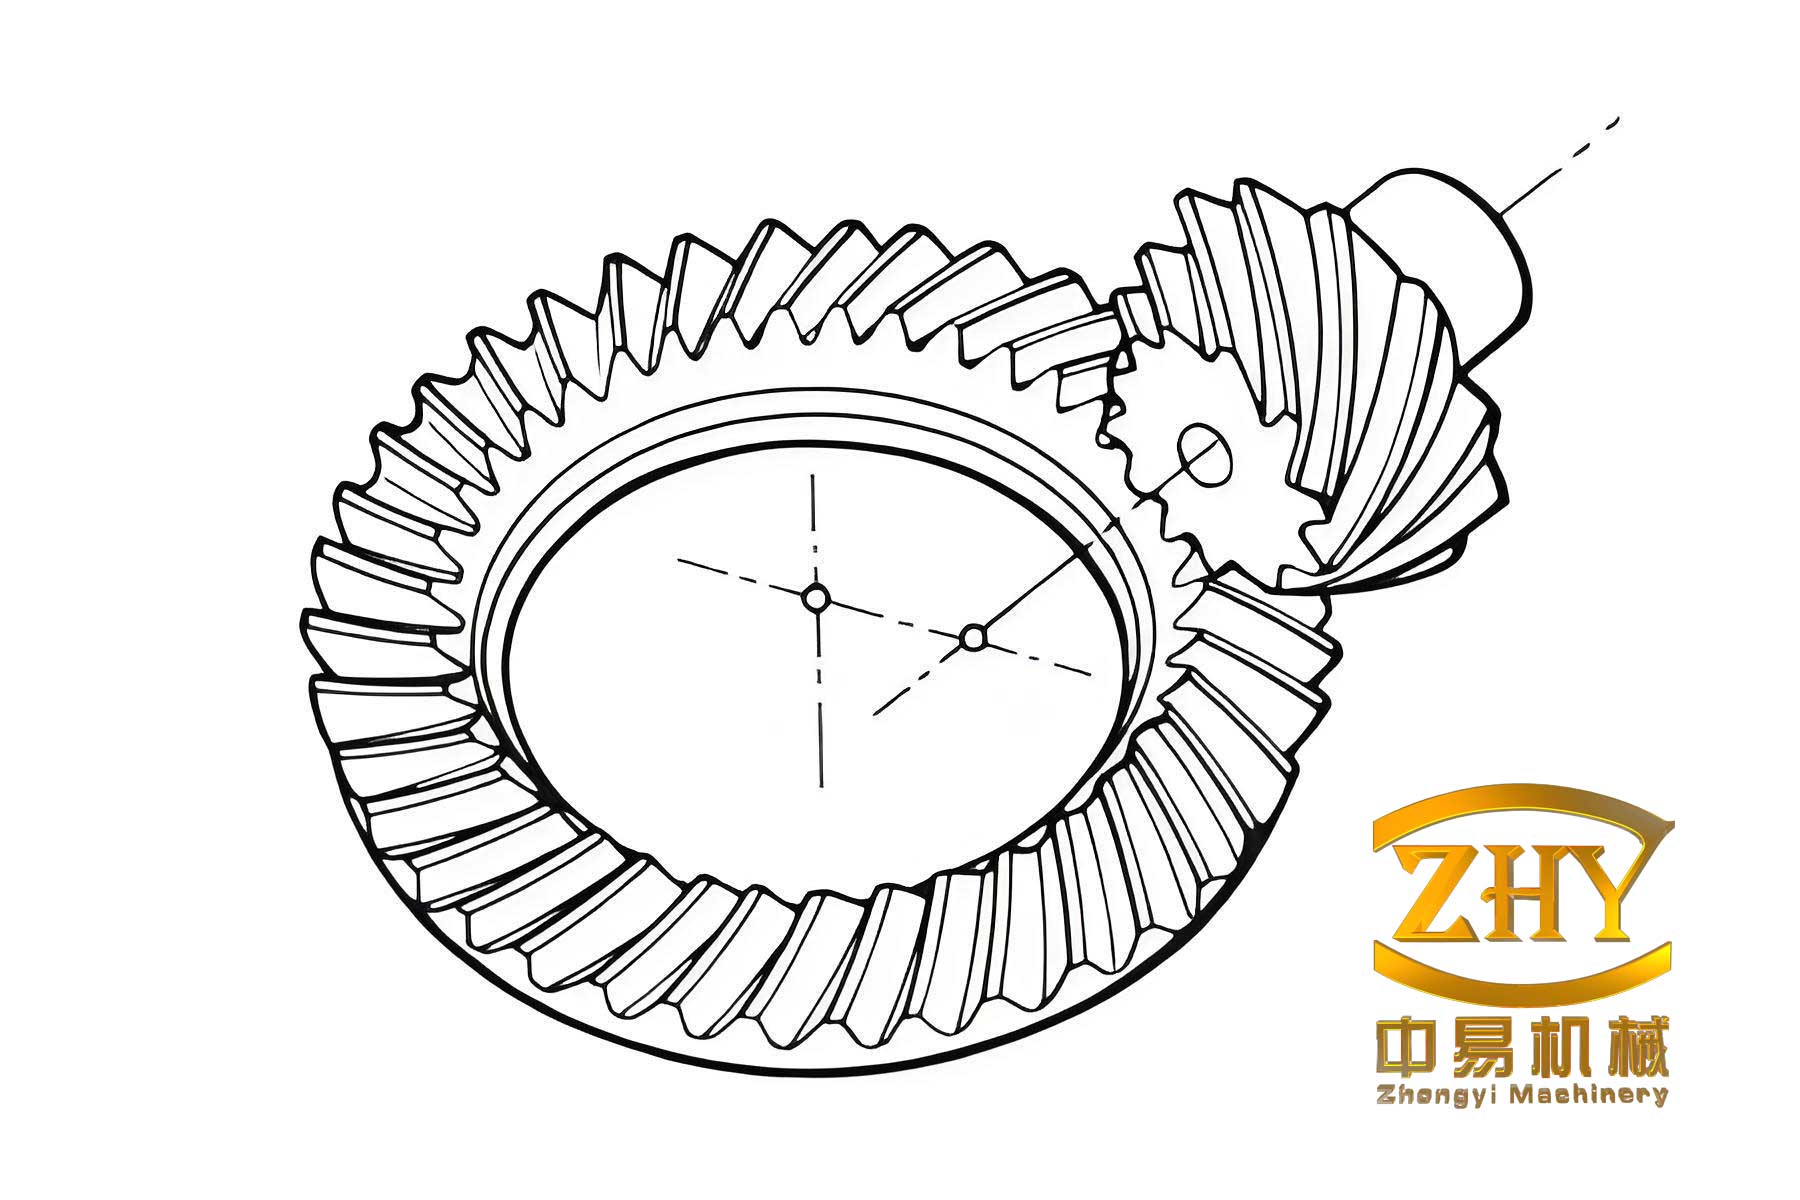
Hypoid gears are widely used in the final drive assemblies of rear-wheel-drive vehicles. Their complex geometric configuration allows smooth meshing even under substantial loads during vehicle operation. To ensure machining precision and strength, hypoid gears typically undergo three major manufacturing processes: cutting, heat treatment, and gear lapping. The meshing performance of hypoid gear pairs is closely related to the NVH (Noise, Vibration, and Harshness) performance of the main reducer. The noise generated by the main reducer primarily originates from the meshing impact of the gear pair. Gear lapping is the final finishing process in gear manufacturing, and the quality of the lapped gear pair is generally evaluated by the contact pattern quality and the transmission error value measured on a rolling tester.
The NVH problems of the main reducer include three indicators: noise, vibration, and harshness. Among these, harshness describes the subjective feeling of the driver and is difficult to quantify numerically, while vibration affects the noise level to a certain extent. Therefore, this paper adopts the peak noise under the fifth-gear acceleration and fifth-gear coast-down conditions of the main reducer as the evaluation index of its NVH performance. The research object of this paper originates from a popular rear-wheel-drive MPV model produced domestically. A large amount of vehicle road test data shows that the rear axle main reducer noise differs from the vehicle noise by approximately 5 to 10 dB(A). According to the relevant provisions of “GB-1495-2002 Limits and Measurement Methods for Noise Emitted by Accelerating Motor Vehicles” and considering the riding comfort of the vehicle, the vehicle noise of this model should be controlled below 70 dB(A). Therefore, for this main reducer, good NVH performance is manifested as a peak noise below 60 dB(A) under the fifth-gear acceleration condition and below 65 dB(A) under the fifth-gear coast-down condition (with an error not exceeding 3 dB(A)). Once the NVH standards for the two operating conditions of the main reducer are established, the research focus shifts to exploring the dynamic matching between the gear pair transmission error and the main reducer NVH performance, rather than simply reducing the transmission error value.
1.2 Research Purpose and Significance
The design and machining of hypoid gear pairs are relatively complex. After cutting and heat treatment, the transmission error of the gear pair tends to increase in both value and fluctuation. An appropriate transmission error value is crucial for the NVH performance of the main reducer. In an ideal scenario, the smaller the transmission error after lapping, the better the NVH performance of the main reducer. However, in practice, the lapped gear pair needs to be assembled into the main reducer together with the reducer housing, differential, and other components. During this assembly process, installation errors are inevitably introduced. Actually machined hypoid gear meshing tooth surfaces are locally conjugate. Presetting a certain transmission error value is particularly important for offsetting the installation errors of locally conjugate tooth surfaces. Therefore, the relationship between the transmission error after lapping and the NVH performance of the main reducer is not a simple “the smaller the better” relationship, and the corresponding relationship between the two needs further experimental verification.
For a long time, the issue of transmission error values has been confined to controlling below a certain standard value or “the smaller the better.” However, research on the specific range of values is rarely reported in the literature both domestically and internationally. In this paper, through vehicle road tests on sampled gear pairs and their corresponding main reducers, it was found that a smaller transmission error does not necessarily lead to better main reducer NVH performance. To ensure the NVH performance of the main reducer, the transmission error value should be within an upper and lower limit range. Meanwhile, based on order tracking analysis principles and the NVH test bench, extensive NVH bench tests were conducted on main reducers. The data results were analyzed using smooth spline fitting, yielding the specific transmission error range when the main reducer NVH performance is good. Furthermore, by optimizing the gear lapping equipment parameters, the transmission error value after lapping was significantly reduced and fell within the appropriate range. The vehicle test results also showed good performance. This research provides a reference for determining the transmission error value of gear pairs, optimizing the transmission error after lapping, and improving the NVH performance of the main reducer.
1.3 Literature Review
1.3.1 Research Status of Transmission Error Optimization
The analysis, optimization, and noise impact analysis of hypoid gear transmission errors constitute the most fundamental gear research. Foreign scholars have conducted earlier and more mature research in this area. The American Gleason Company has reached a monopoly position in hypoid gear research since its establishment in 1865. Regarding the control of transmission errors, technical data published by Gleason indicates that the transmission error of hypoid gear pairs is closely related to the noise they generate. As the transmission error increases, the meshing noise also increases. However, if the transmission error is too small, it cannot absorb installation and load-induced linear errors, and conversely, the meshing noise may become louder. Setiawan Y D et al. established a mathematical model of a multi-speed transmission for electric vehicles and proposed a standard for transmission error calculation in electric drive axles. Catera P G et al. proposed a method to reveal the influence of tooth profile errors and their variations on gear vibration. Simon proposed a design and manufacturing method for spiral bevel gears to reduce transmission errors. Diez-Ibarbia A et al. used gear pair vibration to identify modal parameters and gear errors, studying the relationship between transmission errors and gear pair meshing performance.
In China, Liu Guanglei et al. optimized the transmission error curve of spiral bevel gears using a double-layer adjustment method. Chen Qinglan et al. studied a two-stage gear transmission system, collected dynamic transmission error values of gear pairs using measurement equipment, and simultaneously detected vibration signals of the gear pairs, showing that fluctuations in transmission error also cause noise fluctuations. Mou Yanming et al. proposed a method to optimize high-order transmission errors by combining the feedback results of the contact zone and high-order transmission errors on the basis of theoretical gear models to adjust machining parameters. Su Jinzhan et al. proposed a design method for a symmetric second-order parabolic transmission error curve that can effectively absorb vibration and impact during gear pair meshing. Zhou Chi et al. precisely established finite element models of the gear system and reducer housing, analyzing the generation of transmission errors. Chen Hongyue et al. calibrated the error curve based on parabolic transmission error curves combined with tooth profile modification, resulting in a smoother transmission error curve and correspondingly reduced gear pair vibration.
1.3.2 Development Status of Main Reducer Noise Testing Technology
Regarding vehicle testing of hypoid gears and NVH testing methods for main reducers, the advanced automotive technology and systems abroad ensure they have established very sophisticated testing systems and technologies. In 2003, experts from DaimlerChrysler found that the drive system generates corresponding noise at both low and high frequencies, such as low-frequency booming and high-frequency whining, but they did not conduct further vibration analysis on the cause of the noise. Oh Ki-Sug et al. conducted modal analysis on the drive axle system for interior noise, reducing gear meshing impact force and transmission errors through gear modification and modal changes. Jolivet S et al. used noise identification technology to study the influence of tooth surface micro-machining on gear noise. Due to the late start of NVH testing technology in China, most related hardware and software technologies depend on advanced foreign technologies. With the development of computer technology, order tracking analysis has been gradually applied to noise analysis. Wang Jianbao et al. used order tracking technology to analyze the vibration of the entire rear axle transmission system and effectively obtained the noise data of the main reducer. Xu Zhongsi et al. established a mathematical function model of the electric drive axle for the whining noise problem under specific operating conditions of electric vehicles, optimizing the meshing stress and transmission error of the gear pair.
1.3.3 Research Status of Main Reducer NVH Improvement
Regarding measures for controlling transmission errors during gear machining and methods for optimizing main reducer NVH, there are also numerous studies. Price D et al. studied the influence of the transmission error function on the estimated interior noise of an electric rear axle drive. Holehouse R et al. investigated the robustness of drive axle assembly vibration NVH performance using the 6-σ method, combining CAE simulation analysis with test data acquisition to identify gear parameters. Kolivand Mohsen et al. proposed a robustness study on the NVH of hypoid gears, studying the impact of transmission errors on radiated noise and indicating that the transmission error value should not be fixed but rather varies with different installation parameters and loading conditions.
Qian Wangtao conducted force analysis on the internal gears and gear shafts of the rear axle, and optimized the rear axle housing structure using algorithms and software analysis, effectively reducing main reducer noise. Zheng Yusheng combined finite element analysis with boundary element numerical analysis methods to simulate the entire vehicle vibration, finding that the dynamic excitation noise of the main reducer differs from the vehicle noise by only about 5 to 10 dB. Jiang Canqiong used the finite element method to simulate and analyze the reducer housing, strengthening and optimizing unreasonable parts of the housing structure. Pan Xiaodong et al. used MASTA software to optimize and simulate transmission design parameters.
1.4 Main Research Contents
The research content of this paper originates from the project “Research on Manufacturing Consistency Quality Improvement of Rear Axle Reducers” of a domestic automobile enterprise, which has been successfully completed and applied to actual production. For a certain rear-wheel-drive MPV model, this paper studies the relationship between the transmission error value of the hypoid gear pair in the rear axle and the peak noise of the corresponding main reducer under fifth-gear conditions, and proposes measures for transmission error control and NVH optimization. With the help of NVH vehicle road tests, the NVH performance of the main reducer under different transmission errors was investigated. Based on the fitting curve analysis of rear axle NVH bench test data, the transmission error range of hypoid gears corresponding to good main reducer NVH performance was summarized. This research solves the problem of what transmission error value should be taken to ensure that the NVH performance of the main reducer meets requirements. Furthermore, the transmission error value is controlled by optimizing lapping parameters, thereby improving the NVH performance of the main reducer.
The main research contents of this paper include:
(1) Establish a vibration model of the hypoid gear pair meshing system, analyze the transmission error curve of the gear pair and the noise generation mechanism. Use Gleason 350GMM gear profile measuring equipment to detect the changes in gear profile errors before and after lapping of hypoid gears, and record the transmission error values measured by the Gleason 600HTT rolling tester before and after lapping.
(2) Under the premise of controlling contact pattern consistency, explore the NVH level of the main reducer under different transmission errors of hypoid gear pairs with the help of NVH vehicle road tests.
(3) To break through the limitations of vehicle road tests, use the rear axle NVH test bench combined with order tracking analysis principles to simulate the fifth-gear acceleration and fifth-gear coast-down conditions, and conduct NVH tests on main reducers corresponding to gear pairs with varying transmission error values.
(4) Perform fitting analysis on the corresponding data of gear pair transmission error and main reducer peak noise obtained from NVH bench tests. The analysis reveals that when the transmission error of the drive side is 8-12 μrad and the coast side is 4-8 μrad, the corresponding main reducer peak noise under fifth-gear acceleration is below 60 dB(A) and below 65 dB(A) under fifth-gear coast-down.
(5) To ensure that the transmission error after lapping is within the range of 8-12 μrad on the drive side and 4-8 μrad on the coast side, design a three-level three-factor orthogonal experiment to optimize the tooth side clearance, spindle speed, and lapping cycle times in the lapping process. A comparative test on spindle speed was also designed to further determine the optimal spindle speed.
Chapter 2 Transmission Error and Noise Generation Mechanism
2.1 Vibration Model of Gear Pair System
During the machining of hypoid gears with equal tooth height, when the machine tool cradle performs rotary motion, the machining cutter head also performs rotary motion. If these two motions are combined as the motion of a “plane gear,” the plane gear and the workpiece in motion have relative motion, and continuous cutting is equivalent to two bevel gears performing meshing motion. The hypoid gears with equal tooth height studied in this paper are formed by the meshing motion between the gear being machined and the assumed “plane gear.”
The inherent errors of the gear pair during manufacturing cause dynamic excitation during meshing operation, which is the root cause of gear vibration and noise. Generally, when the gear pair is subjected to unreasonable external resistance, meshing deviation and impact occur, but this external excitation is controllable for modern precision assembly and loading systems. Even without external excitation, the gear pair will vibrate and impact due to internal excitation, indicating that noise problems caused by internal excitation are very common and should be controlled through the gear pair machining process. The machining of hypoid gears typically involves cutting, heat treatment, and gear lapping. During cutting, the wear of the cutter and the precision attenuation of the cutting machine and fixtures during continuous machining affect the accuracy. Heat treatment causes tooth surface deformation. These deviations cause the preset tooth surface contact points to shift, resulting in contact zone position failure, increased bearing pressure, and transmission errors. Gears with tooth surface errors produce slight impacts during meshing, causing the transmission ratio at that instant to change. Accumulated meshing errors often lead to larger impacts, thereby generating meshing noise.
The correlation between the deviations generated during gear pair meshing and tooth profile errors is generally nonlinear. Establishing a mathematical model of the gear pair transmission incorporating both static transmission errors and the dynamic effects of the entire transmission system is difficult. Therefore, we established a mathematical model of the gear pair transmission, simulating the torque conditions during meshing motion with a vibration system. This vibration model is a single-degree-of-freedom system that can effectively simulate the gear pair transmission force situation. The schematic diagram of the vibration model is shown in Figure 2-2.
In this gear transmission system model, the moment of inertia of the rotating system is denoted by $J$; the radii of the theoretical profile of the gears are $r_{b1}$ and $r_{b2}$; $T$ represents the loading torque of the driving and driven gears; and $\theta_1$ and $\theta_2$ represent the rotation angles of the driving gear and driven gear during meshing.
The equations of motion of the gear pair on the meshing line can be expressed as:
$$M\ddot{x} + C\dot{x} + K(t)(x – e(t)) = W \tag{2-1}$$
where the equivalent mass $M$ and the static normal transmitted load $W$ are given by:
$$M = \frac{J_1 J_2}{J_1 r_{b2}^2 + J_2 r_{b1}^2}, \quad x = r_{b1}\theta_1 – r_{b2}\theta_2 \tag{2-2}$$
$$\frac{T_1}{r_{b1}} = \frac{T_2}{r_{b2}} = W \tag{2-3}$$
where $M$ is the equivalent mass of the hypoid gear pair; $x$ is the displacement on the tooth surface during meshing; $C$ is the damping coefficient; $e$ is the gear manufacturing error; $K$ is the meshing stiffness; and $W$ is the static normal transmitted load of the gear pair system.
If the time-varying meshing stiffness is divided into a constant part and a variable part, and the relative displacement is divided into static relative displacement and dynamic relative displacement, that is:
$$K(t) = \bar{K} + \Delta K, \quad x = \bar{x} + \Delta x, \quad W = \bar{K}\bar{x} \tag{2-4}$$
Substituting (2-4) into (2-1) and neglecting higher-order variables, the meshing motion equation of the gear pair can be transformed into:
$$M\Delta\ddot{x} + C\Delta\dot{x} + \bar{K}\Delta x = -\Delta K e + \Delta K\bar{x} + \bar{K}e \tag{2-5}$$
From this equation, it can be seen that the three main vibration error excitations are manufacturing error excitation, time-varying stiffness excitation, and meshing impact excitation caused by the combination of the first two. The transmission error measured after lapping belongs to the manufacturing error component. Therefore, transmission error is closely related to the NVH of the main reducer.
2.2 Introduction to Transmission Error
During the meshing motion of a gear pair, when the driving gear rotates through a certain angle, the rotation angle of the driven gear can be calculated based on the gear ratio. In practice, due to installation and manufacturing errors, the rotation angle of the driven gear has a certain deviation, and this deviation value is the transmission error. Its expression is:
$$TE = (\varphi_2 – \varphi_2^{(0)}) – \frac{z_1}{z_2}(\varphi_1 – \varphi_1^{(0)}) \tag{2-6}$$
where $\varphi_1^{(0)}$ and $\varphi_2^{(0)}$ are the starting angles of the driving and driven gears at the initial measurement time; $z_1$ and $z_2$ are the tooth numbers of the driving and driven gears; and $\varphi_1$ and $\varphi_2$ are the angles rotated by the driving and driven gears at the end of measurement.
Since the tooth surface meshing line contact of bevel gears is very sensitive to installation parameters, it is very important to preset and control the amplitude of the transmission error curve during the initial gear design stage. The ideal transmission error curve should be designed as a symmetric compound curve composed of sine curves of the same period intersecting at meshing points. The theoretical transmission error calculation formula is:
$$\Delta\varphi_2′ = \varphi_2 – \varphi_2^{(0)} = -\frac{1}{2} m_{21}'(\varphi_1 – \varphi_1^{(0)})^2 \tag{2-7}$$
where $m_{21}’$ is the first derivative of the transmission ratio function; $\varphi_1$ and $\varphi_2$ are the rotation angles of the driving and driven gears during meshing; and $\varphi_1^{(0)}$ and $\varphi_2^{(0)}$ are the rotation angles of the driving and driven gears at the reference point.
2.3 Analysis of Factors Affecting Transmission Error
The main factors affecting the transmission error of hypoid gears originate from the tooth profile and tooth surface errors generated during machining and the installation errors during assembly. The latter depends on the assembly and housing manufacturing accuracy. In production, gear machining errors are generally studied. To investigate the changes in gear tooth profile errors and their influence on transmission errors, the Gleason GMM350 three-coordinate gear profile measuring equipment was used for relevant measurements. Ten gear pairs were selected and their transmission error values before and after lapping were recorded. The measurement results show that the changes in spiral angle error after lapping are within 1.5′, the pressure angle changes are within 4′, the tooth profile changes are within 4 μm, and the cumulative pitch error changes are approximately 11 μm, which is three times the tooth profile change. This indicates that the gear accuracy change after lapping is mainly the change in pitch error. The transmission error values before and after lapping decrease sharply after lapping, indicating that the pitch error is the largest contributor to transmission error among gear machining errors, and the lapping process can effectively control the transmission error.
The pitch error of the gear pair affects the meshing performance and transmission error in the following way. When the gear pair meshes, due to pitch error, the meshing point shifts along the normal direction. The transmission error curve is no longer a symmetric parabola but a composite curve with increasing amplitude, causing the meshing points to shift and the curve to fluctuate asymmetrically. This breaks the normal meshing of the gear pair, causing uneven loading on the tooth contact area, producing meshing impact, and significantly affecting the vibration noise and strength of the gear.
Chapter 3 Vehicle Road Test Study of Main Reducer NVH under Different Transmission Errors
3.1 NVH Road Test System
The vehicle NVH road test system is based on the LMS Test.Lab vibration and noise testing software system, combined with a multifunctional hardware front-end, which can meet the noise analysis and testing requirements under various conditions. During the road test, speed and acceleration sensors collect and record the speed signals of the vehicle power shaft. Noise microphones placed at the rear seat and rear axle housing collect sound signals from the vehicle and the main reducer. The entire front-end data is integrated and recorded by the LMS SCADAS system. The output results of this road test system include two sets of weighted sound pressure level noise signals: one set represents the sound pressure level of the vehicle noise under different driving conditions, recorded as “Overall level” in the NVH curve, and the other set represents the meshing noise sound pressure level of the main reducer at a specific order. Since the meshing order of the main reducer relative to the engine shaft is 12.52 for this vehicle model, it is recorded as “12.52nd order” in the NVH curve.
3.2 Weighted Sound Level
Sound pressure is the pressure change in the medium caused by sound waves propagating. Since the human ear’s actual perception of sound is very different at different auditory frequencies, a weighting network is usually installed on the sound level meter. The weighting network attenuates the received sound at different frequencies to match the human ear’s auditory characteristics. The sound level meter has three weighting networks: A, B, and C. The A-weighting network is more sensitive to high frequencies and less sensitive to low and medium frequencies, which is close to the human ear’s sensory characteristics. The A-weighted sound level is adopted as the noise measurement and evaluation index worldwide, with the unit dB(A). In this paper, the peak noise of the main reducer under the A-weighted sound level is used as the measurement standard.
The formula for calculating the sound pressure level is:
$$L_P = 10\lg\frac{P^2}{P_0^2} \tag{3-3}$$
where $P$ is the sound pressure to be measured and $P_0 = 2\times10^{-5}$ Pa is the reference sound pressure.
3.3 NVH Road Test Conditions and Scheme
From the initial batch of 360 gear sets after cutting and heat treatment, 27 gear sets were selected for lapping, resulting in good contact pattern consistency and qualified transmission error values. Ten gear sets were randomly selected from the machined 27 gear sets as the objects for vehicle test verification. The main reducer NVH test conditions are shown in Table 3-1.
| Main Reducer Condition | Engine Output Speed |
|---|---|
| 5th gear acceleration | 2000~3600 r/min |
| 5th gear coast-down | 3600~2000 r/min |
The road test procedure involves: (1) labeling and coding the gear pairs with QR codes for full data tracking; (2) preparing two sets of main reducer housings, dividing the 10 gear pairs into two groups, each set of housing testing 5 gear pairs; (3) checking the contact pattern of the assembled gear pair using a rolling tester before vehicle installation; (4) installing each main reducer into the same special axle housing; (5) conducting NVH tests sequentially.
To control variables, the contact patterns of the 10 gear pairs after lapping were all in the middle-to-small position with good consistency, as shown in the contact pattern records. The reducer housing parameters were also controlled by optimizing the differential housing fixture structure and increasing equipment precision inspection frequency. The five special control items and requirements are listed in Table 3-3.
| Special Control Item | Differential Housing | Reducer Housing | ||
|---|---|---|---|---|
| Runout of Driven Gear Mounting Surface/mm | Bearing Housing Coaxiality/mm | Bearing Bore Diameter/mm | Offset Distance/mm | Perpendicularity of Driving and Driven Gear Axes/mm |
| 0.04 | 0.016 | φ72(-0.01,-0.03) | 25±0.02 | 0.04 |
After optimization, the qualification rate of all parameters reached 100%, ensuring the consistency of the housing.
3.4 Analysis of Main Reducer NVH Road Test Results
The 10 gear pairs were numbered 1 to 10. The transmission error and the corresponding main reducer peak noise values under the two conditions are shown in Table 3-5.
| Gear No. | Drive Side / 5th Gear Acceleration | Coast Side / 5th Gear Coast-down | ||
|---|---|---|---|---|
| Transmission Error/μrad | Peak Noise/dB(A) | Transmission Error/μrad | Peak Noise/dB(A) | |
| 1 | 17 | 68.67 | 15 | 68.49 |
| 2 | 10 | 60.30 | 7 | 63.09 |
| 3 | 7 | 71.39 | 5 | 70.87 |
| 4 | 22 | 72.62 | 14 | 71.43 |
| 5 | 16 | 69.54 | 10 | 67.55 |
| 6 | 13 | 60.34 | 8 | 65.46 |
| 7 | 15 | 67.51 | 16 | 69.52 |
| 8 | 17 | 66.87 | 17 | 70.84 |
| 9 | 20 | 70.61 | 15 | 67.45 |
| 10 | 11 | 61.36 | 13 | 68.91 |
The results show that gear pair No. 3 with the smallest transmission error exhibited the worst NVH performance, while gear pair No. 2 with a moderate transmission error showed the best NVH performance. This confirms that the transmission error of hypoid gears is not the smaller the better, and there is a range-valued correspondence between the transmission error and the NVH performance.
Chapter 4 Research on the Influence of Transmission Error on Main Reducer NVH Based on Bench Testing
4.1 Order Tracking Analysis for NVH Testing
To obtain sufficient data, the NVH bench test method is adopted. The rear axle assembly can be regarded as a structurally and functionally complex gearbox. Using power spectrum analysis methods is difficult for identifying the noise signals of the main reducer. The order tracking analysis method used in this paper tracks the noise signals of the gear pair at a fixed meshing order, avoiding the errors caused by spectrum analysis and yielding more accurate analysis results.
The nature of order tracking analysis is frequency analysis. In gear transmission systems, the analysis mainly focuses on the speed signal and frequency signal of the reference rotating shaft. The relationship between the gear pair meshing frequency $f$, the order $c$, and the reference shaft speed $n_1$ is given by:
$$c = f / n_1 \times 60 \tag{4-5}$$
The meshing frequency of the gear pair is calculated as:
$$f = z n_2 / 60 \tag{4-6}$$
where $z$ is the number of teeth and $n_2$ is the gear speed. Combining the above two equations, the meshing order of the gear pair can be calculated as:
$$c = z n_2 / n_1 \tag{4-7}$$
For this research vehicle, the fifth gear ratio is 0.799, and the driving gear of the main reducer has 10 teeth. Therefore, the meshing order of the main reducer gear is $c = 10 / 0.799 = 12.52$.
4.2 Order Tracking Calculation Method
For non-periodic signals that are complex and difficult to analyze, they can be treated as periodic signals with infinite period, which is the principle of the Fourier transform. The Fourier transform pair is defined as:
$$F(f) = \int_{-\infty}^{+\infty} f(t) e^{-j2\pi ft} dt \tag{4-8}$$
$$f(t) = \int_{-\infty}^{+\infty} F(f) e^{j2\pi ft} df \tag{4-9}$$
FFT (Fast Fourier Transform) is a fast algorithm for DFT. For a sequence of length N, the FFT formula is:
$$X(k) = X_1(k) + W_N^k X_2(k), \quad X(k + N/2) = X_1(k) – W_N^k X_2(k) \tag{4-10}$$
where $k = 0, 1, 2, \ldots, N/2-1$.
The digital order tracking technology combines hardware technology and advanced software analysis technology. It records signals based on the revolutions of the rotating shaft speed rather than time. In the FFT spectrum, the signal at the corresponding order can be displayed with the horizontal axis being the order or speed. This technology is widely used in the analysis of rotating mechanical systems, such as automotive NVH research.
4.3 NVH Bench Test
The main reducer NVH bench was developed by a domestic automobile enterprise. The bench system uses high-precision motor drive, loading, and control systems, equipped with the LMS Test.Lab vibration and noise testing software system. It can simulate various driving conditions, speeds, and loading situations of the main reducer without difference and with high precision. The bench mainly consists of a drive and loading system, main reducer fixture, anechoic chamber, sensor system, and temperature control system. The anechoic chamber parameters are listed in Table 4-3.
| Item/Model | Anechoic Chamber |
|---|---|
| Length/m | 1.5 |
| Width/m | 1.5 |
| Height/m | 1.75 |
| Free-field cut-off frequency/Hz | 100 |
| Free sound field radius/m | 2.3 |
| Background noise of test room/dB(A) | ≤ 25 |
| Indoor noise of test room/dB(A) | ≤ 35 |
Before the test, the reliability of the NVH bench was verified by comparing the NVH road test curves and the NVH bench test curves of three gear pairs from the same batch. The peak noise values and the speeds at which peak noise occurs matched well, confirming the reliability of the bench test.
4.4 Investigation of the Transmission Error Range for Good Main Reducer NVH
Thirty gear pairs with varying transmission error values were selected and assembled into main reducers for NVH bench testing. The transmission error values of the drive side ranged approximately from 5 to 27 μrad, and those of the coast side ranged approximately from 3 to 17 μrad. The peak noise values of the main reducer under simulation of the fifth-gear acceleration and coast-down conditions were extracted. The data were fitted using the P-spline smoothing curve in MATLAB. The fitting curves reveal the following:
For the drive side, when the transmission error is relatively large, the peak noise under fifth-gear acceleration decreases as the transmission error decreases. However, when the transmission error is extremely small, the NVH performance of the main reducer also deteriorates. Therefore, the transmission error is not the smaller the better. From the fitting curve, when the drive-side transmission error is in the range of 8-12 μrad, the peak noise under fifth-gear acceleration is below 60 dB(A). This range is considered the optimal level range for the drive-side transmission error.
For the coast side, a similar trend is observed. When the coast-side transmission error is in the range of 4-8 μrad, the peak noise under fifth-gear coast-down is below 65 dB(A). This range is considered the optimal level range for the coast-side transmission error.
Part of the test data is listed in Table 4-4 below.
| Gear No. | Drive Side / 5th Gear Acceleration | Coast Side / 5th Gear Coast-down | ||
|---|---|---|---|---|
| Transmission Error/μrad | Peak Noise/dB(A) | Transmission Error/μrad | Peak Noise/dB(A) | |
| 2 | 10.67 | 59.30 | 7.67 | 63.09 |
| 11 | 11.67 | 56.80 | 3.87 | 65.89 |
| 13 | 26.63 | 70.54 | 5.56 | 63.88 |
| 14 | 9.17 | 56.73 | 12.64 | 68.44 |
| 16 | 12.44 | 59.16 | 4.88 | 64.78 |
| 18 | 6.58 | 65.45 | 8.34 | 65.08 |
| 20 | 5.31 | 63.28 | 7.88 | 63.18 |
| 23 | 8.34 | 58.61 | 13.67 | 67.46 |
| 25 | 11.05 | 58.18 | 4.25 | 62.77 |
| 30 | 7.87 | 60.18 | 12.05 | 68.55 |
Chapter 5 Correction of Transmission Error Based on Gear Lapping Parameter Optimization
5.1 Gear Lapping Mechanism
Gear lapping of hypoid gears aims to improve the roughness of the tooth surface and enhance the tooth profile accuracy, thereby reducing the transmission error of the gear pair. During gear meshing, the lapping machine applies a braking torque to the driven gear, generating torque. Simultaneously, the nozzle injects the lapping fluid into the meshing area of the gear pair through a hydraulic pump. The abrasive particles in the lapping fluid are squeezed, rolled, and slid to produce cutting force, removing trace amounts of metal from the tooth surfaces. This process is also called dynamic mutual lapping of the gear pair.
The force analysis of the lapping model can be simplified. In the lapping model shown in Figure 5-2, the gear teeth are subjected to several forces simultaneously, including the normal force $F_1$ perpendicular to the tooth surface and the tangential stress $F_t$ in the direction of relative motion. The resultant force of these two forces is the normal meshing force $F$. The torque $T$ applied by the machine tool spindle is simulated by the normal meshing force $F$.
The formulas for calculating the normal meshing force $F$ and its components $F_1$ and $F_t$ are:
$$F = T / R \tag{5-1}$$
$$F_1 = F \cos\beta \tag{5-2}$$
$$F_t = F \sin\beta \tag{5-3}$$
According to the relationship between the normal pressure angle $\alpha$ and the helix angle $\beta$, the cutting force $F_1$ can be further decomposed into the component cutting force $F_n$ and $F_r$:
$$F_n = F_1 \cos\alpha = F \cos\beta \cos\alpha \tag{5-4}$$
$$F_r = F_1 \sin\alpha = F \cos\beta \sin\alpha \tag{5-5}$$
Based on the lapping cutting theory, the cutting depth $a_p$ is related to the lapping quality, and its calculation formula is:
$$a_p = \sqrt{\frac{F_{n0} \tan^2 \varepsilon}{\pi \sigma_s \tan^2 \delta_s / 2}} \tag{5-6}$$
where $F_{n0}$ is the average normal pressure formed by each abrasive particle squeezing each other in the lapping fluid (N); $\varepsilon$ is the cone half-apex angle of the cutting part of the abrasive particle (°); and $\sigma_s$ is the yield strength of the gear pair material (MPa).
5.2 Research on Influencing Factors of Gear Lapping Parameters
The tooth side clearance is an important parameter in the meshing of hypoid gear pairs. The transmission stability and working life of the gear pair are closely related to the tooth side clearance. The gear pair tends to generate vibration and noise when the tooth side clearance is too large. However, if the tooth side clearance is too small, many running-in problems may occur, leading to accelerated wear or even tooth breakage. In this research, the Gleason 600HTL lapping machine was used to adjust the tooth side clearance during lapping.
During lapping, the driving gear is driven by the machine tool spindle to rotate, and the driven gear is driven through meshing with the driving gear. The spindle speed is the same as the driving gear rotation speed. A higher spindle speed results in a faster meshing speed, and the abrasive particles move faster, increasing the cutting speed, reducing the single cutting amount, decreasing the tooth surface roughness, and improving manufacturing accuracy. However, an excessively high speed may lead to over-lapping and tooth surface damage. Therefore, an appropriate spindle speed must be chosen.
The lapping cycle count determines the number of times the abrasive particles cut the tooth surface. Too few cycles lead to insufficient lapping and excessive transmission error, while too many cycles can cause over-lapping and tooth surface wear. Therefore, an appropriate lapping cycle count is necessary.
5.3 Gear Lapping Parameter Optimization Experiment
To determine the influences of the three lapping parameters (tooth side clearance, spindle speed, and lapping cycle count) on the transmission error of hypoid gears, a three-level three-factor orthogonal experiment was designed. The factor levels are listed in Table 5-1.
| Level | A: Tooth Side Clearance/mm | B: Spindle Speed/rpm | C: Lapping Cycle Count/times |
|---|---|---|---|
| 1 | 0.05 | 1200 | 2 |
| 2 | 0.06 | 1800 | 5 |
| 3 | 0.07 | 2400 | 8 |
The orthogonal test combinations are shown in Table 5-2, and the test results are summarized in Table 5-3.
| Test No. | Level Combination | Tooth Side Clearance/mm | Spindle Speed/rpm | Lapping Cycle Count/times |
|---|---|---|---|---|
| 1 | A1B1C1 | 0.05 | 1200 | 2 |
| 2 | A1B2C2 | 0.05 | 1800 | 5 |
| 3 | A1B3C3 | 0.05 | 2400 | 8 |
| 4 | A2B1C2 | 0.06 | 1200 | 5 |
| 5 | A2B2C3 | 0.06 | 1800 | 8 |
| 6 | A2B3C1 | 0.06 | 2400 | 2 |
| 7 | A3B1C3 | 0.07 | 1200 | 8 |
| 8 | A3B2C1 | 0.07 | 1800 | 2 |
| 9 | A3B3C2 | 0.07 | 2400 | 5 |
| Test No. | Tooth Side Clearance/mm | Spindle Speed/rpm | Lapping Cycle Count | Drive Side Transmission Error/μrad | Coast Side Transmission Error/μrad |
|---|---|---|---|---|---|
| 1 | 0.05 | 1200 | 2 | 17 | 14 |
| 2 | 0.05 | 1800 | 5 | 16 | 12 |
| 3 | 0.05 | 2400 | 8 | 15 | 8 |
| 4 | 0.06 | 1200 | 5 | 15 | 16 |
| 5 | 0.06 | 1800 | 8 | 10 | 7 |
| 6 | 0.06 | 2400 | 2 | 18 | 13 |
| 7 | 0.07 | 1200 | 8 | 15 | 14 |
| 8 | 0.07 | 1800 | 2 | 10 | 5 |
| 9 | 0.07 | 2400 | 5 | 21 | 11 |
Range analysis was conducted on the orthogonal test data. For the drive-side transmission error as an example, the $K_i$ values for factor A (tooth side clearance) are calculated as:
$$K_1 = 17 + 16 + 15 = 48, \quad K_2 = 15 + 10 + 18 = 43, \quad K_3 = 15 + 10 + 21 = 46 \tag{5-7}$$
For factor B (spindle speed):
$$K_1 = 17 + 15 + 15 = 47, \quad K_2 = 16 + 10 + 10 = 36, \quad K_3 = 15 + 18 + 21 = 54 \tag{5-8}$$
For factor C (lapping cycle count):
$$K_1 = 17 + 18 + 10 = 45, \quad K_2 = 16 + 15 + 21 = 52, \quad K_3 = 15 + 10 + 15 = 40 \tag{5-9}$$
The range value formula is:
$$R = \max(\bar{K}_1, \bar{K}_2, \bar{K}_3) – \min(\bar{K}_1, \bar{K}_2, \bar{K}_3) \tag{5-10}$$
For factor A, the range value is:
$$R_A = \max(16.00, 14.33, 15.33) – \min(16.00, 14.33, 15.33) = 1.67 \tag{5-11}$$
For factor B, the range value is:
$$R_B = \max(15.67, 12.00, 18.00) – \min(15.67, 12.00, 18.00) = 6.00 \tag{5-12}$$
For factor C, the range value is:
$$R_C = \max(15.00, 17.33, 13.33) – \min(15.00, 17.33, 13.33) = 4.00 \tag{5-13}$$
The range analysis results are summarized in Table 5-4.
| Calculation Item | Factor | Factor Order | Preferred Scheme | |||
|---|---|---|---|---|---|---|
| A | B | C | ||||
| Drive Side Transmission Error/μrad | K1 | 48 | 47 | 45 | BCA | B2C3A2 |
| K2 | 43 | 36 | 52 | |||
| K3 | 46 | 54 | 40 | |||
| R | 1.67 | 6 | 4 | |||
| Coast Side Transmission Error/μrad | K1 | 34 | 39 | 32 | BCA | B2C3A3 |
| K2 | 35 | 24 | 39 | |||
| K3 | 31 | 37 | 29 | |||
| R | 1.33 | 5 | 3.33 |
The range analysis results show that for both the drive side and coast side transmission errors, the influence order of the factors is B (spindle speed) > C (lapping cycle count) > A (tooth side clearance). The comprehensive analysis suggests that the optimal lapping parameters are tooth side clearance of 0.06 mm, spindle speed of 1800 rpm, and lapping cycle count of 5 times.
5.4 Spindle Speed Optimization Experiment
Since the spindle speed has the greatest influence on the transmission error, further optimization experiments were conducted by fixing the tooth side clearance at 0.06 mm and the lapping cycle count at 5, and varying the spindle speed from 1500 rpm to 2400 rpm in 100 rpm increments, totaling 10 groups with 5 gear pairs in each group. The results are shown in Table 5-6.
| Group (Speed/rpm) | Transmission Errors of 5 Gear Pairs/μrad (Drive Side) | Transmission Errors of 5 Gear Pairs/μrad (Coast Side) | Average Drive Side/μrad | Average Coast Side/μrad |
|---|---|---|---|---|
| 1 (1500) | 18, 22, 26, 10, 19 | 15, 12, 13, 14, 18 | 19 | 14.4 |
| 2 (1600) | 23, 19, 17, 18, 12 | 14, 12, 13, 11, 12 | 17.8 | 12.4 |
| 3 (1700) | 18, 21, 17, 13, 16 | 12, 9, 14, 13, 11 | 17 | 11.8 |
| 4 (1800) | 15, 17, 19, 10, 16 | 11, 10, 12, 9, 8 | 15.4 | 10 |
| 5 (1900) | 14, 13, 10, 11, 15 | 9, 8, 12, 11, 7 | 12.6 | 9.4 |
| 6 (2000) | 12, 11, 8, 8, 9 | 7, 4, 8, 5, 7 | 9.6 | 8.2 |
| 7 (2100) | 13, 12, 9, 14, 11 | 8, 9, 5, 8, 11 | 11.8 | 9 |
| 8 (2200) | 15, 17, 12, 16, 13 | 7, 9, 11, 12, 6 | 14.6 | 9 |
| 9 (2300) | 17, 10, 15, 17, 16 | 11, 10, 7, 14, 12 | 15 | 10.8 |
| 10 (2400) | 19, 21, 16, 15, 17 | 12, 11, 13, 9, 10 | 17.6 | 11 |
When the spindle speed is 2000 rpm, the drive-side transmission errors of all 5 gear pairs are within 8-12 μrad, and the coast-side transmission errors are within 4-8 μrad. The average transmission error values are closest to the midpoint values of the optimal ranges (10 μrad and 6 μrad, respectively). Therefore, the optimal lapping parameters are finalized as: tooth side clearance of 0.06 mm, spindle speed of 2000 rpm, and lapping cycle count of 5 times.
5.5 Vehicle Verification of NVH Performance after Transmission Error Optimization
Using the optimized lapping parameters, gear pairs from a tooling cycle were lapped and five gear pairs were randomly selected for assembly into main reducers for vehicle road NVH verification. The results are shown in Table 5-7.
| No. | Part No. | Drive Side Transmission Error/μrad | 5th Gear Acceleration/dB(A) | Coast Side Transmission Error/μrad | 5th Gear Coast-down/dB(A) |
|---|---|---|---|---|---|
| 1 | JB150290 | 10 | 59.63 | 5 | 63.03 |
| 2 | JB160194 | 12 | 60.20 | 6 | 66.30 |
| 3 | JB150355 | 11 | 61.38 | 6 | 64.75 |
| 4 | JB160164 | 9 | 62.31 | 8 | 65.53 |
| 5 | JB150296 | 10 | 60.01 | 7 | 63.43 |
The results show that the peak noise values of all five gear pairs are approximately 60 dB(A) under fifth-gear acceleration and below 65 dB(A) under fifth-gear coast-down conditions, considering a test error of 2-3 dB(A). This confirms that the optimized lapping parameters can effectively control the transmission error within the desired range for hypoid gears and the NVH performance of the main reducer is good.
Chapter 6 Conclusions and Outlook
6.1 Conclusions
This paper systematically investigated the influence of the transmission error of hypoid gears on the NVH performance of the main reducer, addressing the problem of excessive and inconsistent transmission error values after lapping in batch production. The main conclusions are as follows:
(1) A vibration model of the hypoid gear pair meshing system was established, and the transmission error curve and noise generation mechanism were analyzed. Using the Gleason 350GMM measuring equipment, the tooth profile errors before and after lapping were recorded, together with the transmission error values from the Gleason 600HTT rolling tester. The pitch error was found to have the largest influence on the transmission error among gear machining errors.
(2) Vehicle road tests were conducted under controlled contact pattern consistency and housing parameter consistency. The results show that the transmission error of hypoid gears is not the smaller the better, and there is a range-valued correspondence between the transmission error and the NVH performance of the main reducer.
(3) Using the rear axle NVH test bench combined with order tracking analysis, extensive NVH bench tests were conducted. The fitting analysis of the data revealed that when the drive-side transmission error is 8-12 μrad and the coast-side transmission error is 4-8 μrad, the peak noise under fifth-gear acceleration is below 60 dB(A) and below 65 dB(A) under fifth-gear coast-down, indicating good NVH performance.
(4) The gear lapping parameters were optimized through a three-level three-factor orthogonal experiment and further spindle speed gradient tests. The optimal lapping parameters were determined as: tooth side clearance of 0.06 mm, spindle speed of 2000 rpm, and lapping cycle count of 5 times. The optimized parameters can effectively control the transmission error of hypoid gears within the desired range, and vehicle verification tests confirmed the good NVH performance of the main reducer.
6.2 Outlook
Due to time and condition limitations, further research is needed in the following areas:
(1) The relationship between the transmission error of hypoid gears and the NVH performance of the main reducer was only found to be a range-valued correspondence. The specific mathematical relationship between the two requires further investigation with improved research methods.
(2) Only three lapping parameters (tooth side clearance, spindle speed, and lapping cycle count) were investigated in the orthogonal experiment. Other process parameters such as lapping path and loading torque require further optimization studies in the future.