
In the field of automotive powertrain engineering, the drive axle serves as a critical component that directly influences vehicle performance, comfort, and durability. My research focuses on the systematic design, optimization, and fault diagnosis of hypoid gears used in the drive axle of a CN100R mini vehicle. The primary objective is to reduce vibration and noise while enhancing the load-carrying capacity and service life of the gear pair. This work integrates theoretical analysis, computer-aided engineering, and experimental validation to establish a comprehensive design methodology for hypoid gears.
1. Introduction and Research Background
With the rapid development of China’s economy and the continuous improvement of people’s living standards, the automotive industry has entered an era of rapid growth. According to statistics released by the China Association of Automobile Manufacturers, China’s vehicle production and sales reached 22.11 million units in 2013, making it the world’s largest automotive market. Among these, vehicles with engine displacements of 1.6L or below accounted for 54.21% of total sales, representing the most significant segment of the industry. Mini vehicles, characterized by their affordability, ease of maintenance, versatility, and fuel efficiency, have gained increasing popularity, particularly in urban-rural fringe areas where driving conditions are demanding.
The drive axle is one of the main sources of noise and vibration in an automobile, and the hypoid gears within the final drive assembly are considered the primary contributors to these undesirable phenomena. When the gear pair is improperly designed, excessive meshing forces are generated during operation, leading to severe vibration and noise that directly compromise ride comfort and acoustic quality. Furthermore, hypoid gears are responsible for a significant proportion of drive axle failures, including tooth breakage, pitting, wear, and premature bearing damage. Therefore, the design and optimization of hypoid gears are of paramount importance for improving overall vehicle quality and reliability.
My work is motivated by a real engineering need. The company I collaborate with is a leading manufacturer of mini-vehicle rear drive axles in Asia, and this project addresses a specific requirement from an overseas market. The objective is to design hypoid gears that meet strict performance criteria while maintaining manufacturing feasibility and cost-effectiveness. The research encompasses gear geometry design, material selection, stress analysis, system-level simulation, and fault diagnostics, providing a complete solution for practical engineering applications involving hypoid gears.
2. Drive Axle Structure and Hypoid Gears
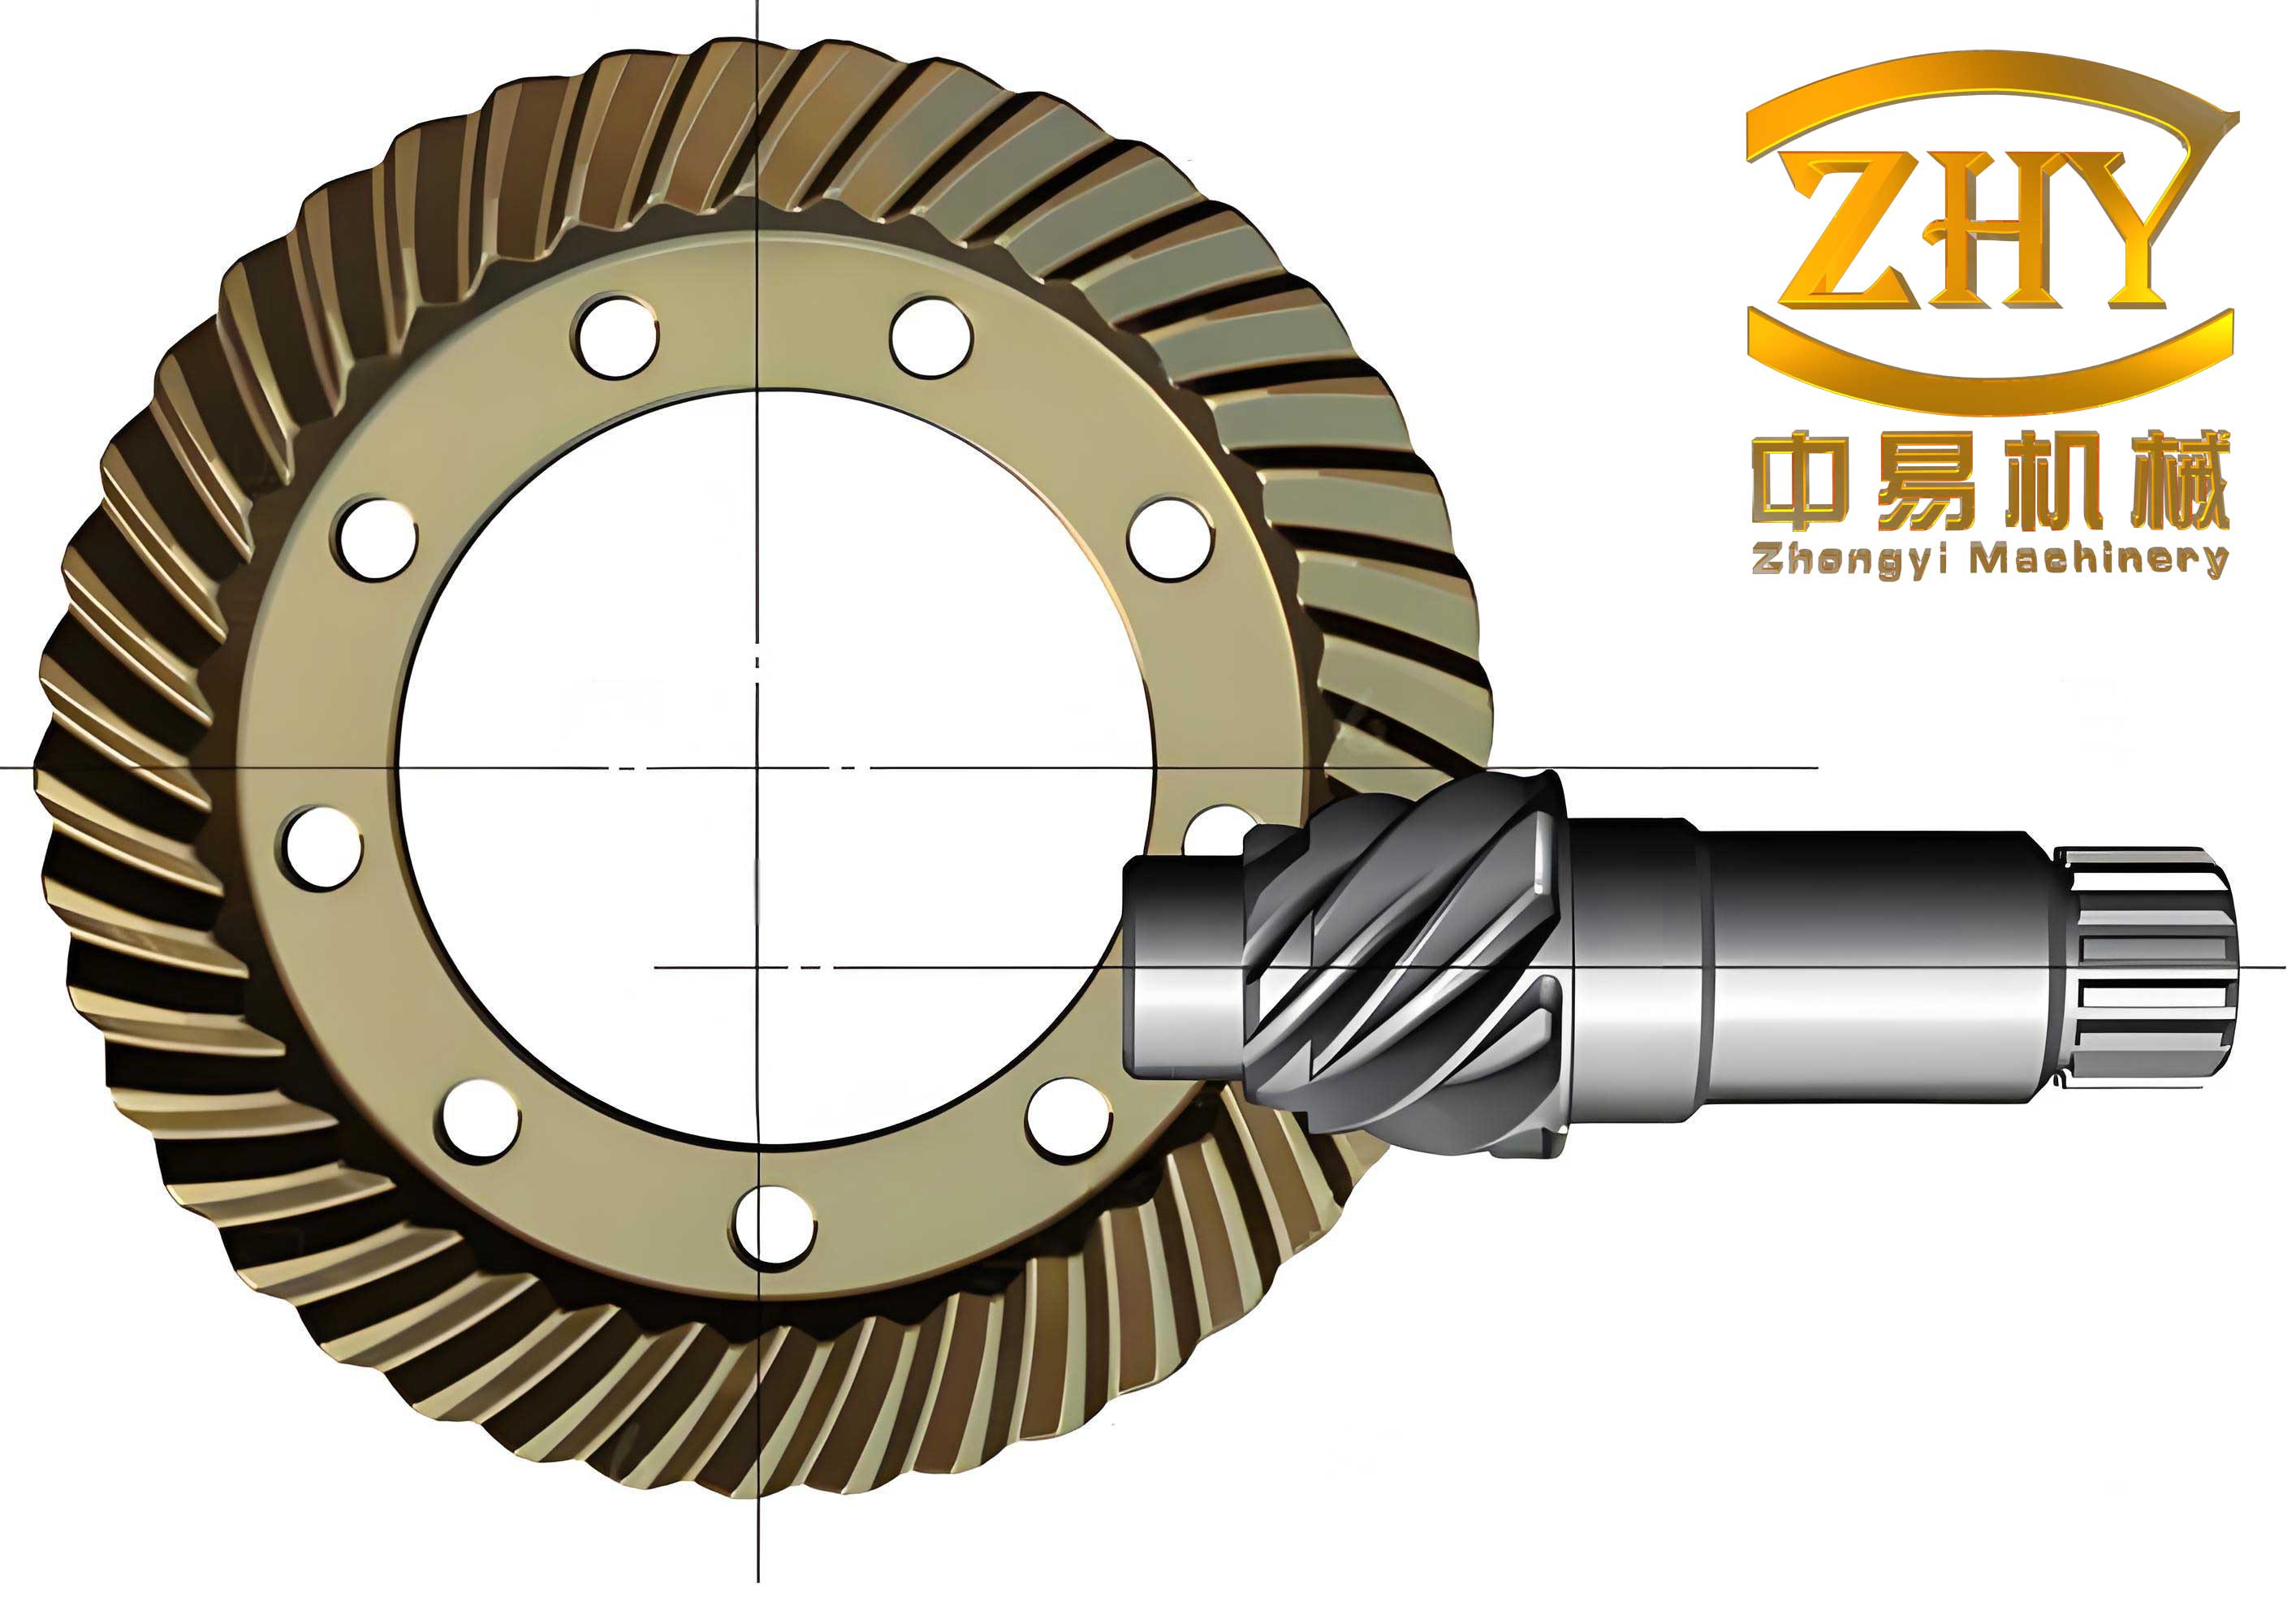
The automotive drive axle serves as the final stage of the powertrain system, transmitting torque from the transmission to the driving wheels while enabling differential action. In my design, I consider the drive axle as an integral system comprising the final drive, differential mechanism, axle shafts, and housing. The final drive, which houses the hypoid gears, plays a crucial role in torque amplification and speed reduction. A typical single-stage reduction final drive is preferred for mini vehicles due to its compact structure, high efficiency, and simple construction.
Hypoid gears are widely adopted in automotive final drives because of their unique geometrical and operational advantages. Unlike conventional bevel gears that have intersecting axes, hypoid gears have axes that are offset from each other. This offset, known as the pinion offset distance, enables several remarkable benefits:
- Compact packaging: The offset allows for more flexible vehicle chassis design. A downward offset lowers the vehicle’s center of gravity, enhancing stability; an upward offset improves ground clearance for better off-road capability.
- Enhanced strength and stiffness: The offset distance increases the pinion spiral angle, which in turn increases the pinion’s equivalent diameter and provides greater rigidity. This arrangement permits straddle-type mounting, improving load distribution and overall gear strength.
- Improved meshing smoothness: The larger spiral angle increases the contact ratio, resulting in gradual, continuous engagement that reduces noise and vibration levels.
- Longer gear life: The combination of sliding along both tooth length and height directions facilitates gear running-in and enables adjustments of the contact pattern with greater precision.
However, hypoid gears also present certain drawbacks. The relative sliding between tooth surfaces causes increased friction and heat generation, requiring special hypoid gear lubricants to prevent scuffing and premature wear. Additionally, their complex geometry demands higher manufacturing precision and makes assembly more sensitive to positional tolerances. In my design, I address these challenges through careful parameter optimization and advanced simulation techniques.
3. Design Theory of Hypoid Gears
The theoretical foundation of hypoid gear design is built upon the principles of spatial meshing theory. In practical manufacturing, hypoid gear pairs are often designed as quasi-conjugate gears rather than perfectly conjugate gears. This approach compensates for unavoidable manufacturing and assembly errors while maintaining smooth transmission characteristics. The design methodology can be described by the following mathematical framework.
The position vector of a point on the cutting tool surface of the pinion and gear can be expressed using parametric equations. For the pinion tool surface, the position vector is described by:
$$ r_I(S_I, \theta_I) = \begin{bmatrix} (r_I – S_I \sin\alpha_I)\cos\theta_I \\ (r_I – S_I \sin\alpha_I)\sin\theta_I \\ S_I \cos\alpha_I \\ 1 \end{bmatrix} $$
where $r_I$ is the cutter radius, $\alpha_I$ is the tool pressure angle, $S_I$ is the coordinate along the tool edge, and $\theta_I$ is the angular parameter. The corresponding unit normal vector is:
$$ n_I(\theta_I) = \begin{bmatrix} -\cos\alpha_I \cos\theta_I \\ -\cos\alpha_I \sin\theta_I \\ \sin\alpha_I \end{bmatrix} $$
Similarly, for the gear tool surface, we have analogous expressions. The transformation from the tool coordinate system to the gear blank coordinate system involves a series of rotation and translation matrices. The final tooth surface equations are obtained through matrix transformations as:
$$ r_{M}(S_I, \theta_I, \phi_I) = [P_{M-I}(\phi_M)] r_I(S_I, \theta_I) $$
$$ n_{M}(\theta_I, \phi_I) = [Q_{M-I}(\phi_M)] n_I(\theta_I) $$
where $\phi_M$ and $\phi_S$ represent the rotation angles of the pinion and gear during the cutting process, and $[P]$ and $[Q]$ are coordinate transformation matrices.
The meshing condition of hypoid gear pairs is derived from the relative velocity and the common normal vector at the contact point. This relationship is expressed as:
$$ r_{Mh}(\theta_I, \phi_I, \varphi_M) = r_{Sh}(\theta_{II}, \phi_{II}, \varphi_S) $$
$$ n_{Mh}(\theta_I, \phi_I) = n_{Sh}(\theta_{II}, \phi_{II}) $$
The instantaneous transmission ratio of the gear pair is defined as:
$$ i = \frac{d\varphi_S}{d\varphi_M} $$
In my design, I adopt a symmetric transmission error function with respect to the center of the contact pattern. This approach, as opposed to a constant ratio within the contact zone, helps to minimize the impact of sudden ratio changes at the boundaries of engagement, thereby reducing vibration excitation.
4. Design Requirements and Input Parameters
I initiated the design process by establishing the complete set of technical requirements for the final drive assembly targeting the CN100R mini vehicle. This vehicle is a right-hand-drive variant of a popular commercial platform, intended for export to the Indian market. The operating conditions include mixed urban and rural driving, with particularly challenging road conditions and heavy traffic loads.
The key input parameters for the drive axle design are summarized in Table 1.
| Parameter | Symbol | Value |
|---|---|---|
| Engine maximum torque | Temax | 131 N·m |
| 1st gear ratio | ig1 | 3.857 |
| 2nd gear ratio | ig2 | 2.176 |
| 3rd gear ratio | ig3 | 1.419 |
| 4th gear ratio | ig4 | 1.000 |
| 5th gear ratio | ig5 | 0.808 |
| Reverse gear ratio | igR | 4.128 |
| Final drive ratio | i0 | 4.889 |
| Rear track width | – | 1440 mm |
| Wheelbase | – | 2720 mm |
| Axle loading (front/rear) | G1/G2 | 700/1200 kg |
| Wheel rolling radius | r | 289 mm |
| Vehicle center of gravity height (loaded) | hg | 700 mm |
From these parameters, I derived the critical design loads for the gear pair. The maximum torque transmitted by the pinion in first gear is:
$$ T_{je} = T_{emax} \cdot i_{g1} \cdot \eta = 131 \times 3.857 \times 0.9 = 454.6 \text{ N·m} $$
Additionally, the maximum torque limited by wheel traction is computed using the tire-road friction coefficient and the rear axle loading:
$$ T_{j\varphi} = G_2 \cdot \varphi \cdot r \cdot i_{LB} \cdot \eta_{LB} = 1200 \times 9.8 \times 0.85 \times 0.289 = 2888.8 \text{ N·m} $$
Since the traction-limited value exceeds the engine-limited torque, the design is governed by the latter, and the pinion must safely transmit at least 454.6 N·m in the first gear, and 505.3 N·m when considering a practical overload factor of 1.1.
5. Gear Parameter Design and Material Selection
5.1 Material Selection
For hypoid gears operating under high loads and variable conditions, the choice of material is critical. The selected steel grade must satisfy several requirements: high surface hardness to resist wear and contact fatigue (58-62 HRC), sufficient core toughness to withstand impact loads, and appropriate hardenability for consistent heat treatment results. In my design, I considered the following commonly used carburizing steels:
- 20CrMnTi
- 20CrNiMo
- 20MnTiB
After a thorough evaluation of material availability, heat treatment response, and cost considerations, I chose 20CrMnTi as the primary material for both gears. This material is widely used in the Chinese automotive industry and has a proven track record in hypoid gear applications. The heat treatment process consists of carburizing followed by quenching and tempering, after which the surface hardness is controlled at 58-62 HRC and core hardness at 30-40 HRC. The carburized layer depth is specified between 1.0 and 1.4 mm, in accordance with the module size of the gears.
5.2 Basic Geometric Parameters
The fundamental geometric parameters were determined using the Gleason Spiral Bevel/Hypoid Gear Design software, which implements the Gleason design methodologies. I determined the initial values through analytical formulas and then refined them iteratively through software-based optimization.
Gear pitch diameter: The initial estimate of the ring gear pitch diameter is obtained from the AGMA empirical formula:
$$ d_2 = K_d \sqrt[3]{T_j} $$
where $K_d$ is the diameter coefficient (13-16 for automotive applications) and $T_j$ is the maximum torque. Substituting values yields an initial range of approximately 170 to 210 mm. Considering the existing drive axle platform and housing constraints, I selected a ring gear pitch diameter of approximately 178 mm.
Gear tooth width: The face width of the ring gear is empirically determined as:
$$ F = 0.155 \times d_2 = 0.155 \times 200 = 31 \text{ mm} $$
Pinion offset distance: For light vehicles, the offset distance should not exceed 20% of the cone distance. I initially considered 30 mm but later reduced it to 25 mm during the optimization process to improve gear life balance and reduce sliding velocities.
Pinion spiral angle: The Gleason formula for the pinpoint angle is:
$$ \psi_p = 25 + 5\sqrt{\frac{N}{n}} + 90\frac{E}{D} $$
where $N$ = number of ring gear teeth (44), $n$ = number of pinion teeth (9), $E$ = offset distance, and $D$ = ring gear diameter. Substituting the initial values gives approximately 51.2 degrees. However, considering manufacturing constraints and heat treatment deformation, I adjusted this to 49-50 degrees.
Hand of spiral: For the mounting arrangement with the pinion below the centerline of the ring gear, the pinion spiral is left-hand, and the ring gear is right-hand.
Pressure angle: I selected a comprehensive pressure angle of 38 degrees as recommended for passenger car applications, balancing bending strength and contact strength requirements.
The final design parameters after the initial Gleason calculation are summarized in Table 2.
| Parameter | Initial Value | Optimized Value |
|---|---|---|
| Number of pinion teeth | 9 | 9 |
| Number of ring gear teeth | 44 | 44 |
| Ring gear pitch diameter (mm) | 200 | 200 |
| Face width (mm) | 31 | 28 |
| Offset distance (mm) | 30 | 25 |
| Pinion spiral angle (degrees) | 51.2 | 49.25 |
| Total pressure angle (degrees) | 38 | 38 |
| Hand of spiral | Left | Left |
5.3 Calculation of Working Parameters
The working parameters of the gear pair were calculated iteratively. I utilized several sub-modules within the Gleason software. The CAGE (Computer Aided Gear Engineering) module allowed me to perform full gear geometry calculations, including tooth proportions and blank dimensions. The appropriate sub-module calculated the following key values for the optimized design:
- Gear ratio: 4.889
- Working depth: The sum of the addendum and dedendum, determined from the selected depth factor.
- Outer cone distance: 129.6 mm
- Mean cone distance: 112.4 mm
- Tooth thickness: Verified to ensure adequate bending strength
Strength verification: Using the AGMA rating equations, I verified both the bending and contact stresses of the gears at the maximum input torque. The stress calculations are as follows:
The bending stress at the root fillet is:
$$ \sigma_b = \frac{W_t K_a K_v K_m}{F m J} $$
where $W_t$ is the tangential load, $K_a$ is the application factor, $K_v$ is the dynamic factor, $K_m$ is the load distribution factor, $F$ is the face width, $m$ is the module, and $J$ is the bending strength geometry factor. For the optimized design, the calculated bending stress for the pinion is:
$$ \sigma_{b,pinion} = 457.3 \text{ MPa} $$
The contact stress on tooth surfaces is calculated from the Hertzian contact equations:
$$ \sigma_H = Z_E \sqrt{\frac{W_t K_a K_v K_m C_f}{F d_1 I}} $$
where $Z_E$ is the elastic coefficient, $C_f$ is the surface condition factor, $d_1$ is the pinion pitch diameter, and $I$ is the surface strength geometry factor. The calculated contact stress is:
$$ \sigma_H = 2502 \text{ MPa} $$
Both values meet the recommended limits according to the AGMA standards used by the Gleason software: bending below 690 MPa and contact below 2800 MPa. These calculations confirmed that the gear set has adequate load-carrying capacity for the CN100R application.
6. System-Level Modeling and Simulation
6.1 Gear System Model Development
To further validate and optimize the gear design, I built a complete driveline model in MASTA (Manufacturing And System Transmission Analysis) software, developed by SMT. This powerful tool enables system-level simulation that includes not only the gears but also shafts, bearings, and housings, providing a more realistic representation of the drive axle dynamics.
In the MASTA environment, I constructed the entire final drive assembly model, including the pinion and ring gear, the shaft elements, bearings, and the differential assembly. This model takes into account the structural flexibility of all components, which is essential for accurately predicting gear contact behavior under load. The key simulation outputs include gear tooth load distribution, transmission error, bearing loads, and system modal frequencies.
6.2 Load Spectrum Analysis
For a real vehicle application, the gear set is subjected to variable loads rather than a single maximum torque value. I therefore conducted the analysis using two load spectra:
Road load spectrum (30,000 km): This spectrum represents typical mixed urban and rural driving conditions, with the load distribution over the mission profile.
Bench test spectrum (500,000 cycles): Accelerated endurance testing at a constant input torque of 400 N·m and input speed of 500 rpm for 16.67 hours.
The road load spectrum used is summarized in Table 3.
| Gear | Input Torque (N·m) | Input Speed (rpm) | Duration (hours) |
|---|---|---|---|
| 1st | 259.96 | 1637.88 | 40.60 |
| 2nd | 132.77 | 2960.17 | 67.40 |
| 3rd | 72.71 | 4504.50 | 59.05 |
| 4th | 59.55 | 5500.00 | 60.46 |
| 5th | 67.20 | 6823.82 | 68.22 |
6.3 Misalignment Analysis
One of the key outputs of the MASTA analysis is the system misalignment, which represents the deviation of actual gear positions under load relative to their theoretical positions. The misalignment values directly impact the contact pattern and potentially cause edge loading and premature failure.
The misalignment calculations yielded the following critical values:
| Parameter | Value |
|---|---|
| Angular misalignment ΔΣ (mrad) | 0.001 |
| Offset error ΔE (μm) | 292.81 |
| Pinion axial error ΔXP (μm) | -266.69 |
| Gear axial error ΔXW (μm) | 384.41 |
These misalignment values were fed back into the Gleason Tooth Contact Analysis (TCA) module to predict the actual contact pattern under operating loads. The resulting contact pattern remains within acceptable limits, demonstrating that the gear design is robust to realistic system deflections.
6.4 NVH Analysis
Vibration and noise performance are critical metrics for the drive axle. The MASTA software provides specialized modules for Noise, Vibration, and Harshness (NVH) analysis. My approach involved using the Transmission Error (TE) as the primary excitation source. The TE is the deviation from ideal constant velocity ratio during gear meshing, and it is widely regarded as the main excitation for gear whine noise.
I performed the following steps for NVH analysis:
- Computation of TE under load from the loaded tooth contact analysis.
- Fast Fourier Transform of the TE curve to obtain its frequency composition.
- Excitation of the coupled structural-acoustic model of the axle housing using TE force.
- Calculation of the dynamic response at key measurement points on the axle housing surface.
The waterfall diagram of the housing response showed that the first-order of the TE dominates the vibration response, with the most significant resonant peaks occurring around 1.1 kHz. To mitigate this issue, MASTA suggested three approaches:
- Modification of system modes through structural changes such as placing additional ribs in the housing.
- Increasing support stiffness by optimizing bearing arrangement and housing wall thickness.
- Through gear micro-geometry modification to reshape the TE curve and reduce excitation magnitude.
7. Design Optimization and Validation
Based on the simulation findings, I identified several areas for design improvement. The original design had two weaknesses: an unequal fatigue life between the pinion and gear, and an excessive face width to cone distance ratio of 0.4 (above the recommended 0.3). These issues were resolved by implementing the following modifications:
- Face width reduced from 31 mm to 28 mm.
- Offset distance reduced from 30 mm to 25 mm.
- Pinion spiral angle adjusted to 49°15′.
These changes achieved a balanced fatigue life between the two gears, while the face width ratio improved to 0.31. The strength performance of the optimized design, while marginally lower than the initial design, still exceeds the AGMA recommended limits, validating the new configuration.
6.1 Performance Comparison
I compared the performance of the two designs in terms of key indices, as presented in Table 5.
| Property | Initial Design | Optimized Design |
|---|---|---|
| Bending stress (MPa) | 457.3 | 475.8 |
| Contact stress (MPa) | 2502 | 2550 |
| Face width / cone distance | 0.4 | 0.31 |
| Fatigue life balance | Poor | Balanced |
| High-speed stability | Fair | Good |
8. Fault Detection System for Hypoid Gears
Even with a high-quality design, gear faults can still occur during production and operation. Therefore, I developed a comprehensive hipoid gear fault detection system to validate the manufacturing quality of the designed gears. The system uses vibration signal analysis to diagnose various fault modes, such as pitting, spalling, tooth cracking, and excessive wear.
8.1 System Architecture and Signal Processing Methods
The detection system is developed using the LabVIEW graphical programming environment. This platform offers powerful data acquisition and analysis capabilities and simplifies the integration of hardware and software components. The system architecture is presented in Figure 5. The analysis methodology can be classified into three main categories: time-domain methods, frequency-domain methods, and modern time-frequency analysis methods.
8.2 Time-Domain Features
In the time-domain, I extract several characteristic parameters to identify the gear state. The effective value of the signal characterizes the vibration energy and is defined as:
$$ X_{rms} = \sqrt{\frac{1}{N}\sum_{i=0}^{N-1} x_i^2} $$
The kurtosis is a dimensionless parameter that quantifies the degree of peakedness in the vibration signal. It is particularly sensitive to impulsive events caused by localized defects, such as fatigue cracks on the tooth surface. It is computed as:
$$ K_v = \frac{\frac{1}{N}\sum_{i=0}^{N-1}(x_i – \bar{x})^4}{\sigma^4} $$
The crest factor, which is the ratio of peak value to RMS value, is used to monitor fault development:
$$ C = \frac{X_{peak}}{X_{rms}} $$
During my test of the manufactured hypoid gears on the test bench, the measured time-domain parameters were:
| Feature | Value |
|---|---|
| RMS (m/s²) | 30.29 |
| Peak value | 131.97 |
| Kurtosis | 3.3 |
| Crest factor | 4.33 |
These values indicate a healthy gear pair with no significant impulsive events. A kurtosis value close to 3 suggests a near-Gaussian vibration distribution, which is expected for a properly designed and assembled gear set.
8.3 Frequency-Domain Analysis
Frequency analysis is performed using the Fast Fourier Transform. The power spectrum of the vibration signal was plotted. The result reveals distinct peaks at the gear mesh frequency and its harmonics. The mesh frequency is calculated as:
$$ f_m = f_{pinion} \times z_{pinion} = \frac{n_{pinion}}{60} \times 9 $$
where $f_{pinion}$ is the pinion rotational frequency in Hz. In the tested gear pair, the mesh frequency appeared as a dominant spectral component, surrounded by lower sidebands which may indicate modulation effects from manufacturing errors or load variation. However, for the tested gears, the sideband amplitudes remained low, confirming the high quality of the manufactured gears.
To increase frequency resolution in the regions of interest, I applied the zoom FFT technique, which allowed me to more clearly observe the frequency distribution around the mesh frequency.
8.4 Envelope Demodulation Analysis
Envelope analysis, also known as the resonance demodulation technique, is a powerful method for detecting tooth faults in hypoid gears. This method is based on the Hilbert transform. The analytic signal is defined as:
$$ x_a(t) = x(t) + j\hat{x}(t) = A(t)e^{j\phi(t)} $$
where $\hat{x}(t)$ is the Hilbert transform of the signal $x(t)$. The envelope function $A(t)$ is given by:
$$ A(t) = \sqrt{x^2(t) + \hat{x}^2(t)} $$
By spectral analyzing the envelope, the modulation frequencies are extracted. In the tested hypoid gears, the envelope spectrum showed a single dominant amplitude at the pinion rotational frequency (13.89 Hz), indicating a slight gear eccentricity or misalignment. The amplitude was within acceptable limits, indicating a properly functioning gear pair.
8.5 Wavelet Packet Decomposition
To address the limitations of classical frequency analysis in handling non-stationary signals, I incorporated wavelet packet analysis into the detection system. Wavelet packet decomposition provides a comprehensive time-frequency decomposition of the signal, retaining both low-frequency and high-frequency information. The recursive decomposition is defined as:
$$ p_j^{2i}(t) = \sum_k H(k-2t)p_{j-1}^{i}(t) $$
$$ p_j^{2i+1}(t) = \sum_k G(k-2t)p_{j-1}^{i}(t) $$
where $H$ and $G$ are the low-pass and high-pass filter coefficients associated with the selected wavelet basis function. The signal is decomposed into different frequency bands, allowing for the isolation of fault signatures that may be masked by background noise in broadband analysis.
In my detection system, I combined wavelet packet decomposition with envelope demodulation processing. The vibration signal was first decomposed into the dyadic frequency bands of interest. The selected sub-band was then applied to envelope analysis, providing enhanced detectability for early-stage faults such as pitting and micro-cracking. This hybrid approach demonstrates superior diagnostic capabilities over traditional methods.
9. Conclusions
In this research, I successfully designed and optimized the hypoid gears for the drive axle of a CN100R mini vehicle through a systematic approach that integrates theoretical analysis, software-based design, system-level simulation, and experimental validation. The main achievements are summarized as follows:
- I established the complete design methodology for hypoid gears based on spatial meshing theory and the Gleason design system. The design incorporates the quasi-conjugate gear concept and optimized transmission error at the early design stage to reduce vibration and noise.
- I systematically determined the gear material, basic geometric parameters, and working parameters. Through iterative calculations using Gleason software, I selected an optimized parameter set characterized by a face width of 28 mm, and offset distance of 25 mm, and a pinion spiral angle of 49°15′. This configuration balances fatigue life between the pinion and gear while maintaining all required load-carrying capacities.
- I developed a complete final drive assembly model in MASTA software and conducted comprehensive system-level analyses, including load spectrum analysis, misalignment computation, stress validation, and NVH prediction. The simulation results verified the reliability and performance of the designed hypoid gears under realistic operating conditions, and identified key areas for structural improvements in the housing and bearing arrangements.
- I developed a dedicated fault detection system for hypoid gears using LabVIEW and MATLAB hybrid programming. I implemented a multi-domain diagnostic approach integrating time-domain statistics, frequency-domain spectra, envelope demodulation, and wavelet packet-based time-frequency analysis. The experimental tests on the produced gears confirmed their excellent quality and validated the effectiveness of the overall design.
The comprehensive design system established in this work, which encompasses design, simulation, optimization, and quality validation, has significantly reduced the development cycle and improved the quality consistency of hypoid gears for drive axle applications. The research findings have been successfully applied to the actual product development, demonstrating substantial practical value for the company. Future work will focus on expanding the speed and load range of the test conditions, integrating more advanced artificial intelligence-based fault diagnosis algorithms, and developing cloud-based remote monitoring systems for fleet vehicles equipped with the designed hypoid gears.