
1. Introduction
With the ever-increasing demands for high efficiency, high strength, low cost, and low noise in modern mechanical transmission systems, the face-hobbed method for manufacturing hypoid gears has gained considerable attention in the automotive and aerospace industries. Unlike face-milled hypoid gears, which produce tapered teeth requiring subsequent grinding operations, face-hobbed hypoid gears feature constant tooth depth and are manufactured through a continuous indexing process. This method allows for the simultaneous cutting of both tooth flanks in a single setup, significantly enhancing production efficiency and reducing manufacturing costs. However, the continuous indexing and full-processing nature of the face-hobbed method makes the tooth surface formation theory extremely complex, complicating tooth surface design, cutting adjustment calculations, and contact zone control.
This thesis addresses these key challenges by conducting a comprehensive investigation into the machining methods, tooth surface modeling, and meshing characteristics of face-hobbed hypoid gears. The research systematically analyzes the cutter head structure, machine tool kinematics, and machining principles. Based on this analysis, an accurate mathematical model of the tooth surface for face-hobbed hypoid gears is established. Subsequently, a meshing analysis model for this type of transmission is developed to study the influence of tool errors and installation misalignments on both tooth surface geometry and meshing performance. The outcomes of this research hold significant practical importance for optimizing cutter design, controlling meshing quality, and extending the service life of hypoid gears manufactured by the face-hobbed method.
The paper is structured as follows: Section 2 details the geometrical modeling of face-hobbed hypoid gears, including the cutter plate model based on the ND (Neutral Data) normal reference, the machine-tool coordinate system, and the tooth surface generation procedure. The influence of tool errors on tooth surface geometry is analyzed in this section. Section 3 establishes the load-contact analysis model and the vehicle axle mechanical model using MASTA software, followed by a comparison of theoretical and preset misalignments under various load conditions. Section 4 investigates the effects of misalignment and tool errors on the meshing characteristics, including contact patterns and transmission errors. Section 5 presents the experimental validation through actual cutting tests, tooth surface inspections, and rolling tests, verifying the accuracy of the proposed models. Finally, Section 6 summarizes the main conclusions and outlines future research directions.
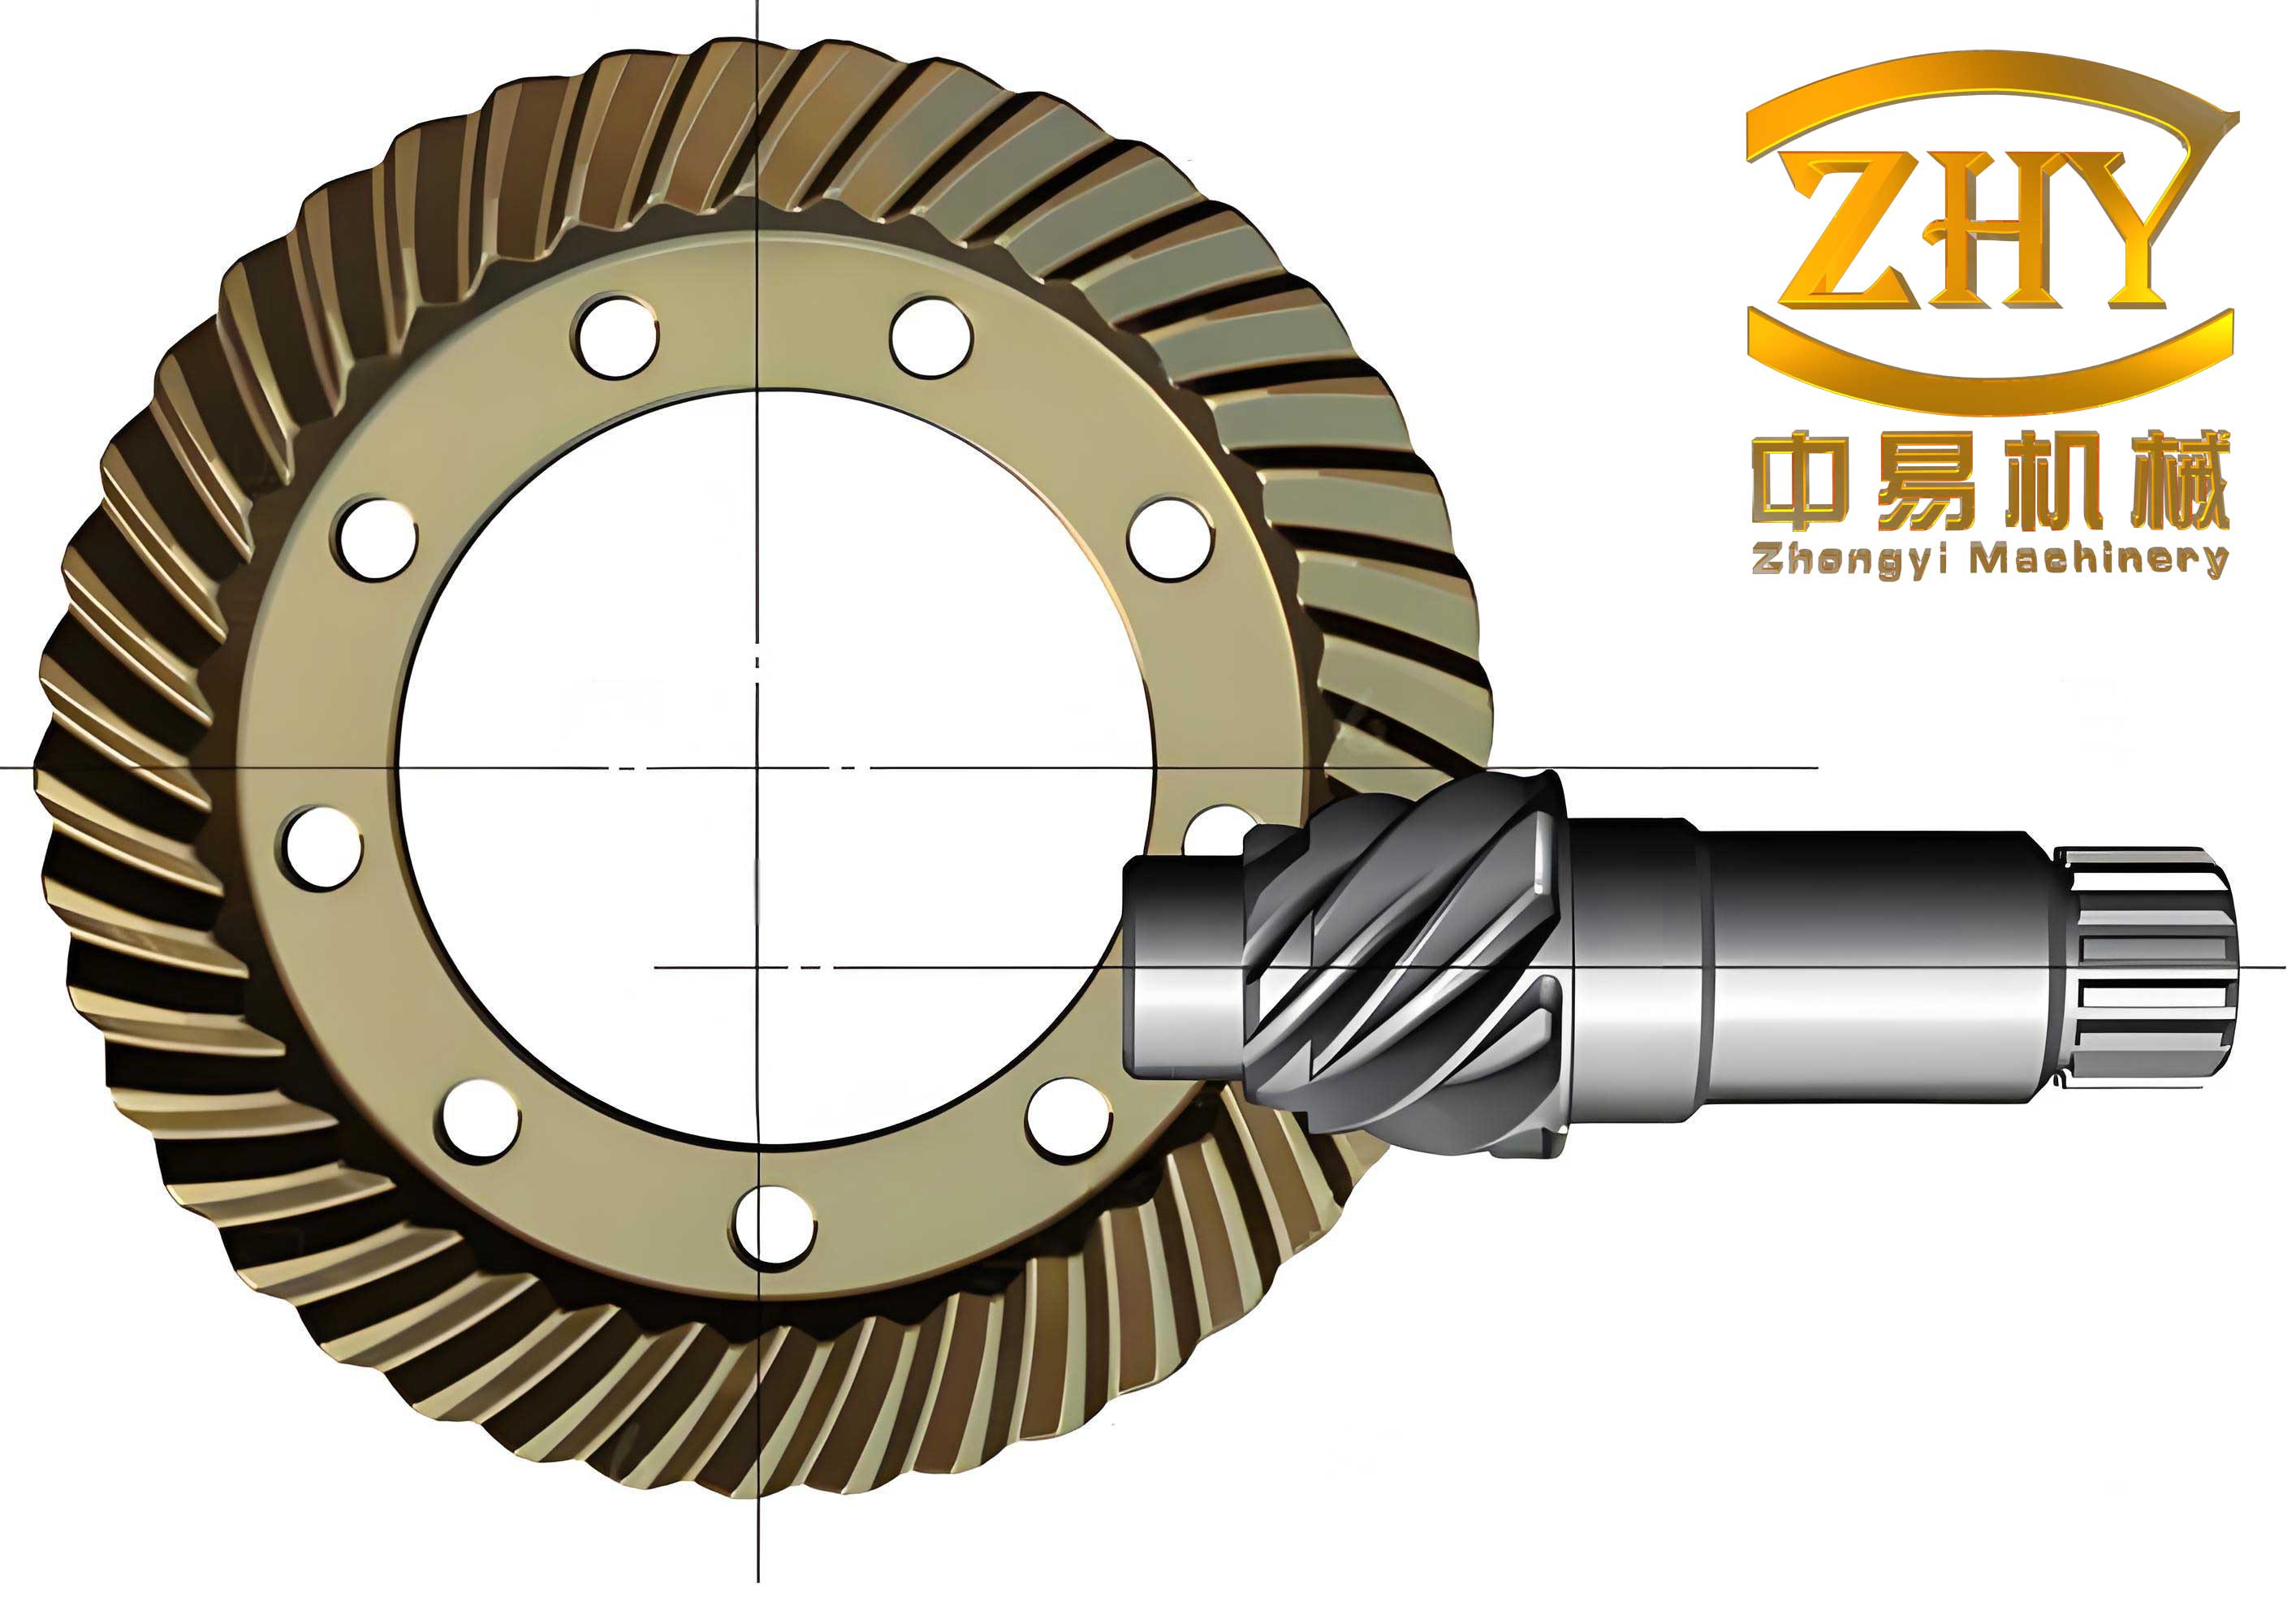
2. Mathematical Modeling of Tooth Surface for Face-Hobbed Hypoid Gears
2.1 Machining Principle and Cutter Plate Model
The face-hobbed process, also known as the continuous indexing method, is fundamentally different from the face-milling process. During cutting, the cutter head rotates about its own axis while simultaneously revolving around the machine cradle axis, generating an extended epicycloidal tooth trace. As illustrated in Figure 2.1 in the original thesis, the cutting process can be viewed as the meshing and cutting action between a generating gear (the cradle) and the workpiece. The cutter plate carries \( z_0 \) groups of blade pairs, each consisting of at least one inside blade and one outside blade for cutting the concave and convex flanks, respectively.
The mathematical model of the cutter plate is developed based on a three-face blade (front face, major flank, and side flank) with the ND (Neutral Data) normal reference system. The cutting edge is composed of two segments: the working profile segment and the tip fillet segment, which are tangent at point M. The coordinate system \( S_{qao} \) is established on the rake face of the blade, with the ND reference coordinate system \( S_{ano} \) providing the datum for blade orientation. For a left-handed cutter plate with an outside blade depicted in the original Figure 2.4(a), the mathematical expression for the cutting edge in coordinate system \( S_{qao} \) is given by:
For the working profile segment \( P_1P_2 \):
$$ \mathbf{r}_{qao}^{(w)}(u) = \begin{bmatrix} 0 \\ u \\ 0 \\ 1 \end{bmatrix} $$
where \( u \) is the arc length parameter measured from the reference point to a point N on the cutting edge.
For the tip fillet segment \( P_2P_3 \):
$$ \mathbf{r}_{qao}^{(f)}(\theta) = \mathbf{T}_{qao,o} \cdot \mathbf{T}_{o,m} \cdot \mathbf{r}_{m}^{(f)}(\theta) $$
with the coordinate transformations given by:
$$ \mathbf{T}_{o,m} = \begin{bmatrix} \cos \delta_0 & -\sin \delta_0 & 0 & 0 \\ \sin \delta_0 & \cos \delta_0 & 0 & l_{bc} \\ 0 & 0 & 1 & 0 \\ 0 & 0 & 0 & 1 \end{bmatrix} $$
$$ \mathbf{T}_{qao,o} = \begin{bmatrix} 1 & 0 & 0 & 0 \\ 0 & \cos \alpha_0 & -\sin \alpha_0 & 0 \\ 0 & \sin \alpha_0 & \cos \alpha_0 & 0 \\ 0 & 0 & 0 & 1 \end{bmatrix} \cdot \begin{bmatrix} 0 \\ 0 \\ r_{bc} \\ 1 \end{bmatrix} $$
where \( r_{bc} \) is the tip fillet radius, and \( \delta_0 \) is the angular position parameter.
To describe the blade orientation in the cutter head coordinate system, a series of coordinate transformations are applied. The blade orientation angles include the rake angle \( \gamma_0 \), the regrind angle \( \varepsilon_0 \), and the cutting side relief angle \( \alpha_{qao} \). For the left-handed cutter, the transformation from the blade coordinate system \( S_{qao} \) to the cutter head coordinate system \( S_{c} \) involves:
First, the transformation describing the blade position on the cutter head:
$$ \mathbf{T}_{c,ac} = \mathbf{T}_{c,bc} \cdot \mathbf{T}_{bc,ac} $$
Then, the transformation for the blade angular orientation:
$$ \mathbf{T}_{qao,anq} = \mathbf{T}_{qao,bv} \cdot \mathbf{T}_{bv,bc} \cdot \mathbf{T}_{bc,anq} $$
where each transformation matrix incorporates the specific angular offsets, such as \( \beta \) for the blade mounting angle and \( q_{az} \) for the blade circumferential position.
2.2 Machine Tool Settings and Coordinate Systems
The machine kinematics for a traditional cradle-style hypoid gear generator is shown in the original Figure 2.4(d). The coordinate systems \( S_{m} \), \( S_{g} \), and \( S_{p} \) are attached to the cradle, workpiece, and cutter head, respectively. The auxiliary coordinate systems \( S_{m1} \), \( S_{m2} \), and \( S_{m3} \) are used to describe the vertical offset E, the sliding base B, and the horizontal offset A. For a left-hand spiral bevel gear, the coordinate transformation from the cutter head to the workpiece is formulated as follows:
$$ \mathbf{T}_{p,m} = \mathbf{T}_{p,m3} \cdot \mathbf{T}_{m3,m2} \cdot \mathbf{T}_{m2,m1} \cdot \mathbf{T}_{m1,m} $$
where, for example, the transformation matrix accounting for the machine root angle \( \gamma_m \) is given by:
$$ \mathbf{T}_{m1,m} = \begin{bmatrix} \cos \gamma_m & 0 & \sin \gamma_m & 0 \\ 0 & 1 & 0 & 0 \\ -\sin \gamma_m & 0 & \cos \gamma_m & 0 \\ 0 & 0 & 0 & 1 \end{bmatrix} $$
and for the vertical offset E:
$$ \mathbf{T}_{m2,m1} = \begin{bmatrix} 1 & 0 & 0 & 0 \\ 0 & 1 & 0 & E \\ 0 & 0 & 1 & 0 \\ 0 & 0 & 0 & 1 \end{bmatrix} $$
The machine settings used in this study correspond to a semi-generated (Spirac) process, where the gear is cut by the formate method (no generating motion) and the pinion is cut by the generating method with a tilted spindle. The key machine parameters are summarized in Table 2.2 below.
| Parameters | Symbol | Pinion | Gear |
|---|---|---|---|
| Blade tilt angle (deg) | i | 3.3325 | 0 |
| Blade swivel angle (deg) | j | 146.9405 | 0 |
| Radial setting (mm) | S_R | 121.9391 | 122.009 |
| Initial cradle angle (deg) | q | 52.6673 | -29.7048 |
| Vertical offset (mm) | E | 39.8352 | 0 |
| Sliding base (mm) | B | -12.2486 | 0 |
| Horizontal setting (mm) | A | 3.1158 | 13.9199 |
| Machine root angle (deg) | γ_m | 23.4453 | 64.7995 |
| Ratio of roll | i_{gp} | 4.722168 | 0 |
2.3 Tooth Surface Generation and Meshing Equation
The gear tooth surface is obtained by transforming the cutting edge locus into the workpiece coordinate system. For the formate-generated gear, the tooth surface is simply the trace surface of the cutting edge. For the generating-generated pinion, the tooth surface is the envelope of the family of cutter surfaces, which is determined via the meshing equation.
In the workpiece coordinate system \( S_p \), the tooth surface position vector and unit normal vector are expressed as:
$$ \mathbf{r}_p(u, \theta, \phi) = \mathbf{T}_{p,m}(\phi) \cdot \mathbf{r}_m(u, \theta) $$
$$ \mathbf{n}_p(u, \theta, \phi) = \mathbf{T}_{p,m}(\phi) \cdot \mathbf{n}_m(u, \theta) $$
where \( \phi \) is the generalized rotation parameter of the machine, \( u \) is the cutting edge parameter, and \( \theta \) is the blade profile parameter.
The relative velocity between the cutter and the workpiece in the machine coordinate system is given by:
$$ \mathbf{v}^{(p,m)} = \left( \boldsymbol{\omega}_p – \boldsymbol{\omega}_m \right) \times \mathbf{r}_m + \boldsymbol{\omega}_p \times \mathbf{O}_p\mathbf{O}_m $$
where \( \boldsymbol{\omega}_p \) and \( \boldsymbol{\omega}_m \) are the angular velocity vectors of the workpiece and cradle, respectively, and \( \mathbf{O}_p\mathbf{O}_m \) is the vector connecting the origins of the two coordinate systems.
According to the gearing theory, the meshing equation governs the conjugate condition between the cutter surface and the generated tooth surface:
$$ f(u, \theta, \phi) = \mathbf{n}_m \cdot \mathbf{v}^{(p,m)} = 0 $$
Solving the meshing equation for one of the parameters, say \( \theta = \theta(u, \phi) \), and substituting it back into the position vector equation yields the complete tooth surface model.
2.4 Geometrical Modeling Results
The geometric parameters of the face-hobbed hypoid gear pair used in this study are presented in Table 2.1. The gear pair has a gear ratio of 47:11, a shaft angle of 90 degrees, and a pinion offset of 38.1 mm. The cutter radius for the pinion concave flank is 1062.73 mm with a pressure angle of 20.1933 degrees, while the gear convex flank employs a cutter radius of 1276.45 mm with a pressure angle of 23.5060 degrees.
| Parameters | Pinion | Gear |
|---|---|---|
| Offset distance E (mm) | 38.1 | |
| Shaft angle ∑ (deg) | 90 | |
| Number of teeth | 11 | 47 |
| Hand of spiral | Left | Right |
| Addendum modification coefficient | 0.65 | -0.65 |
| Reference cone distance (mm) | 76 | 76 |
| Cutter radius, concave flank (mm) | 1093.65 | 1360.74 |
| Cutter radius, convex flank (mm) | 1062.73 | 1276.45 |
| Pressure angle, concave (deg) | 22.3059 | 18.9931 |
| Pressure angle, convex (deg) | 20.1933 | 23.5060 |
| Regrind angle (deg) | 4.3674 / 4.7856 | 5.0309 / 4.1101 |
| Cutting side relief angle (deg) | 13.3885 / 12.6729 | 13.3823 / 12.6781 |
| Rake angle (deg) | 9.5870 / 10.3059 | 12.6781 / 9.6107 |
The tooth surface coordinates are computed by solving the system of equations in MATLAB for a grid of 17×2 points across the tooth flank. A sample of the computed pinion tooth surface point set is presented in Table 2.3, showing the spatial coordinates of the concave and convex flanks at various positions along the face width and profile directions.
| Point | Pinion Concave X (mm) | Y (mm) | Z (mm) | Pinion Convex X (mm) | Y (mm) | Z (mm) |
|---|---|---|---|---|---|---|
| 1 | 143.26 | 43.159 | -44.344 | 135.03 | 39.345 | -46.383 |
| 2 | 143.38 | 42.678 | -44.250 | 135.26 | 39.476 | -45.788 |
| 3 | 143.62 | 41.729 | -44.072 | 135.48 | 39.596 | -45.198 |
| 4 | 143.75 | 41.262 | -43.990 | 135.70 | 39.705 | -44.613 |
| 5 | 143.88 | 40.800 | -43.912 | 135.92 | 39.804 | -44.034 |
| 6 | 144.00 | 40.343 | -43.839 | 136.14 | 39.892 | -43.460 |
| 7 | 144.13 | 39.892 | -43.773 | 136.36 | 39.971 | -42.893 |
| 8 | 144.26 | 39.446 | -43.713 | 136.59 | 40.040 | -42.331 |
| 9 | 144.39 | 39.006 | -43.661 | 136.81 | 40.099 | -41.775 |
| 10 | 144.53 | 38.572 | -43.618 | 137.03 | 40.148 | -41.226 |
The computed discrete tooth surface points are imported into CREO (PTC Creo Parametric) to construct the solid tooth profiles. The gear blank is first modeled, and then a Boolean subtraction operation is performed using the tooth space surfaces to remove the material and create the final gear tooth geometry. The resulting solid model of the hypoid gear pair is shown in the original Figures 2.5 and 2.6. A preliminary assembly check confirms no interference between the gear and pinion teeth at both the toe and heel ends, which provides an initial validation of the correctness of the mathematical models.
3. Analysis of Tool Errors on Tooth Surface Geometry
3.1 Definition of Tool Errors
In practice, the machined tooth surface inevitably deviates from the theoretical design due to various factors, including manufacturing tolerances, tool wear, and machining errors. Tool grinding errors are among the primary contributors to tooth surface deviations, as they directly transfer onto the machined flank geometry. Based on the geometric features of the cutting blade, five independent tool error parameters are defined, as illustrated in the original Figure 2.7:
- The cutting edge circular arc radius error \( \Delta R_c \)
- The reference point pressure angle error \( \Delta \alpha_0 \)
- The rake angle error \( \Delta \gamma_0 \)
- The regrind angle error \( \Delta \varepsilon_0 \)
- The cutting side relief angle error \( \Delta \alpha_{qao} \)
Table 2.5 and Table 2.6 summarize the standard values and error magnitudes investigated in this study. For the circular arc radius, four error levels are considered: ±50 mm and ±100 mm. For the angular parameters, four error levels are considered: ±0.5 degrees and ±1 degree.
| Case | Standard | (a) | (b) | (c) | (d) |
|---|---|---|---|---|---|
| \( \Delta R_c \) (mm) | 1062.73 | -100 | -50 | +50 | +100 |
| Error Type | Standard | (a) | (b) | (c) | (d) |
|---|---|---|---|---|---|
| \( \Delta \alpha_0 \) (deg) | 20.1933 | -1 | -0.5 | 0.5 | 1 |
| \( \Delta \varepsilon_0 \) (deg) | 4.7856 | -1 | -0.5 | 0.5 | 1 |
| \( \Delta \gamma_0 \) (deg) | 10.3059 | -1 | -0.5 | 0.5 | 1 |
| \( \Delta \alpha_{qao} \) (deg) | 12.6729 | -1 | -0.5 | 0.5 | 1 |
3.2 Influence of Tool Errors on Tooth Surface Deviations
To quantify the effect of each tool error on the tooth surface geometry, a comparative analysis is conducted on the pinion concave flank. The tooth surface deviation \( \delta \) is defined as the normal distance between the error-affected surface and the standard surface, with a positive value indicating the surface lies outside the standard flank (excess material) and a negative value indicating the surface lies inside (material removal).
3.2.1 Cutter Radius Error
The influence of the cutting edge radius error \( \Delta R_c \) on tooth surface geometry shows a clear pattern: a negative radius error yields negative deviations (material on the inside), and a positive error yields positive deviations. The deviations are more pronounced at the heel end than at the toe end, with the largest offset at the top- heel region. The maximum deviation for \( \Delta R_c = -100 \) mm is approximately 0.92 mm, while for \( \Delta R_c = +100 \) mm, the maximum deviation is about 0.95 mm. Notably, the negative radius error has a slightly larger effect on the geometric deviation than the positive error for the same magnitude.
3.2.2 Pressure Angle Error
For the reference point pressure angle error \( \Delta \alpha_0 \), the following observations are made:
- A positive pressure angle error induces negative tooth surface deviations, while a negative error induces positive deviations.
- The maximum deviation for +1 degree is 0.2303 mm, located near the heel-top corner, and for -1 degree is 0.1159 mm, positioned near the toe-mid region.
- The positive pressure angle error has a greater impact than the negative error, with the maximum deviation being approximately twice as large.
3.2.3 Regrind Angle Error
The regrind angle error \( \Delta \varepsilon_0 \) exhibits a similar deviation pattern to the pressure angle. A negative regrind angle error yields positive deviations, and a positive error yields negative deviations. For \( \Delta \varepsilon_0 = -1 \) degree, the maximum deviation is 0.0312 mm (near heel-top), and for +1 degree it reaches 0.000654 mm (near heel-mid). The deviation increases linearly with the error magnitude, and the incremental deviation per unit error is nearly constant across the four considered error levels.
3.2.4 Rake Angle Error
The rake angle error \( \Delta \gamma_0 \) produces a very small influence on tooth surface geometry. Both positive and negative rake angle errors yield negative deviations. The maximum deviation for \( \Delta \gamma_0 = -1 \) degree is \( 7.2 \times 10^{-6} \) mm, and for \( +1 \) degree is \( 4.9 \times 10^{-6} \) mm. These values are orders of magnitude smaller than those induced by other tool errors, indicating that the rake angle error has a negligible effect on the global tooth surface geometry, although it may influence the surface roughness and cutting mechanics.
3.2.5 Cutting Side Relief Angle Error
The cutting side relief angle error \( \Delta \alpha_{qao} \) also shows a trend similar to the pressure angle and regrind angle. For \( \Delta \alpha_{qao} = -1 \) degree, the maximum deviation is 0.0056 mm, while for +1 degree it is 0.000098 mm. The deviation pattern indicates a larger impact at the heel-top region and a smaller impact at the toe-mid region.
Figure 2.19 in the original thesis provides a comprehensive comparison of the maximum deviations caused by all five tool error types. The results clearly demonstrate that the reference point pressure angle has the dominant influence on tooth surface geometry, followed by the cutting side relief angle, the regrind angle, and finally the rake angle, which has the least significant effect. The cutter radius error, while having some influence, was found to be less critical in terms of absolute magnitude. These findings underscore the importance of precise grinding and setting of the blade angles, especially the pressure angle, to control the tooth surface accuracy of face-hobbed hypoid gears.
4. Meshing Model and Misalignment Analysis
4.1 Vehicle Axle System Model in MASTA
To evaluate the effect of system deformation on the meshing conditions of hypoid gears, a comprehensive vehicle axle model is developed using the MASTA software package. The axle assembly consists of several key components:
- The pinion input shaft supported by two tapered roller bearings arranged in an O-type configuration.
- The ring gear bolted to the differential housing, which also houses the differential gear set (side gears, pinion gears, and cross shaft).
- The left and right output half shafts, each supported by two additional tapered roller bearings.
- The housing (carrier), which provides the structural support for all components.
Since MASTA cannot directly model the complex housing geometry, the finite element model of the housing is imported externally. The bearing reference points serve as connection nodes between the transmission system and the housing model. The integrated axle mechanics model is depicted in the original Figure 3.23.
Table 3.7 lists the key parameters of the four primary support bearings used in the axle system.
| Parameter | Bearing 1 | Bearing 2 | Bearing 3 | Bearing 4 |
|---|---|---|---|---|
| Type | NSK | Timken | SKF | SKF |
| Inner diameter (mm) | 28.575 | 34.925 | 45.618 | 38.1 |
| Outer diameter (mm) | 73.025 | 76.2 | 82.931 | 72.238 |
| Width (mm) | 22.225 | 29.37 | 26.988 | 20.638 |
In addition to the gear support, the differential gear set is modeled using conceptual bearings with defined stiffness values to represent the planetary gear system. The stiffness parameters are summarized in Table 3.6 in the original thesis, where the axial and radial stiffness values are carefully chosen to simulate the differential behavior.
4.2 Finite Element Contact Model of Hypoid Gear Pair
Based on the precise solid model of the face-hobbed hypoid gear pair established in Section 2, a finite element mesh model is developed for load-contact analysis. The mesh strategy is as follows:
- The pinion is modeled as a full gear with 11 teeth using C3D10 tetrahedral elements (approximately 17,600 elements).
- The gear is modeled as a partial gear model with 11 teeth using C3D8R hexahedral elements (approximately 89,400 elements).
- The pinion concave flank and the gear convex flank are designated as the driving and driven contact surfaces, respectively.
- The gear material is hardened steel with Young’s modulus of 210 GPa and Poisson’s ratio of 0.3.
The boundary conditions are applied via reference coupling points: \( S_1 \) and \( S_2 \) couple the pinion and gear rotational surfaces, respectively. The analysis consists of three steps: (1) a small pinion rotation to establish initial contact, (2) application of a torque load at the gear reference point, and (3) a final rotation to simulate one full mesh cycle. This approach allows for the extraction of contact pressures, contact patterns, transmission errors, and root bending stresses under various load conditions.
4.3 Misalignment Analysis and Comparison
Misalignment in a hypoid gear set refers to the relative positional deviations between the pinion and gear axes from their ideal theoretical positions. Four misalignment components are defined, as illustrated in the original Figure 3.26:
- \( E \): offset error along the pinion axis (positive when the pinion moves toward its toe)
- \( XP \): offset error along the gear axis (positive when the gear moves toward its heel)
- \( XW \): offset error along the gear axis (positive when the gear moves toward its toe)
- \( \sum \): shaft angle error (positive when the angle increases)
These misalignments are computed for three load conditions listed in Table 3.8:
| Case | Input speed (r/min) | Input torque (N·m) | Duration (hr) |
|---|---|---|---|
| Case 1 | 6000 | 50 | 100 |
| Case 2 | 680 | 450 | 100 |
| Case 3 | 330 | 900 | 100 |
The theoretical misalignment values (without considering installation pre-deviations) are calculated for each load case and are presented in Table 3.9. The results show that all misalignment components increase nonlinearly with the applied torque, with the pinion offset error \( E \) being the dominant component. For example, the total offset error increases from 13.39 μm at 50 N·m to 132.40 μm at 900 N·m, a nearly tenfold increase.
| Misalignment (μm) | Case 1 | Case 2 | Case 3 |
|---|---|---|---|
| Gear E | 0.6469 | 2.6167 | 4.1776 |
| Gear XP | -4.238 | -22.4117 | -38.981 |
| Gear XW | 7.6618 | 32.5358 | 52.1534 |
| Gear Σ | 0.02224 | 0.1053 | 0.1759 |
| Pinion E | 12.7469 | 71.9841 | 128.2177 |
| Pinion XP | -8.1972 | -42.5919 | -74.0569 |
| Pinion XW | 13.4506 | 81.1147 | 146.95 |
| Pinion Σ | -0.08085 | -0.5288 | -0.9765 |
| Total E | 13.3938 | 74.6008 | 132.3953 |
| Total XP | -12.4352 | -65.0036 | -113.0379 |
| Total XW | 21.1124 | 113.6506 | 199.1034 |
| Total Σ | -0.0586 | -0.4235 | -0.8006 |
To compensate for the undesired misalignments under operating conditions, the concept of “preset eccentricity” of the housing is introduced. In a practical enhancement, the left output half-shaft of the housing is machined with an upward offset of 1.12 mm in the A direction, and the right output half-shaft with a forward offset of 1 mm in the B direction (per Table 3.4). The corresponding misalignment calculations under these preset conditions are summarized in Table 3.10.
| Misalignment (μm) | Case 1 | Case 2 | Case 3 |
|---|---|---|---|
| Gear E | 0.5946 | 2.1223 | 3.183 |
| Gear XP | -3.8788 | -19.0303 | -32.1943 |
| Gear XW | 7.6099 | 32.0996 | 51.288 |
| Gear Σ | 0.02261 | 0.1085 | 0.1821 |
| Pinion E | 12.1634 | 66.8763 | 118.0536 |
| Pinion XP | -7.3678 | -35.495 | -60.1514 |
| Pinion XW | 13.7522 | 83.9604 | 152.5045 |
| Pinion Σ | -0.08237 | -0.5437 | -1.0056 |
| Total E | 12.758 | 68.9985 | 121.2366 |
| Total XP | -11.2466 | -54.5253 | -92.3457 |
| Total XW | 21.3621 | 116.06 | 203.7924 |
| Total Σ | -0.05977 | -0.4352 | -0.8236 |
A comparison between Tables 3.9 and 3.10 reveals that the preset housing eccentricity effectively reduces the offset error E by approximately 5-8% and the pinion axial error XP by approximately 10-18% across all three load cases. Meanwhile, the gear axial error XW shows a slight increase of around 1-3% at higher loads. The shaft angle error Σ remains relatively unchanged. Since hypoid gears are less sensitive to gear axial errors, the net effect of the preset eccentricity is beneficial for improving the meshing quality, particularly in reducing the offset and pinion axial misalignments that have a more pronounced impact on contact behavior.
5. Meshing Characteristics Analysis
5.1 Influence of Misalignment on Meshing Characteristics
5.1.1 Standard Installation (zero misalignment)
Under the standard installation with no misalignment, the meshing characteristics are computed for the three load conditions. At a low torque of 50 N·m, the contact pattern is point-like, with a maximum contact pressure of 403 MPa and a contact area ratio of 11.78%. As the torque increases to 450 N·m, the contact zone grows to an elliptical shape, with a maximum pressure of 950 MPa and an area ratio of 30.7%. At the highest torque of 900 N·m, the maximum contact pressure reaches 1294 MPa, and the contact area ratio increases to 40.5%.
The transmission error (TE) is expressed in terms of the angular (rotational) transmission error, and the transmission error peak-to-peak values (TEpp) increase with increasing load. For the standard installation, the TEpp values are relatively low, indicating good mesh smoothness under ideal alignment conditions.
The maximum root bending stress also escalates with load, from 29.61 MPa at 50 N·m to 202.7 MPa at 450 N·m and further to 321.67 MPa at 900 N·m. The location of the maximum root stress shifts toward the heel end as the load increases, and the duration of tooth engagement lengthens, reflecting a higher effective contact ratio.
5.1.2 Theoretical Misalignment
When the calculated theoretical misalignments from Table 3.9 are applied to the finite element model, the meshing characteristics change noticeably. The primary observations are:
- Edge contact occurs at the tooth top (tip) under all load conditions, and this edge contact becomes more pronounced with increasing load.
- The maximum contact pressure increases slightly compared to the standard installation: from 365 MPa to 1516 MPa across the load range, while the contact area ratio decreases.
- The transmission error peak-to-peak values are consistently higher than those under standard installation, indicating increased vibration excitation potential.
5.1.3 Preset Eccentricity Misalignment
Applying the preset eccentricity misalignments from Table 3.10 yields the following meshing characteristics:
- The contact pattern location and size are very similar to those obtained with theoretical misalignment, suggesting that the preset eccentricity does not significantly alter the contact pattern.
- The maximum contact pressures are comparable: 368 MPa, 921 MPa, and 1589 MPa for the three load cases, respectively.
- The transmission error peak-to-peak values slightly decrease compared to the theoretical misalignment case, indicating an improvement in mesh smoothness due to the partial cancellation of misalignments.
Figure 4.8 in the original thesis provides a direct comparison of the transmission errors across these three installation conditions, confirming that the standard installation yields the lowest TEpp, while the preset eccentricity condition shows a slight reduction compared to the theoretical misalignment condition.
5.2 Influence of Tool Errors on Meshing Characteristics
The influence of each tool error parameter on the meshing characteristics of the face-hobbed hypoid gear pair is investigated at a constant load of 450 N·m. The results focus on three primary performance metrics: the contact pattern (location and size), the transmission error mean and peak-to-peak values, and the root bending stress.
5.2.1 Cutter Radius Error
The cutter radius error has a relatively minor influence on the contact pattern. The position and size of the contact ellipse remain nearly unchanged, although the contact stress values show some variation. As the cutter radius increases, the transmission error mean increases slightly, while the peak-to-peak value exhibits minor fluctuations between 0.18 and 0.225. The root bending stress remains near its standard value of 227.85 MPa with negligible sensitivity to the radius error.
5.2.2 Reference Point Pressure Angle Error
The pressure angle error has a pronounced effect on the contact pattern. With increasing pressure angle, the contact pattern shifts from the heel-root region toward the toe-tip region. The speed of movement in the profile direction is greater than in the lengthwise direction. The contact area initially increases and then decreases with pressure angle changes. Specifically:
- For \( \Delta \alpha_0 = -1^\circ \), the contact pattern moves toward the root, and the contact area increases to about 33%.
- For \( \Delta \alpha_0 = +1^\circ \), the pattern shifts toward the toe-tip, and the area decreases to around 28%.
- Transmission error peak-to-peak increases by 276% for a +1° error and decreases by 56% for a -1° error relative to the standard value of 0.188.
- The maximum root bending stress exhibits a non-monotonic behavior, reaching a minimum of 152.86 MPa at \( \Delta \alpha_0 = +1^\circ \).
5.2.3 Rake Angle Error
The rake angle error demonstrates minimal influence on the contact pattern, with the position and size remaining essentially unchanged (contact area ratio stays around 31%). The transmission error mean increases slightly from 11.28 to 11.33 as the rake angle error varies from -1° to +1°. The TEpp values increase by up to 9.8% relative to the standard. The root bending stress is largely insensitive to rake angle variations.
5.2.4 Regrind Angle Error
The regrind angle error has a moderate effect on the meshing characteristics. Increasing the regrind angle causes the contact pattern to move toward the tooth top, and the contact area shrinks. Specifically:
- The contact area decreases from 33.4% to 28.8% as the error varies from -1° to +1°.
- Edge contact at the tooth tip begins when the regrind angle error reaches +1°.
- The transmission error peak-to-peak increases with positive errors, while negative errors produce almost no change.
- Decreasing the regrind angle is beneficial for enlarging the contact area and reducing the transmission error.
5.2.5 Cutting Side Relief Angle Error
The cutting side relief angle error behaves similarly to the rake angle error. It has a negligible effect on the contact pattern (area ratio stays between 30% and 32%) but has a noticeable influence on the transmission error mean, which increases from 11.21 to 11.42 as the error varies from -1° to +1°. The TEpp increases by up to 9.54%. The root bending stress position remains unchanged, although the magnitude can be slightly reduced by decreasing the cutting side relief angle.
Table 5.1 below summarizes the qualitative influence of each tool error on the primary meshing characteristics, providing a comprehensive overview of the sensitivity of face-hobbed hypoid gears to blade errors.
| Tool Error Type | Contact Pattern Position | Contact Area | TE Mean | TE Peak-to-Peak | Root Stress |
|---|---|---|---|---|---|
| Cutter radius error | Insensitive | Slight increase | Slight increase | Minor fluctuation | Insensitive |
| Pressure angle error | Highly sensitive | Non-monotonic | Decrease | Highly sensitive | Non-monotonic |
| Rake angle error | Insensitive | Insensitive | Slight increase | Slight increase | Insensitive |
| Regrind angle error | Moderate shift | Decrease | Increase | Increase for positive | Slight decrease |
| Relief angle error | Insensitive | Insensitive | Increase | Slight increase | Slight decrease |
6. Experimental Validation
6.1 Cutting and Tooth Surface Inspection
To validate the mathematical model of the tooth surface, actual cutting experiments are performed using a C27 CNC hypoid gear cutting machine, as depicted in the original Figure 5.1. The machining parameters listed in Tables 2.1 and 2.2 are used to generate a face-hobbed hypoid gear pair. The ring gear is then assembled into a vehicle axle housing (shown in original Figure 5.2).
The manufactured pinion and gear are inspected on a Gleason 650GMS gear measuring machine, as illustrated in the original Figure 5.3. The measured tooth surface coordinates at 45 grid points are recorded. A comparison between the theoretical tooth surface points (from the mathematical model) and the measured points is performed. The results show:
- For the pinion concave flank, the maximum deviation is 0.0075 mm located at the toe-top point.
- The minimum deviation is -0.0015 mm at the heel-root point.
- For the gear convex flank, the maximum deviation is 0.0023 mm at the toe-top point.
- The minimum deviation is -0.0005 mm at the heel-root point.
These sub-10-micron deviations confirm that the mathematical model accurately predicts the machined tooth surface geometry of face-hobbed hypoid gears.
Table 5.2 shows a comparison of the theoretical (measured by the 650GMS) and calculated tooth surface coordinate values at selected grid points, illustrating the excellent correlation.
| Point | Theoretical X (mm) | Measured X (mm) | Theoretical Y (mm) | Measured Y (mm) | Theoretical Z (mm) | Measured Z (mm) |
|---|---|---|---|---|---|---|
| 1 | 27.137 | 27.135 | 27.489 | 27.488 | 106.206 | 106.203 |
| 2 | 28.876 | 28.878 | 27.103 | 27.101 | 106.206 | 106.209 |
| 3 | 30.650 | 30.648 | 26.593 | 26.595 | 106.206 | 106.204 |
| 4 | 32.454 | 32.456 | 25.952 | 25.950 | 106.206 | 106.208 |
| 5 | 34.278 | 34.275 | 25.176 | 25.178 | 106.206 | 106.202 |
6.2 Rolling Test Validation
After the gear pair is subjected to heat treatment (carburizing) and lapping, a rolling test is conducted on a Klingelnberg roll-testing machine to evaluate the actual contact pattern and transmission error. The experimental contact pattern (shown in original Figure 5.5) reveals that the heat treatment process caused the contact pattern to shift toward the toe end, which is consistent with the design intent to achieve a centered contact under normal operating conditions.
A comparison is made between three sets of results:
- The experimental contact pattern and measured transmission error from the rolling test.
- The theoretical TCA and LTCA results from the KIMOS software package.
- The finite element computed contact pattern and transmission error from the model established in Section 4.
The comparison demonstrates:
- The finite element calculated contact pattern is in very close agreement with the KIMOS TCA result in terms of both location and size.
- The transmission error obtained from the finite element model is much closer to the measured rolling test transmission error than the KIMOS theoretical value, since the finite element model accounts for tooth deflections and load sharing.
- The contact pattern area and position from the finite element analysis align well with the experimental observations, confirming the accuracy of the entire modeling and analysis chain.
This experimental validation provides substantial evidence that the proposed mathematical tooth surface model, the MASTA axle model, and the finite element loaded-contact analysis model are accurate and reliable for predicting the meshing behavior of face-hobbed hypoid gears.
7. Conclusions
This thesis presents a comprehensive investigation into the mesh characteristics of face-hobbed hypoid gears, covering mathematical modeling, error sensitivity analysis, system-level misalignment calculations, and experimental validations. The primary conclusions are summarized as follows:
(1) A complete mathematical model for the tooth surface of face-hobbed hypoid gears is established based on the actual cutting mechanism and cutter plate geometry. The model employs a three-face blade representation with the ND normal reference frame, and the kinematic chain from the cutter head through the machine to the workpiece is rigorously derived. The resulting tooth surface equations accurately capture the complex geometry of uniform-depth hypoid gears.
(2) The analysis of tool errors reveals that the reference point pressure angle error has the most significant impact on tooth surface geometry, followed by the cutting side relief angle and the regrind angle errors. The rake angle error shows a negligible influence on the global tooth surface geometry. The maximum deviations are consistently located near the heel-top corner, while the minimum deviations occur near the toe-mid region. These findings guide the prioritization of geometric accuracy control in blade manufacturing and conditioning.
(3) The system-level analysis using MASTA demonstrates that the housing preset eccentricity approach can effectively reduce two of the four misalignment components (offset error and pinion axial error) across all load conditions. Although the gear axial error slightly increases under high loads, the net effect is beneficial since hypoid gears are less sensitive to this component.
(4) The finite element loaded-contact analysis reveals that the presence of misalignment induces edge contact at the tooth tip, which becomes more pronounced with increasing load. The preset eccentricity condition shows a slight transmission error improvement compared to the theoretical misalignment condition, indicating its effectiveness in reducing vibration excitation.
(5) Among the five tool error parameters studied, the pressure angle error exerts the greatest influence on the meshing characteristics, causing substantial shifts in the contact pattern location and significant changes in the transmission error peak-to-peak values. The cutter radius error and rake angle error have the least impact, while the regrind angle and cutting side relief angle errors show intermediate effects. These results provide a quantifiable basis for error budget allocation and quality control in cutter manufacturing.
(6) Experimental cutting and rolling tests validate the mathematical model, with maximum tooth surface deviations below 10 μm and a strong correlation between finite element results and measured contact patterns and transmission errors. The established modeling and analysis framework proves to be a reliable tool for the design, optimization, and fault diagnosis of face-hobbed hypoid gears.
Future research directions include incorporating heat treatment deformation compensation into the tooth surface model, extending the analysis to dynamic conditions for noise and vibration prediction, and optimizing lapping processes to further reduce transmission error and improve the durability of face-hobbed hypoid gears.