
Spur gears are among the most widely used transmission components in mechanical systems. Their simple structure, excellent manufacturability, and absence of axial thrust make them particularly attractive for aerospace and high-speed power transmission applications. In recent years, high contact ratio (HCR) spur gears have received increasing attention because they offer smoother meshing, reduced dynamic excitation, and lower effective mesh stiffness compared with normal contact ratio (NCR) spur gears. However, the larger addendum required to achieve a contact ratio above 2 increases the relative sliding velocity between tooth flanks, which intensifies frictional heating and raises the risk of scuffing failure. In this work, I systematically investigate the combined effects of tooth profile modification and elastic deformation on the scuffing performance of HCR spur gears. The study begins with a detailed analysis of load sharing among simultaneously engaged tooth pairs, followed by a flash temperature calculation model for the contact temperature distribution along the line of action. I then propose a rational tooth profile modification design to reduce the maximum contact temperature and improve the anti-scuffing capacity. Finally, I validate the theoretical predictions through gear scuffing experiments using thermometric measurements at critical tooth surface points.
1. Introduction and Background
The demand for higher power density and reliability in gear transmission systems has promoted the development of high contact ratio spur gears. By definition, an HCR spur gear pair has a total contact ratio ε greater than 2, meaning that at least two pairs of teeth are always in mesh, and sometimes three pairs are engaged simultaneously. This characteristic reduces the load carried by a single tooth at any instant and improves the smoothness of transmission. However, the increase in addendum height that is necessary to obtain a high contact ratio leads to a longer line of action and, consequently, a larger sliding velocity near the tooth tip and root regions. Since the flash temperature is approximately proportional to the sliding velocity and the local load, HCR spur gears are more prone to scuffing when operating under high speed and high load conditions.
Scuffing is a severe adhesive wear mechanism that occurs when the lubricant film breaks down due to excessive contact temperature. The instantaneous contact temperature of spur gears can be estimated using the flash temperature theory originally proposed by Block. This approach divides the tooth surface temperature into two components: the bulk (or body) temperature, which is relatively uniform across the tooth, and the flash temperature, which is the transient local temperature rise caused by frictional heating at the contact zone. For HCR spur gears, the flash temperature calculation is more complicated than for NCR gears because the load sharing among three tooth pairs changes continuously along the mesh cycle, and the geometry of the tooth flanks produces a non-linear variation of sliding velocity and curvature radius.
To mitigate the scuffing risk, tooth profile modification is commonly adopted in industry. The selection of the modification amount, modification length, and modification curve is critical. In the context of HCR spur gears, the modification can not only reduce the impact at the entry and exit of mesh but also reshape the load distribution among the simultaneously engaged teeth. Consequently, the contact temperature can be lowered and the scuffing load capacity improved. In this thesis, I focus on the following aspects:
- Analysis of load sharing characteristics of HCR spur gears considering tooth elasticity.
- Theoretical calculation of tooth surface contact temperature using the flash temperature method.
- Optimal tooth profile modification design to reduce the maximum contact temperature.
- Experimental validation through gear scuffing tests with embedded thermistors.
2. Design Parameters of HCR Spur Gear Pairs
In this study, I take an external NCR spur gear pair as the baseline and adjust its geometric parameters to achieve a high contact ratio. The baseline parameters are listed in Table 1.
| Parameter | Symbol | Value |
|---|---|---|
| Tooth number of pinion / gear | z₁ / z₂ | 25 / 32 |
| Addendum coefficient | ha* | 1.0 |
| Module | m | 3.25 mm |
| Clearance coefficient | c* | 0.25 |
| Profile shift coefficient | x₁ / x₂ | 0 / 0 |
| Pressure angle | α | 20° |
| Contact ratio | ε | 1.64 |
The contact ratio of a spur gear pair can be calculated from the geometric parameters using the equation:
$$ \varepsilon = \frac{\sqrt{r_{a1}^2 – r_{b1}^2} + \sqrt{r_{a2}^2 – r_{b2}^2} – a’ \sin\alpha’}{\pi m \cos\alpha} $$
where ra1, ra2 are the addendum circle radii, rb1, rb2 are the base circle radii, a’ is the operating center distance, α’ is the operating pressure angle, and α is the standard pressure angle. By increasing the addendum coefficient and slightly adjusting the profile shift, I obtain an HCR spur gear pair with a contact ratio of 2.2. The final parameters are given in Table 2.
| Parameter | Symbol | Value |
|---|---|---|
| Tooth number of pinion / gear | z₁ / z₂ | 25 / 32 |
| Addendum coefficient | ha* | 1.32 |
| Module | m | 3.25 mm |
| Clearance coefficient | c* | 0.25 |
| Profile shift coefficient | x₁ / x₂ | -0.14 / -0.19 |
| Pressure angle | α | 20° |
| Contact ratio | ε | 2.2 |
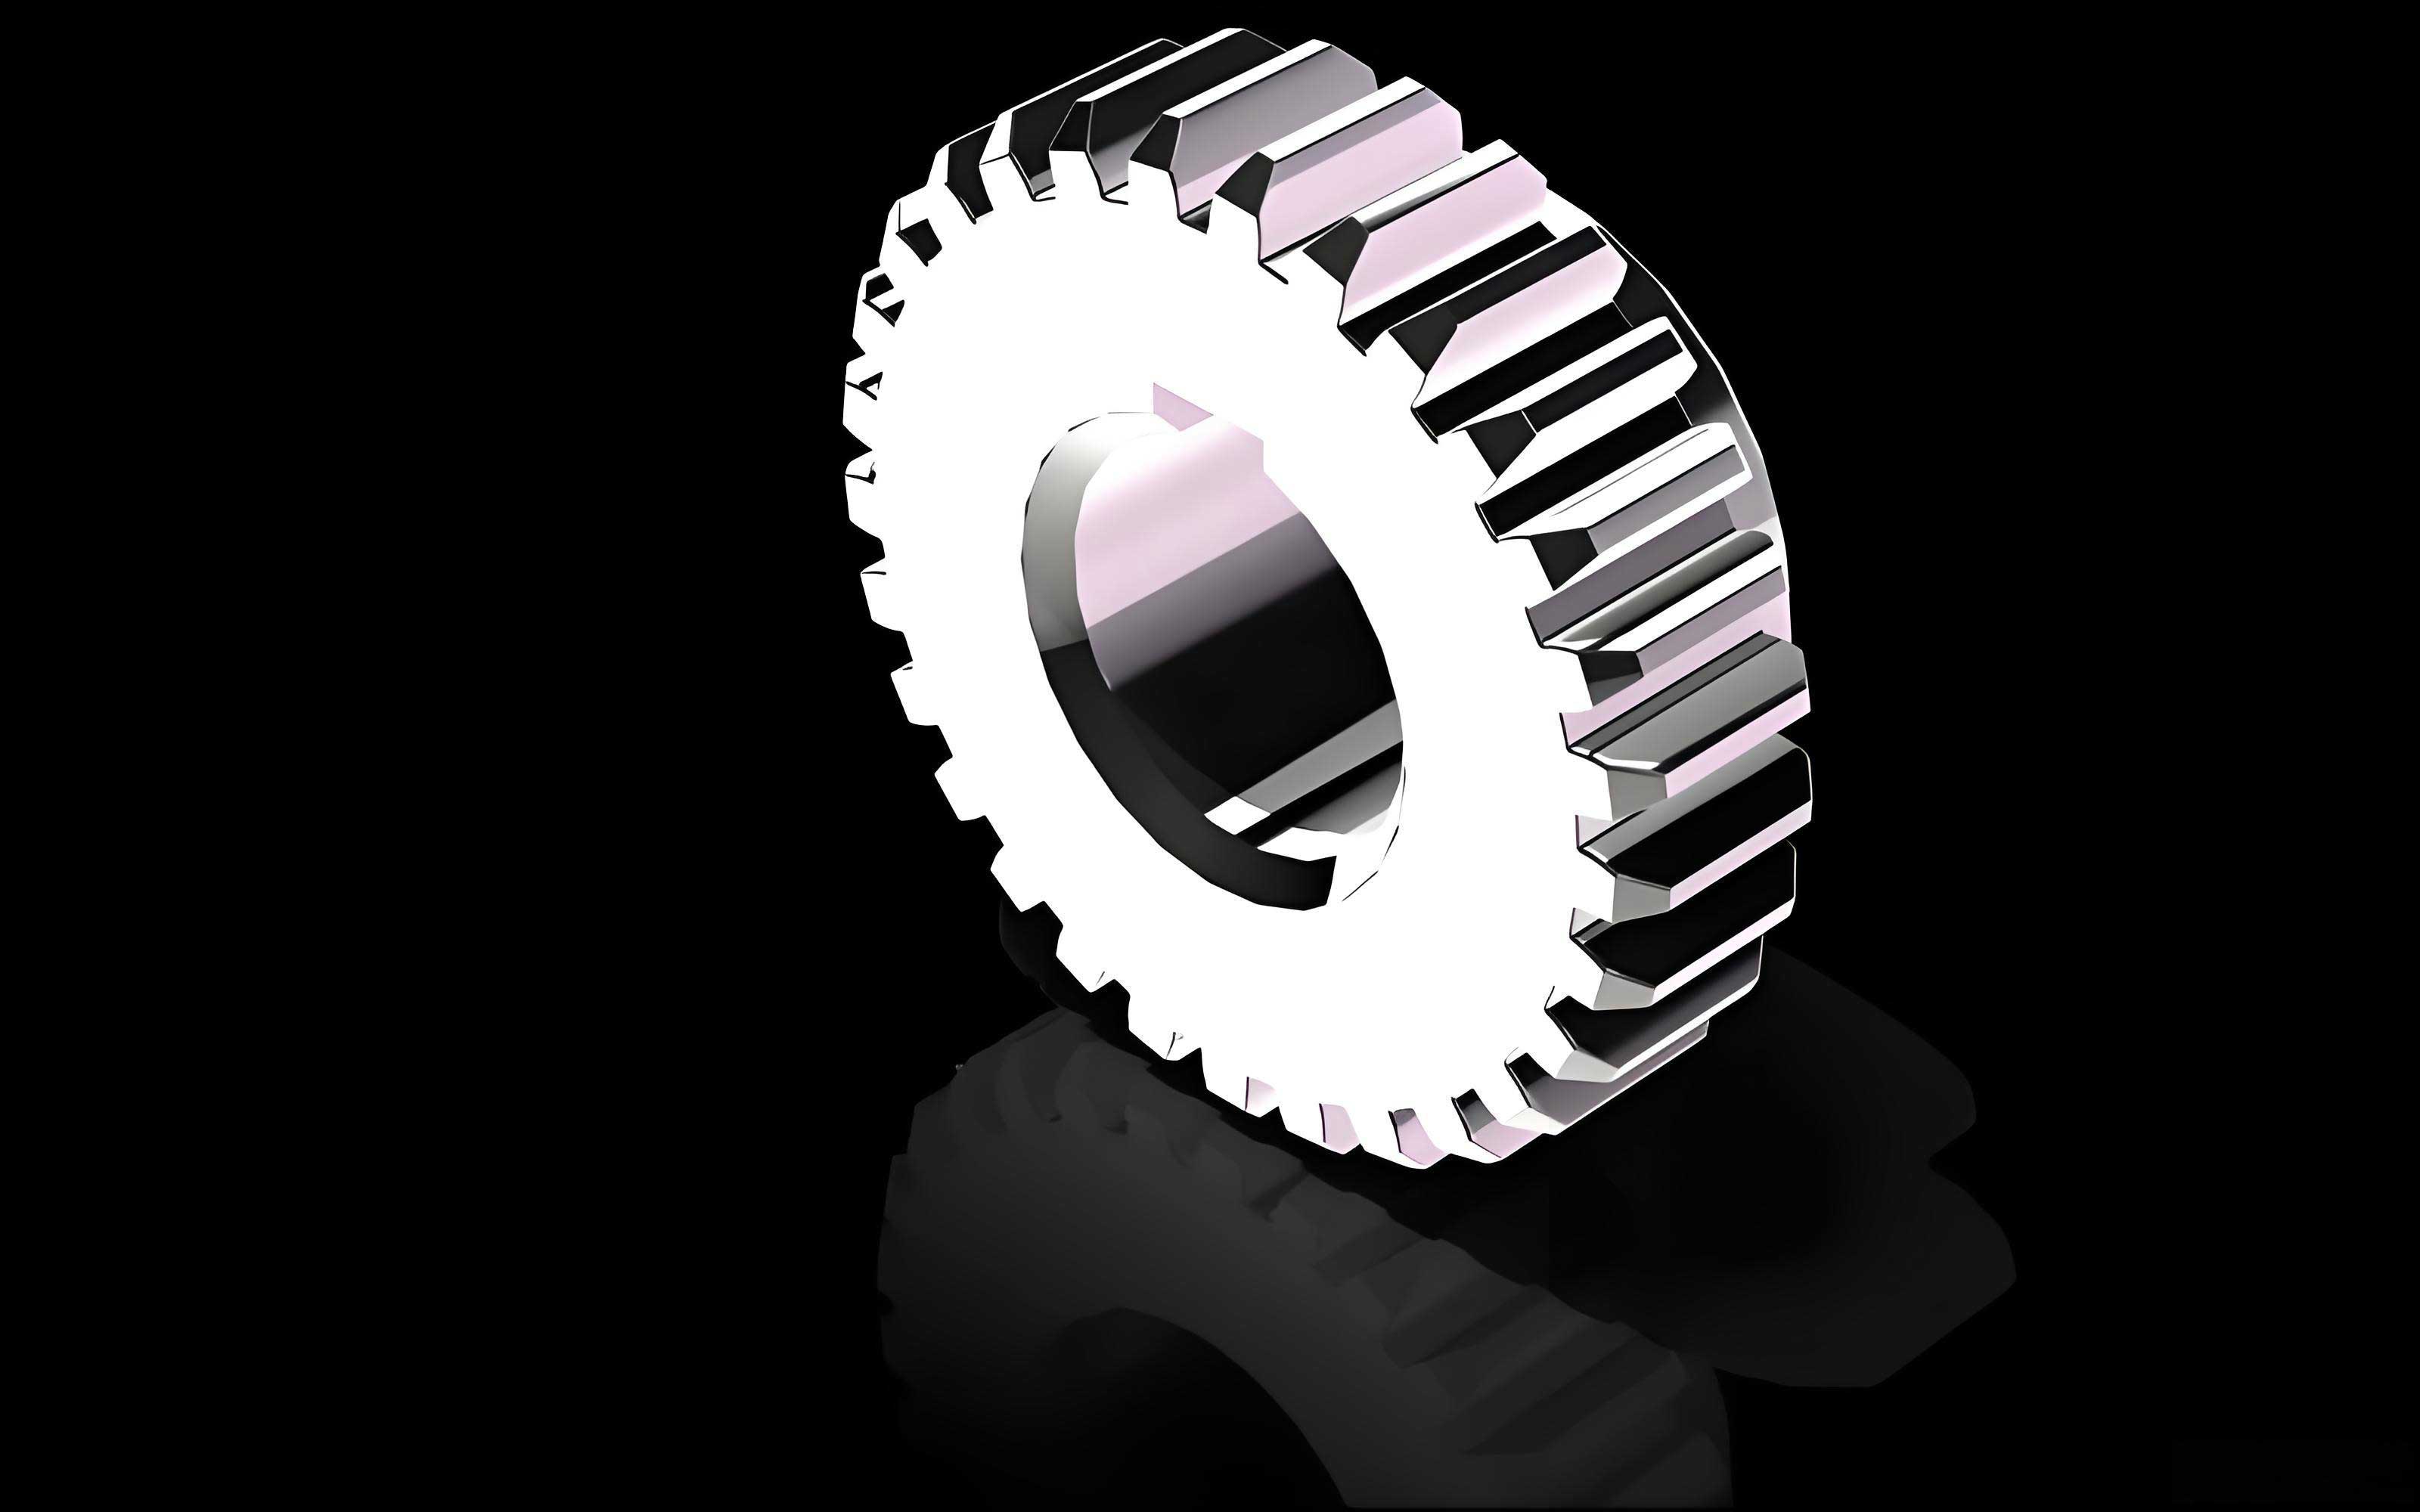
Figure 1 shows a typical HCR spur gear pair used in the experiments.
3. Load Sharing Analysis of HCR Spur Gears
3.1 Tooth Deformation and Single Tooth Stiffness
In order to determine the actual load carried by each tooth pair during meshing, it is necessary to calculate the tooth deflection and stiffness. I model a gear tooth as a variable cross-section cantilever beam and use the material mechanics approach. The total deformation of a gear tooth at the contact point j can be expressed as:
$$ \delta_{\Sigma j} = \delta_{b} + \delta_{s} + \delta_{p} + \delta_{g} + \delta_{h} $$
where δb is the bending deformation, δs is the shear deformation, δp is the compression deformation, δg is the foundation (base) deformation, and δh is the local Hertzian contact deformation. Each component is calculated by integrating over the discretized tooth cross-sections. For the bending deformation, the formula is:
$$ \delta_{bj} = \sum_{i=j}^{k} \frac{W_j}{E_e I_i} \cos\beta_j \left[ \frac{L_i^3}{3}\cos\beta_j + L_i^2 S_{ij} \cos\beta_j + \frac{L_i^2 Y_j^2}{2} \cos\beta_j – \left( \frac{L_i^2 Y_j^2}{2} \sin\beta_j + L_i Y_{ij} S_{ij} \sin\beta_j \right) \right] $$
where Ee is the effective elastic modulus, Ii is the moment of inertia of the i-th section, Li is the thickness of the i-th section, Sij is the horizontal distance between the load point and the i-th section, Yj is the half-tooth thickness at the load point, and βj is the angle between the load vector and the vertical axis. The shear deformation is:
$$ \delta_{sj} = \sum_{i=j}^{k} \frac{12 W_j L_i (\cos\beta_j)^2 (1+\nu)}{5 E_e A_i} $$
and the compression deformation is:
$$ \delta_{pj} = \sum_{i=j}^{k} \frac{W_j L_i}{E_e A_i} (\sin\beta_j)^2 $$
The foundation deformation is approximated by:
$$ \delta_{gj} = \frac{W_j (\cos\beta_j)^2}{B E_e} \left[ 5.306 \left( \frac{L_f}{2 Y_M} \right)^2 + 2 \gamma_v \left( \frac{L_f}{2 Y_M} \right) + 1.534 \left( 1 + \frac{0.4167 \tan\beta_j}{1+\nu} \right) \right] $$
where Lf is the distance from the load point to the root transition point, YM is the half-tooth thickness at the root, and γv is a width factor. Finally, the Hertzian contact deformation is:
$$ \delta_{hj} = \frac{2 \left( \frac{1-\nu_1^2}{E_1} + \frac{1-\nu_2^2}{E_2} \right) W_j \rho_{2j}}{\pi B (\rho_{1j}+\rho_{2j})} $$
where ρ1j and ρ2j are the radii of curvature of the two mating tooth surfaces at the contact point. The single tooth stiffness is then:
$$ C_j = \frac{W_j}{\delta_{\Sigma j}} $$
Using the parameters of the HCR gear pair, the tooth deformation and stiffness along the mesh cycle are calculated and shown in Figure 2. The stiffness varies significantly along the line of action, which directly affects the load sharing among simultaneously engaged teeth.
3.2 Mesh Stiffness of Tooth Pairs
For a spur gear pair, the mesh stiffness of a tooth pair is obtained by considering the series compliance of the two teeth in contact. For example, for tooth pair AD (pinion tooth A meshing with gear tooth D), the mesh stiffness is:
$$ C_{AD} = \frac{C_A C_D}{C_A + C_D} $$
Similarly, for tooth pairs BE and CF:
$$ C_{BE} = \frac{C_B C_E}{C_B + C_E}, \qquad C_{CF} = \frac{C_C C_F}{C_C + C_F} $$
During two-pair contact, the total applied tangential load Ft is shared by two pairs, while during three-pair contact, three pairs share the load. The load sharing ratio of each tooth pair is defined as the percentage of the total load carried by that pair.
3.3 Load Sharing Model with Manufacturing Errors
In practice, manufacturing errors such as base pitch deviation fpb cause unequal deformation among simultaneously engaged tooth pairs. I model the gear teeth as elastic elements connected in parallel. For two-pair contact, the load equilibrium and deformation compatibility give:
$$ F_{AD} = \frac{C_{AD}}{C_{AD}+C_{BE}} \left( F_t + f_{pb} C_{BE} \right) $$
$$ F_{BE} = \frac{C_{BE}}{C_{AD}+C_{BE}} \left( F_t – f_{pb} C_{AD} \right) $$
For three-pair contact, the equations become:
$$ F_{AD} = \frac{C_{AD} \left[ F_t + (C_{BE}+C_{CF}) f_{pb1} + C_{CF} f_{pb2} \right]}{C_{AD}+C_{BE}+C_{CF}} $$
$$ F_{BE} = \frac{C_{BE} \left[ F_t – C_{AD} f_{pb1} + C_{CF} f_{pb2} \right]}{C_{AD}+C_{BE}+C_{CF}} $$
$$ F_{CF} = \frac{C_{CF} \left[ F_t – C_{AD} f_{pb1} – (C_{AD}+C_{BE}) f_{pb2} \right]}{C_{AD}+C_{BE}+C_{CF}} $$
These formulas allow me to evaluate the influence of base pitch errors on the load distribution. Figure 3 shows the load sharing ratio along the line of action for the HCR gear with different base pitch deviations. The results indicate that a positive base pitch deviation increases the load carried by the first engaging pair and decreases the load on the later pairs. This effect is almost linear within the examined range.
3.4 Effect of Geometric Parameters on Load Sharing
Based on the load sharing model, I systematically study the influence of the addendum coefficient, pressure angle, tooth number, profile shift coefficient, and base pitch error on the maximum load sharing ratio. The parameters are varied within the ranges listed in Table 3. The maximum load sharing ratio is the highest instantaneous load percentage experienced by any single tooth during the mesh cycle.
| Parameter | Range |
|---|---|
| Addendum coefficient ha* | 1.2 – 1.4 |
| Pressure angle α (°) | 14 – 22 |
| Tooth number of pinion z₁ | 29 – 300 |
| Profile shift coefficient x₁ (x₂) | -0.5 – 0.2 |
| Base pitch error fpb (μm) | 0 – 5 |
Figure 4 presents the maximum load sharing ratio as a function of the addendum coefficient. When ha* increases from 1.25 to 1.4, the maximum load sharing ratio drops from 60.45% to 57.88%, a reduction of about 4.3%. This is because a larger addendum lengthens the line of action and increases the time spent in three-pair contact, thus reducing the peak load on any single tooth.
Figure 5 shows the effect of the pressure angle. As α increases from 14° to 21.45° (still in the HCR range), the maximum load sharing ratio rises from 53.4% to 61.7%, an increase of about 13.5%. A larger pressure angle shortens the contact path and reduces the contact ratio, so the load sharing becomes less favorable.
The tooth number effect is depicted in Figure 6. Increasing the pinion tooth number from 29 to 300 causes the maximum load sharing ratio to decrease from 59.56% to 56.00%, a reduction of about 6.0%. The influence is relatively modest and tends to saturate for large tooth numbers.
Figure 7 illustrates the effect of the profile shift coefficient. When x₁ changes from -0.5 to 0.11, the maximum load sharing ratio increases from 52.40% to 61.19%, an increase of about 14.4%. A more positive profile shift reduces the contact ratio and makes the load distribution less uniform.
Finally, Figure 8 shows that when the base pitch error increases from 0 to 5×10⁻⁶ m, the maximum load sharing ratio grows from 57.84% to 62.49%, an increase of about 8.0%. The load sharing at the first point of contact is particularly sensitive to the base pitch error, with a variation of 27% over the studied range.
From the above analysis, it is clear that the load sharing of HCR spur gears can be effectively altered by adjusting the tooth geometry. For anti-scuffing design, one should choose parameters that reduce the maximum load and avoid abrupt load changes at the mesh entry and exit.
4. Contact Temperature Calculation Using the Flash Temperature Method
4.1 Kinematics in Γ-Coordinate System
To facilitate the temperature analysis, I introduce a dimensionless coordinate Γ defined along the line of action, with the pitch point P as the origin. The coordinate of an arbitrary point y is:
$$ \Gamma_y = \frac{N_1 y – N_1 P}{N_1 P} = \frac{\tan \alpha_y}{\tan \alpha’} – 1 $$
where αy is the pressure angle at the point y, and α’ is the operating pressure angle. The start of active profile on the pinion (first contact point) has a negative Γ, while the end of active profile has a positive Γ. The relative sliding velocity between the two tooth surfaces at any mesh point can be expressed as:
$$ v_s = v_{t1} – v_{t2} = \omega_1 \rho_1 – \omega_2 \rho_2 $$
where ω₁ and ω₂ are the angular speeds, and ρ₁, ρ₂ are the radii of curvature of the two teeth at the contact point.
4.2 Bulk Temperature
The tooth surface contact temperature is composed of the bulk temperature θM and the flash temperature θfl:
$$ \theta_B = \theta_M + \theta_{fl} $$
The bulk temperature is estimated from empirical equations:
$$ \theta_M = \theta_{oil} + 0.47 X_S X_{mp} \theta_{flm} $$
where θoil is the oil temperature, XS is the lubrication factor (XS=1 for oil bath), Xmp is the meshing factor (Xmp=1 for a pair with a single pinion), and θflm is the mean flash temperature along the mesh cycle.
4.3 Flash Temperature Formula
For line-contact spur gears, the flash temperature at a contact point can be calculated using the following formula based on Block’s theory:
$$ \theta_{fl} = 2.52 \cdot \frac{\mu_m \cdot X_M}{50} \cdot X_J \cdot \sqrt{\left( X_\Gamma \cdot w_{Bt} \right)^3} \cdot \sqrt[4]{\frac{n_1}{60}} \cdot \frac{\left| \sqrt{\rho_{y1}} – \sqrt{\rho_{y2}/u} \right|}{\sqrt[4]{\rho_{yrel}}} $$
where μm is the instantaneous friction coefficient, XM is the thermal elastic coefficient, XJ is the tooth entry impact factor, XΓ is the load sharing factor, wBt is the nominal tangential load per unit face width, n1 is the pinion speed, u is the gear ratio, ρy1, ρy2 are the curvature radii at the contact point, and ρyrel is the equivalent curvature radius:
$$ \rho_{yrel} = \frac{\rho_{y1} \cdot \rho_{y2}}{\rho_{y1} + \rho_{y2}} $$
The friction coefficient μm is also position-dependent and is calculated by:
$$ \mu_m = 0.06 \left( \frac{w_{Bt}}{v_{g\Sigma} \rho_{yrel}} \right)^{0.2} X_L X_R $$
where vgΣ is the sum of tangential speeds of the two tooth surfaces, XL is the lubricant factor, and XR is the roughness factor.
4.4 Distribution of Correction Factors Along the Line of Action
Using the parameters of the NCR and HCR gear pairs given in Tables 1 and 2, I calculate the variations of the friction coefficient, load sharing factor, and curvature-related factor along the line of action. The results are summarized in Figures 9 and 10.
The friction coefficient μm decreases from the tooth root to the tooth tip on the pinion, with step changes at the transitions between two-pair and three-pair contact zones. For the HCR gear, the friction coefficient is generally higher near the tooth tip due to the larger sliding velocity.
The load sharing factor XΓ is directly obtained from the load sharing analysis in Section 3. For the HCR gear, XΓ varies between about 0.25 and 0.60, with sharp changes at the boundaries between two-pair and three-pair contact.
The curvature-related polynomial term is defined as:
$$ F_\rho = \frac{\left| \sqrt{\rho_{y1}} – \sqrt{\rho_{y2}/u} \right|}{\sqrt[4]{\rho_{yrel}}} $$
This term is zero at the pitch point, where the sliding velocity is zero, and increases towards both the tooth root and tooth tip. For HCR gears, the longer line of action causes Fρ to reach higher values than for NCR gears.
4.5 Temperature Distribution Along the Line of Action
Substituting the calculated factors into the flash temperature formula, I obtain the contact temperature distribution for both NCR and HCR spur gears. The material properties used in the calculation are listed in Table 4.
| Material | Heat treatment | Effective hardened depth | Surface hardness (HRC) | Core hardness (HRC) | Accuracy grade |
|---|---|---|---|---|---|
| 20CrMnTi | Carburized and quenched | 0.6 – 0.9 mm | 58 – 62 | 33 – 42 | Class 5 (GB/T 10095) |
Figure 11 shows the calculated contact temperature distribution for the NCR gear (ε=1.64) and the HCR gear (ε=2.2). The following observations can be made:
- The minimum temperature occurs at the pitch point (Γ=0) for both gear types, because the relative sliding velocity is zero there.
- The maximum temperature for the NCR gear occurs at the first point of contact (tooth root of the pinion). Although the load is only about 40% of the total tangential load, the sliding velocity is the highest, and there is an additional mesh-entry impact load.
- For the HCR gear, the maximum temperature also occurs at the first point of contact. The load there is about 27% of the total load, but the sliding velocity is even larger than in the NCR gear due to the larger addendum. The calculated maximum contact temperature is 208.8 °C for the HCR gear, compared with 196.7 °C for the NCR gear, representing a 6.2% increase.
These results confirm that HCR spur gears have a greater scuffing risk than NCR spur gears under identical operating conditions. Therefore, tooth profile modification is essential to reduce the high flash temperatures at the mesh entry and exit zones.
5. Tooth Profile Modification for Scuffing Resistance
5.1 Principle of Profile Modification
Tooth profile modification involves removing a small amount of material from the involute profile near the tooth tip (and sometimes near the tooth root) so that the modified tooth enters and leaves mesh with a gradually increasing or decreasing load, instead of experiencing an abrupt load discontinuity. The profile modification thus compensates for tooth elastic deformation and manufacturing errors, and also helps to reduce the dynamic impact.
In this work, I modify only the tooth tips of both the pinion and the gear, while the tooth roots remain unchanged to preserve bending strength. This is a common practice for spur gears operating at moderate to high speeds.
5.2 Calculation of Maximum Tip Relief
The maximum tip relief amount Δmax is determined such that it compensates for the combined tooth deformation and manufacturing error:
$$ \Delta_{max} = \delta + f_m $$
where δ is the total elastic deformation at the tooth tip contact position, and fm is the manufacturing error given by:
$$ f_m = f_{pb} + \frac{1}{3} f_f $$
where fpb is the base pitch error and ff is the tooth profile tolerance. For class 5 gears with module m=3.25 mm and pitch diameter between 125 mm and 400 mm, the standard values are fpb = 8 μm and ff = 8 μm (from ISO/GB standards). The calculated tip relief amounts for the NCR and HCR gear pairs are shown in Table 5.
| Gear type | Tip relief for elastic deformation only (μm) | Optimal tip relief including manufacturing error (μm) |
|---|---|---|
| NCR pinion | 24.4 | 31.4 |
| NCR gear | 24.3 | 31.3 |
| HCR pinion | 34.0 | 41.0 |
| HCR gear | 33.7 | 40.7 |
5.3 Length of Modification
For NCR spur gears, the standard modification length is the length of the double-pair contact zone near the tooth tip:
$$ L_\Delta = p_b (\varepsilon – 1) $$
where pb is the base pitch. For HCR spur gears, to effectively reduce the temperature at the first and last points of contact, I choose the modification length to cover the entire three-pair plus the adjacent two-pair contact zone near the tooth tip:
$$ L_\Delta = p_b $$
This longer modification smooths the load transition from zero at the tip to the full load at the interior of the mesh.
5.4 Modification Curve Selection
The modification curve defines how the relief amount varies along the modified profile. A general power-law curve is written as:
$$ \Delta(x) = \Delta_{max} \left( \frac{x}{L_\Delta} \right)^\beta $$
where x is the distance measured along the line of action from the start of modification, and β is the power exponent. Common choices are:
- β = 1.0 (linear modification): simple but leaves a sharp corner at the junction with the involute.
- β = 1.5 (Walker curve): smooth transition, good for high-speed gears.
- β = 1.22 (recommended by some Japanese researchers): found optimal for many applications.
- Parabolic modification: Δ(x) = Δmax [0.44 (x/LΔ) + 0.56 (x/LΔ)²]
- Sine modification: Δ(x) = Δmax sin(πx / 2LΔ)
For the present study, I choose the linear modification curve (β=1) because it is simple to machine and provides a clear trend in the temperature analysis. The modified tooth profile can be represented by subtracting Δ(x) from the original involute.
5.5 Effect of Modification on Load Sharing
After modifying the tooth tips, the load sharing among the meshing tooth pairs changes. Using the modified tooth geometry in the elastic model, I calculate the load sharing ratio for different amounts of tip relief. Figure 12 shows the load sharing curves for the HCR gear with three modification levels: no modification, modification without manufacturing error compensation (Δmax=34 μm), and optimal modification (Δmax=41 μm).
As the tip relief increases, the load at the first point of contact gradually approaches zero. The overall load distribution becomes more centered around the middle of the mesh cycle. However, the maximum load carried by the middle tooth pair in the three-pair zone increases because the tip-relieved teeth contribute less near the ends. This should be carefully checked against the bending strength safety factor.
5.6 Effect of Modification on Contact Temperature
A major objective of this thesis is to evaluate whether tooth profile modification can effectively lower the maximum contact temperature of HCR spur gears. I recompute the flash temperature distribution using the modified load sharing factors. Figure 13 presents the contact temperature distributions for the NCR gear, and Figure 14 for the HCR gear, both with and without modification.
The results are summarized in Table 6.
| Gear type | No modification (°C) | Partial modification (°C) | Optimal modification (°C) | Reduction with optimal modification |
|---|---|---|---|---|
| NCR spur gear | 196.69 | 181.89 | 171.45 | 12.83% |
| HCR spur gear | 208.80 | 181.89 | 173.53 | 16.89% |
For the NCR gear, the optimal modification reduces the maximum temperature from 196.69 °C to 171.45 °C, a decrease of 12.83%. For the HCR gear, the reduction is from 208.80 °C to 173.53 °C, a decrease of 16.89%. The temperature peak moves away from the tooth root/tip towards the pitch point, and the tooth root and tip temperatures are reduced to approximately the bulk temperature.
These findings demonstrate that a properly designed tip relief can significantly improve the scuffing resistance of HCR spur gears. The modification reduces frictional heat generation near the mesh entry and exit, where the sliding velocity and flash temperature are the highest.
6. Experimental Validation
6.1 Test Rig and Measurement Method
To validate the theoretical calculations, I conducted gear scuffing tests using a CL-100 gear test machine (similar to the FZG rig). The closed-loop power recirculation system is shown in Figure 15. The test gears are lubricated by oil bath using aviation turbine oil (AeroShell Turbine Oil 555). The oil temperature is controlled at 90±3 °C for load stages above the third level. The pinion speed is set to 3000 rpm.
For temperature measurement, I used miniature thermistors installed in small holes drilled from the tooth end face to a distance of 0.5 mm from the tooth surface. The thermistors rotate with the gear, and their signals are transmitted to a wireless data recorder mounted on the shaft flange. The recorder sends the data to a computer in real time. This method avoids the signal loss associated with slip rings and is more accurate than infrared thermography for rotating gears.
The thermistor locations are chosen at the points where the theoretical temperature is expected to be highest:
- For the NCR gear: one near the tooth tip (ON1) and one near the tooth root at the single-double contact transition (ON2).
- For the HCR gear: one near the tooth tip at the three-pair contact boundary (OH1), one at the double-pair contact boundary (OH2), and one near the tooth root at the three-pair contact boundary (OH3).
6.2 Test Procedure
The test follows the standard gear scuffing load capacity test procedure (GB/T 13672-1992). The gears are run at increasing load stages, each for 15 minutes. After each stage, the test is stopped and the tooth surfaces are visually inspected for scuffing. The load stages are defined by the nominal tangential force or torque applied to the pinion. The actual loads for the modified and unmodified gears are given in Table 7.
| Load stage | Nominal torque T₁ (N·m) | Normal tooth force Fn (N) |
|---|---|---|
| 1 | 4.0 | 100 |
| 2 | 16.1 | 400 |
| 3 | 40.8 | 1000 |
| 4 | 72.3 | 1800 |
| 5 | 112.0 | 2800 |
| 6 | 160.8 | 4000 |
| 7 | 220.0 | 5500 |
6.3 Experimental Results and Discussion
Figure 16 shows the measured temperatures at the thermistor locations for the unmodified and modified NCR gears at load stage 5. The temperature initially rises sharply and then stabilizes to a steady-state value. The unmodified gear shows temperatures of about 165.5 °C at ON1 and 171.7 °C at ON2, while the theoretical values at these points are 173.5 °C and 182.2 °C, respectively. The differences are 4.8% and 6.1%, which is acceptable for engineering calculations. After modification, the measured temperatures drop by 20.1 °C at ON1 and 21.4 °C at ON2, consistent with the theoretical predictions.
Figure 17 presents the measured temperatures for the HCR gear at the same load stage. For the unmodified gear, the temperatures at OH1, OH2, and OH3 are 161.4 °C, 145.3 °C, and 170.2 °C, respectively. The theoretical values are 179.9 °C, 149.2 °C, and 180.9 °C. The maximum deviation is about 11.5%, which is slightly higher than for the NCR gear, mainly because the three-pair contact zone introduces more complex load sharing and friction conditions. Nevertheless, the theoretical calculations are conservative since they overestimate the measured temperatures. For the modified HCR gear, the temperatures at OH1 and OH3 decrease significantly (by 29.8 °C and 18.7 °C), while the temperature at OH2 increases slightly (by 3.5 °C), which matches the theoretical trend because the modification shifts the load away from the mesh entry/exit.
The experimental results confirm the following conclusions:
- The flash temperature method with the modified load sharing model provides a reasonably accurate prediction of tooth surface temperatures for both NCR and HCR spur gears.
- Tooth profile modification effectively reduces the maximum contact temperature and shifts the hot spot away from the tooth root and tip.
- The anti-scuffing load capacity of HCR spur gears can be significantly improved by optimizing the tip relief amount.
7. Conclusions
In this thesis, I have presented a comprehensive study on the modification and scuffing of high contact ratio spur gears considering tooth elastic deformation. The main conclusions are summarized below:
1. The load sharing among simultaneously engaged teeth of HCR spur gears is strongly influenced by the tooth geometry parameters. Increasing the addendum coefficient from 1.25 to 1.4 reduces the maximum load sharing ratio by about 4.3%. Decreasing the pressure angle from 21.45° to 14° reduces it by about 13.5%. Increasing the tooth number from 29 to 300 reduces it by about 6.0%. Decreasing the profile shift coefficient from 0.11 to -0.5 reduces it by about 14.4%. Increasing the base pitch error from 0 to 5 μm increases the maximum load sharing ratio by about 8.0%. The load at the first mesh point is almost unchanged by the geometric parameters but is very sensitive to the base pitch error.
2. The flash temperature distribution of HCR spur gears has its minimum at the pitch point and its maximum at the first point of contact (tooth root of the pinion). The maximum contact temperature of the HCR gear is 208.8 °C, which is about 12.1 °C higher than that of the NCR gear, mainly due to the increased sliding velocity resulting from the larger addendum.
3. An optimal tooth tip relief that compensates for the elastic deformation and manufacturing error can reduce the maximum contact temperature by 12.83% for the NCR gear and 16.89% for the HCR gear. After modification, the highest temperature moves towards the pitch point, and the tooth root and tip temperatures are reduced to nearly the bulk temperature.
4. Gear scuffing experiments with embedded thermistors validate the theoretical temperature calculation with acceptable accuracy. The measured temperatures are slightly lower than the theoretical values, confirming that the flash temperature method is conservative but reliable for scuffing risk assessment of spur gears.
This work provides a useful engineering tool for the design of high contact ratio spur gears with improved scuffing resistance. Future research should extend the analysis to include the effects of tooth flank roughness, dynamic load, and thermal deformation, as well as the influence of lubrication properties on the flash temperature.