
Spur gears are essential components in numerous mechanical transmission systems, particularly in automotive and heavy machinery applications. Their surface integrity directly influences transmission accuracy, efficiency, and fatigue life. Among various gear materials, 20CrMnTi steel is widely employed due to its high impact toughness, good wear resistance, and excellent hardenability. This study focuses on the surface quality of spur gears produced by hobbing and subsequently strengthened by shot peening. The main objectives are to investigate the effects of cutting parameters on surface roughness, hardness, and cutting power during gear hobbing, and to evaluate the influence of shot peening parameters on residual stress distribution, equivalent plastic strain, and surface roughness using combined experimental and numerical approaches.
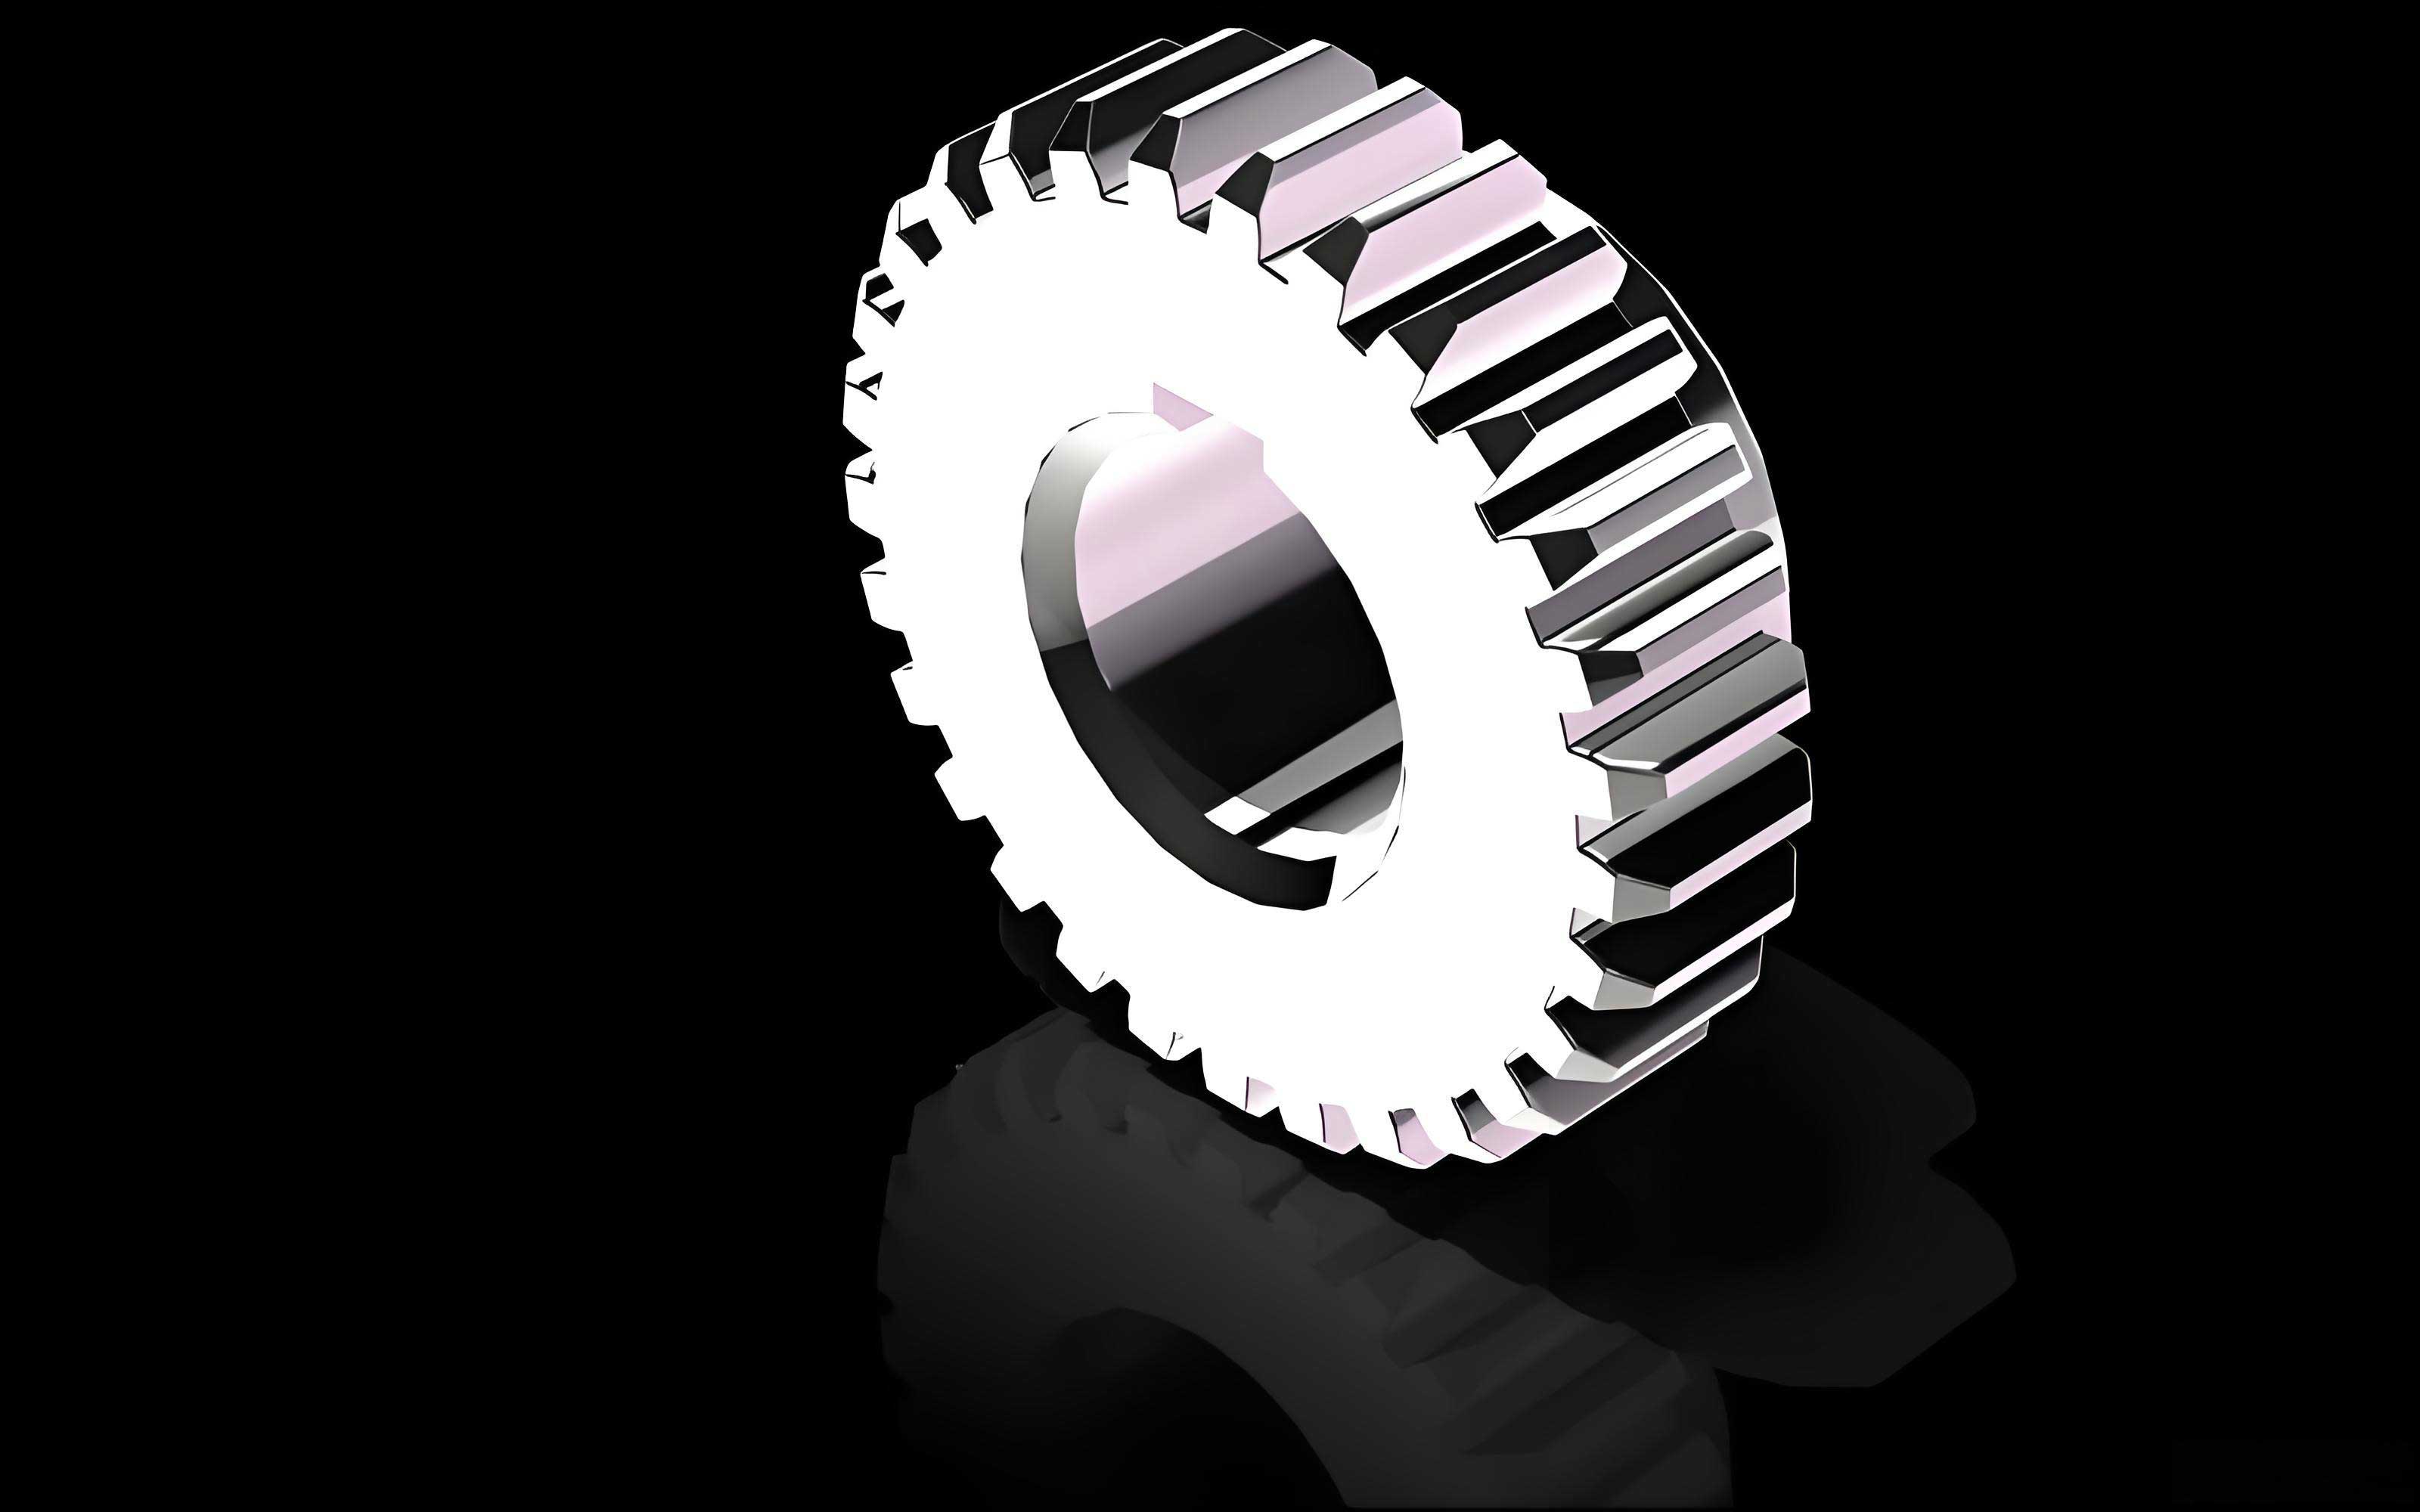
The research integrates actual gear hobbing experiments on a HI-008 gear hobbing machine with finite element simulations using DEFORM and ABAQUS. The hobbing experiments were performed on 20CrMnTi steel blanks with a modulus of 3 mm, and variations in hob rotational speed and axial feed rate were investigated. Power consumption was measured using a clamp ammeter and a multimeter, while surface roughness and three-dimensional topography were characterized using a surface profiler and an ultra-depth-of-field microscope. Microhardness was measured with a Vickers indenter. For the hobbing simulation, a simplified hob tooth and tooth slot model were established in CREO and imported into DEFORM to analyze chip formation, cutting forces, and equivalent stress. For shot peening, single-shot and random multi-shot models were developed in ABAQUS with Python scripting. Randomly distributed shots were generated to achieve various coverage levels, and the effects of shot velocity, shot diameter, and coverage on residual stress, PEEQ, and surface roughness were analyzed. A secondary shot peening model was also constructed to study the effect of double peening. Finally, shot peening experiments were carried out to validate the simulation results.
1. Experimental Study on Hobbing of Spur Gears
1.1 Hobbing Principle and Experimental Setup
Gear hobbing is a generating process where a rotating hob progressively cuts the tooth spaces of a gear blank. The hob and the workpiece rotate in a fixed ratio like a worm gear and a worm wheel, while the hob feeds axially along the blank. In our experiments, a climb hobbing strategy was adopted, in which the direction of hob rotation is the same as the feed direction. This method improves surface finish and reduces tool wear. The gear blank had 23 teeth, a module of 3 mm, a pressure angle of 20°, and a tooth width of 30 mm. The hob was made of W6542 high-speed steel with a hardness of HRC 63, a left-hand helix, and a single start. The workpiece material used for the spur gears was 20CrMnTi steel, whose chemical composition and physical properties are listed in Tables 1 and 2, respectively.
| Element | C | Si | Mn | Cr | S | P | Ni | Ti |
|---|---|---|---|---|---|---|---|---|
| Content | 0.18 | 0.28 | 0.93 | 1.12 | 0.007 | 0.010 | 0.0045 | 0.0650 |
| Property | Value |
|---|---|
| Density (kg/m³) | 7800 |
| Elastic modulus (MPa) | 200000 |
| Thermal expansion coefficient (1/°C) | 5×10⁻⁶ |
| Poisson’s ratio | 0.3 |
| Hardness (HB) | ≤217 |
The hobbing trials were conducted using a single-factor method. The hob rotational speed was varied while the feed was kept constant, and vice versa. The processing parameters are listed in Table 3.
| Set | Hob speed (r/min) | Feed rate (mm/r) |
|---|---|---|
| 1 | 165 | 0.47, 0.83, 1.2 |
| 2 | 165, 204, 275 | 1.2 |
The machine tool used was a HI-008 gear hobbing machine with a maximum machining diameter of 500 mm and a maximum module of 6 mm. The full tooth depth was 6.75 mm, and a three-pass cutting strategy was applied: the first two passes used larger depths (3 mm and 2 mm) for roughing, while the third pass used 1.75 mm for finishing to obtain a better surface finish.
1.2 Measurement Methods
To measure the power consumption of the hobbing machine, we used a clamp ammeter (range 60 A–600 A) to measure the current and a multimeter (range 2 V–600 V) to measure the voltage. Each measurement was repeated three times and averaged. Surface roughness \(Ra\) was measured using a 2302A surface profiler with a sampling length of 0.8 mm and an evaluation length of 7 times the cutoff. The three-dimensional surface topography was observed using a PZ-ZC3500A ultra-depth-of-field microscope. For hardness measurement, specimens were sectioned via wire electrical discharge machining, ground, polished, and then indented using an HV-1000A Vickers microhardness tester under a load of 1 kg for 15 s. Three indentations were made on each sample and the average was taken.
1.3 Results and Discussion
1.3.1 Effect of Cutting Parameters on Cutting Power
The power consumption measured during the hobbing process is given in Tables 4 and 5. Table 4 shows the effect of hob speed on power when the feed rate was fixed at 1.2 mm/r, while Table 5 shows the effect of feed rate when the hob speed was fixed at 165 r/min.
| Test no. | Hob speed (r/min) | Feed (mm/r) | Idle power P1 (W) | Cutting power P2 (W) | P2 – P1 (W) |
|---|---|---|---|---|---|
| 1 | 165 | 1.2 | 1878.9 | 1989.5 | 110.6 |
| 2 | 204 | 1.2 | 1958.3 | 2078.4 | 120.1 |
| 3 | 275 | 1.2 | 2070.7 | 2223.3 | 152.6 |
| Test no. | Hob speed (r/min) | Feed (mm/r) | Idle power P1 (W) | Cutting power P2 (W) | P2 – P1 (W) |
|---|---|---|---|---|---|
| 1 | 165 | 0.47 | 1828.3 | 1924.2 | 96.1 |
| 2 | 165 | 0.83 | 1828.3 | 1950.3 | 122.0 |
| 3 | 165 | 1.2 | 1828.3 | 1989.5 | 161.2 |
It can be observed that the idle power increases with increasing hob speed, because the spindle motor must overcome higher rotational inertia. The additional cutting power \(P_2 – P_1\) also rises with feed rate, as the cross-sectional area of the uncut chip increases, leading to higher cutting forces. This agrees with fundamental metal cutting theory.
1.3.2 Effect of Cutting Parameters on Surface Roughness and Topography
Surface roughness measurements are summarized in Tables 6 and 7. The three-dimensional topographies obtained from the ultra-depth-of-field microscope revealed that lower feed rates produced denser cutting marks and lower \(Ra\) values, whereas higher cutting speeds also reduced \(Ra\) because the increased cutting speed tends to reduce built-up edge formation and improves the finish.
| Feed (mm/r) | Surface roughness Ra (μm) |
|---|---|
| 0.47 | 0.392 |
| 0.83 | 0.569 |
| 1.2 | 0.742 |
| Hob speed (r/min) | Surface roughness Ra (μm) |
|---|---|
| 165 | 0.742 |
| 204 | 0.649 |
| 275 | 0.589 |
The experimental results demonstrate that increasing the feed rate worsens the surface quality, while increasing the cutting speed improves it. Therefore, to produce spur gears with good surface integrity and high efficiency, a combination of high hob speed and low feed rate is recommended.
1.3.3 Surface Hardening and Microstructure
Table 8 lists the microhardness of the gear surface after hobbing under different cutting parameters. The base material hardness was measured as 195.6 HV. All machined surfaces exhibited higher hardness than the base material, attributed to work hardening induced by plastic deformation and the phase transformation from ferrite to fine pearlite during cutting. As the feed increased, the surface hardness increased because deeper and more severe plastic deformation occurred. With increasing hob speed, the hardness first increased and then slightly decreased; the peak hardness occurred at 204 r/min, reaching 249.4 HV.
| Hob speed (r/min) | Feed (mm/r) | Microhardness (HV) |
|---|---|---|
| 165 | 0.47 | 233.1 |
| 165 | 0.83 | 238.6 |
| 165 | 1.2 | 243.2 |
| 204 | 1.2 | 249.4 |
| 275 | 1.2 | 244.3 |
Metallographic examination using a SOPTOP ICX4IM optical microscope revealed that the surface and subsurface layers consisted of fine lamellar pearlite (dark) and ferrite (white). The surface layer showed a finer and more uniform pearlite distribution than the core, confirming the occurrence of thermomechanical effects during hobbing.
2. Finite Element Simulation of Spur Gear Hobbing
2.1 Kinematic Relationship between Hob and Workpiece
The relative motion between the hob and the gear blank is complex. Using coordinate transformation theory, we established the relationship between the hob reference frame and the workpiece reference frame. The hob is tilted by its installation angle (equal to its helix angle) to align the hob threads with the gear teeth. The generating motion consists of the hob rotation and the synchronous workpiece rotation, while the hob also translates axially.
2.2 Model Setup and Mesh Generation
To reduce computational cost, a simplified model was adopted. We used a single hob tooth and a single tooth slot of the gear blank. The three-dimensional models were created in CREO and exported as STL files, then imported into DEFORM. The hob tooth was meshed with 30,000 elements, and the tooth slot with 100,000 elements. A mesh window was used to refine the elements near the cutting zone. The workpiece was restrained in all directions, and the hob was given rotational and translational motion according to the cutting parameters.
2.3 Material Constitutive Model and Failure Criterion
The Johnson-Cook (JC) constitutive model was used to describe the flow stress of 20CrMnTi steel. The model is expressed as:
\[
\sigma = [A + B(\varepsilon_p)^n] \left(1 + C \ln \frac{\dot{\varepsilon}_p}{\dot{\varepsilon}_0}\right) \left[1 – \left(\frac{T – T_r}{T_m – T_r}\right)^m\right]
\]
Since the hobbing simulation is often performed at room temperature, the thermal term can be omitted in the simplified version. The JC parameters for 20CrMnTi steel are given in Table 9.
| A (MPa) | B (MPa) | n | C | m |
|---|---|---|---|---|
| 1241 | 622 | 0.6522 | 0.0134 | 1.3 |
To simulate chip separation, the Cockroft-Latham (CL) fracture criterion was used:
\[
\int_0^{\varepsilon_f} \sigma^* \, d\varepsilon = C_{CL}
\]
where \(\varepsilon_f\) is the equivalent plastic strain at fracture, \(\sigma^*\) is the maximum principal stress, and \(C_{CL}\) is a critical damage value. A modified Coulomb friction model was applied at the tool-chip interface with a friction coefficient of 0.6. The simulation parameters matched the experimental ones, as listed in Table 10.
| Set | Hob speed (r/min) | Feed (mm/r) |
|---|---|---|
| 1 | 165 | 0.47, 0.83, 1.2 |
| 2 | 165, 204, 275 | 1.2 |
2.4 Simulation Results
2.4.1 Chip Formation
The simulation revealed that chip formation begins when the hob tip edge contacts the workpiece, generating a curled chip. Subsequently, the side cutting edge engages the workpiece, and the two chip flows converge into the final chip shape. This process is cyclic, consistent with actual hobbing observations.
2.4.2 Cutting Force
Figure 1 (not shown) illustrates the predicted main cutting force over time for different hob speeds and feed rates. The cutting force increased rapidly at the entry of the cut, reached a peak, and then fluctuated due to material inhomogeneity. Increasing the feed rate from 0.47 to 1.2 mm/r increased the average cutting force only slightly, owing to the moderate increase in uncut chip thickness. In contrast, changing the hob speed had a negligible effect on the cutting force magnitude, while a higher speed shortened the cutting time per tooth slot. These trends directly explain the power measurements: the increase in cutting power with feed rate is due to increased cutting force, whereas the increase in idle power with hob speed is primarily associated with spindle rotation.
2.4.3 Equivalent Stress
The equivalent stress distributions under different cutting parameters were quite similar. The stress values quickly reached the material yield strength and then oscillated around a mean value. This indicates that the stress magnitude is mainly governed by the material properties rather than the cutting parameters. The simulation confirmed that high-speed hobbing does not elevate the maximum stress, which is beneficial for reducing tool wear and surface damage.
3. Establishment of Shot Peening Simulation Model
3.1 Single Shot Peening Model
To simulate the shot peening process, we first developed a single-shot finite element model in ABAQUS/Explicit. The target was a rectangular specimen of 20CrMnTi steel with dimensions 2 mm × 2 mm × 1.5 mm. The upper central region (1 mm × 1 mm × 1.5 mm) was designated as the peened area and meshed with fine C3D8R elements of size 0.02 mm, while the remaining area used a coarser mesh (0.16 mm). The shot was modeled as a rigid sphere with a diameter \(d\), meshed with 896 C3D8R elements. A surface-to-surface contact was defined with a friction coefficient of 0.3. The bottom and lateral faces of the target were fully constrained. The shot was assigned an initial velocity along the negative Z direction through a predefined field.
The Johnson-Cook constitutive equation (without thermal term) was employed for the target material:
\[
\sigma = (A + B\varepsilon^n) \left(1 + C \ln \dot{\varepsilon}^*\right)
\]
Parameters \(A\), \(B\), \(n\), and \(C\) are the same as listed in Table 9.
3.2 Single Shot Peening Process and Energy Analysis
The simulation of a single shot with a velocity of 50 m/s and a diameter of 0.4 mm was analyzed. At the beginning of impact, a plastic crater forms on the target surface, and the maximum compressive stress reaches 1583 MPa. During the impact, the stress redistributes and decreases to 1392 MPa, and after rebound, it stabilizes at about 1309 MPa. The kinetic energy of the shot is initially 0.205 mJ. At the maximum impact (about 4.01×10⁻⁷ s), the kinetic energy drops to nearly zero, while the internal energy of the target reaches its maximum. After rebound (about 5.51×10⁻⁷ s), the kinetic energy recovers to about 0.034 mJ, and the internal energy stabilizes at about 0.168 mJ. This energy exchange explains the plastic deformation and residual stress generation.
The crater shape was extracted by measuring the vertical displacement of surface nodes. The crater diameter \(a\) and depth \(h\) are important for coverage calculations. The stress concentration factor \(K_t\) can be estimated from the crater geometry using the expression:
\[
K_t = 1 + 4 \sqrt{\frac{h}{a}}
\]
Simulations with different shot velocities and diameters showed that the crater depth primarily depends on the shot velocity, whereas the crater diameter is more sensitive to the shot diameter. For example, a shot velocity of 40 m/s with a 0.4 mm diameter yielded a crater radius of approximately 0.081 mm, which was used for coverage calculations.
3.3 Random Shot Peening Model
Because the actual shot peening process involves many shots randomly distributed in space and time, a random shot peening model was established using ABAQUS Python scripting. The shot centers were randomly generated using the random.uniform() function. The x and y coordinates were confined to the peened region, while the z coordinate was set above the target surface with a spacing increment to avoid overlap. Each shot was constrained to remain within the domain, and the condition between any two shots was:
\[
(x_i – x_n)^2 + (y_i – y_n)^2 + (z_i – z_n)^2 \geq 4r^2
\]
The shots were assigned the same diameter, material properties, and initial velocity. This one-stage random model simulates the saturation process of shot peening. For a target surface area \(S\) and crater radius \(r\), the coverage \(C\) after \(n\) shots is calculated according to the Avrami-type equation proposed by Kirk:
\[
C = \left(1 – e^{-\frac{n \pi r^2}{S}}\right) \times 100\%
\]
For \(r = 0.081\) mm and \(S = 1\) mm², the number of shots required for 98% coverage (considered as 100%) is approximately 190. Higher coverages are obtained by multiplying this number by 2, 3, or 4, corresponding to 200%, 300%, and 400% coverage, respectively. The relationship between the number of shots and coverage is shown in Figure 2 (not presented).
3.4 Two-Stage Shot Peening Model
To simulate secondary shot peening, the residual stress and displacement fields from the first peening simulation were imported as initial conditions into a new model using the predefined field option in ABAQUS. The second peening used different shot parameters (typically smaller diameter and lower velocity) to refine the surface and improve the residual stress profile.
The surface roughness after simulated peening was quantified by arithmetic average roughness \(Ra\) and peak-to-valley height \(R_{pv}\). The calculation of \(Ra\) uses the profile height function \(Z(x)\) over a sampling length \(l\):
\[
Ra = \frac{1}{l} \int_0^l |Z(x)| \, dx
\]
Discretized for finite element results:
\[
Ra = \frac{1}{n} \sum_{i=1}^{n} |Z(x_i)|
\]
and
\[
R_{pv} = R_p + R_v
\]
where \(R_p\) is the maximum peak height and \(R_v\) is the maximum valley depth over the evaluation area.
3.5 Extraction of Residual Stress and PEEQ
To obtain the depth profiles of residual stress (S11) and equivalent plastic strain (PEEQ), node sets were defined at every 0.02 mm depth below the peened surface, with each node set containing 2601 nodes (from a 51×51 grid). A Python script was written to read the field output at each node set and compute the average value. This provided smooth curves of residual stress and PEEQ as functions of depth.
4. Random Shot Peening Simulation and Experimental Verification
4.1 Effect of Shot Peening Velocity
Using a shot diameter of 0.4 mm, 100% coverage, and shot velocities of 40, 50, 60, 70, and 80 m/s, we analyzed the residual stress distributions. Figure 3 (not shown) illustrates the residual stress profiles. The surface residual stress (S11) increased from -636.22 MPa at 40 m/s to -709.72 MPa at 80 m/s. The maximum compressive residual stress also increased from -957.34 MPa to -1188.82 MPa, and its position shifted slightly deeper (from 0.06 mm to 0.08 mm). The depth of the compressive residual stress layer increased from 0.14 mm to 0.22 mm. Linear fitting of the surface residual stress and maximum residual stress with respect to velocity yielded:
\[
\sigma_{surf} = -563.84 + 1.794V
\]
\[
\sigma_{max} = -776.5 + 5.072V
\]
with coefficients of determination of 0.9905 and 0.9192, respectively.
The surface roughness values \(Ra\) corresponding to these velocities were 4.0, 4.6, 5.8, 7.1, and 8.4 μm, and \(R_{pv}\) values were 28.7, 35.3, 40.5, 51.1, and 53.5 μm. As velocity increases, the impact energy increases, producing deeper craters and more pronounced peaks and valleys. Linear fits gave:
\[
Ra = 0.8 + 0.113V
\]
\[
R_{pv} = 2.58 + 0.654V
\]
with \(R^2\) values of 0.9847 and 0.9745, respectively.
The PEEQ profiles also expanded with increasing velocity. The surface PEEQ grew from 0.47 at 40 m/s to 0.80 at 80 m/s, while the PEEQ-affected depth increased from 0.20 mm to 0.28 mm. Higher shot velocities therefore enhance the beneficial compressive residual stresses but degrade surface smoothness.
4.2 Effect of Shot Peening Coverage
With a fixed shot velocity of 80 m/s and diameter of 0.4 mm, the number of shots was set to 190, 380, 570, and 760 to represent 100%, 200%, 300%, and 400% coverage, respectively. The residual stress profiles in Figure 4 (not shown) revealed that the surface compressive residual stress increased from -709.7 MPa (100%) to -802.4 MPa (300%), but then dropped to -664.7 MPa at 400%. The maximum compressive residual stress increased from -1188.8 MPa to -1357.7 MPa at 300%, then decreased slightly to -1322.4 MPa at 400%. The depth of the compressive layer increased slightly from 0.22 mm to 0.24 mm when coverage exceeded 200%. This indicates that coverage beyond 300% does not further improve residual stresses and may even cause stress relaxation.
Surface roughness increased with coverage. \(Ra\) values were 8.4, 9.2, 11.4, and 13.1 μm for 100, 200, 300, and 400% coverage, respectively. \(R_{pv}\) increased from 53.5 to 110.6 μm. The linear relationships are:
\[
Ra = 6.45 + 0.0163N
\]
\[
R_{pv} = 37.2 + 0.1885N
\]
where \(N\) represents coverage percentage. The PEEQ values at the surface rose from 0.80 to 2.77 as coverage increased from 100% to 400%, and the PEEQ layer depth extended from 0.28 mm to 0.36 mm. Thus, increasing coverage strongly increases plastic deformation, but at the cost of higher surface roughness.
4.3 Effect of Shot Diameter
The shot diameter was varied from 0.4 mm to 0.8 mm under a constant velocity of 40 m/s and 100% coverage. The residual stress profiles (Figure 5, not shown) demonstrated that the surface compressive residual stress increased from -633.22 MPa (0.4 mm) to -872.07 MPa (0.7 mm), but decreased to -823.44 MPa at 0.8 mm. Similarly, the maximum compressive residual stress increased from -957.34 MPa to -1297.87 MPa, then dropped to -1190.3 MPa. The depth of the compressive layer increased monotonically from 0.14 mm to 0.28 mm, because larger shots penetrate deeper. The surface roughness also increased substantially with shot size: \(Ra\) went from 4.0 μm to 7.9 μm, and \(R_{pv}\) from 28.7 μm to 48.3 μm. Linear fits for roughness are:
\[
Ra = -0.21 \cdot d + 10.4
\]
\[
R_{pv} = -9.04 \cdot d + 48.7
\]
PEEQ at the surface increased slightly from 0.43 to 0.53 as the diameter increased to 0.7 mm, but fell to 0.48 at 0.8 mm. However, the PEEQ-affected depth grew from 0.2 mm to 0.38 mm. Hence, larger shots deepen the hardening layer but may worsen the surface and cause stress relaxation. A shot diameter around 0.6–0.7 mm appears optimal for balancing compressive stress and surface quality.
4.4 Effect of Second Shot Peening Velocity
For two-stage shot peening, the first peening was performed with 0.8 mm shots at 80 m/s and 100% coverage. The second peening used 0.4 mm shots at 100% coverage with velocities of 40, 60, 70, and 80 m/s. The resulting residual stress profiles (Figure 6, not shown) indicated that the surface compressive residual stress after first peening alone was -798.7 MPa, with a maximum of -1374.7 MPa at a depth of 0.14 mm and a compressive layer depth of 0.54 mm. Secondary peening increased the surface compressive stress to -851 MPa at 40 m/s and up to -969.2 MPa at 70 m/s, but at 80 m/s it dropped to -755.3 MPa. The maximum compressive stress followed a similar trend, peaking at -1453.7 MPa for a secondary velocity of 70 m/s. The depth of the compressive layer remained at 0.54 mm for all secondary velocities, indicating that the second peening only affects the near-surface layer. The surface roughness after secondary peening was lower than after primary peening. For primary peening, \(Ra\) was 18.4 μm. After secondary peening at 40 m/s, \(Ra\) decreased to 16.9 μm; at 60, 70, and 80 m/s, it was 17.6, 17.7, and 17.2 μm, respectively. Thus, a secondary peening with a lower velocity (40 m/s) can improve surface smoothness while maintaining a favorable residual stress state.
4.5 Experimental Verification
To validate the simulation results, we conducted shot peening experiments using the same gear hobbing machine to produce spur gear specimens. The hob speed was set to 275 r/min and the feed rate to 0.47 mm/r, which were identified as optimal from the hobbing experiments. Steel shots with a diameter of 0.4 mm were used at two air pressures: 0.2 MPa and 0.3 MPa, corresponding to approximate shot velocities of 40 m/s and 50 m/s, respectively, at a mass flow rate of 2 kg/min. The gear surfaces were fully covered. The initial surface roughness of the hobbing-machined gears was 0.289 μm with clear tool marks. After shot peening, the tool marks completely disappeared and were replaced by irregular craters and protuberances. The measured \(Ra\) values after peening at 40 m/s and 50 m/s were 4.238 μm and 4.486 μm, respectively, which are close to the simulated values of 4.0 μm and 4.6 μm. The three-dimensional surface topography obtained by the ultra-depth-of-field microscope was compared with the simulation result, confirming the validity of the finite element model. The slight discrepancies between simulation and experiment are primarily attributed to the assumption of an ideal flat surface in the model, whereas the actual gear surface has a finite initial roughness and complex geometry.
5. Conclusion
In this study, we conducted a combined experimental and numerical investigation on the surface integrity of spur gears made of 20CrMnTi steel, focusing on gear hobbing and subsequent shot peening. The main conclusions are as follows:
(1) In gear hobbing, the idle power increases with hob speed, while the additional cutting power increases with feed rate. The surface roughness of the machined spur gears improves with increasing hob speed and deteriorates with increasing feed rate. The optimal parameters from our experiments were 275 r/min and 0.47 mm/r, yielding a surface roughness of 0.392 μm. Work hardening was observed on all machined surfaces, with microhardness increasing with feed rate and initially with cutting speed.
(2) Finite element simulations in DEFORM accurately reproduced the chip formation process and showed that cutting force increases slightly with feed rate but is almost unaffected by hob speed. The equivalent stress is primarily determined by the material properties rather than cutting parameters. High-speed hobbing with low feed is recommended for both efficiency and surface quality.
(3) Single-shot and random shot peening simulations in ABAQUS revealed that increasing shot velocity increases the compressive residual stress and PEEQ depth but also increases surface roughness. Coverage up to 300% improves residual stress fields, while further coverage causes stress relaxation and higher roughness. The shot diameter has a complex effect: enlarging the shot diameter increases the compressive layer depth, but excessive size (above 0.7 mm) leads to lower peak residual stress and much higher roughness. Secondary shot peening with smaller shots at moderate velocities improves the near-surface residual stress and reduces surface roughness compared to single peening.
(4) Shot peening experiments on spur gears fabricated with the recommended hobbing parameters confirmed the simulation results. The measured surface roughness after peening at 40 m/s and 50 m/s agreed well with the predicted values, and the simulated surface morphology matched the observed craters and protrusions. The combined numerical and experimental approach provides a reliable basis for selecting hobbing and shot peening parameters to improve the surface quality and fatigue life of spur gears.