
Gear drives are fundamental components in many industrial applications, and their performance largely depends on the contact conditions between meshing teeth. At the microscopic level, the real contact between gear tooth surfaces occurs only at discrete asperities distributed over the nominal contact area. The deformation of these micro-asperities may be elastic, plastic, or elastic-plastic, depending on the applied load. In the present work, we develop a systematic study of the elastic-plastic contact behavior of rough surface asperities for spur gears. We first derive a continuous theoretical model for a single asperity under both frictionless (normal) and frictional (side) contact conditions. The model is validated against classical CEB and KE models and further verified by finite element (FE) simulations based on measured gear tooth surface parameters. Then we extend the analysis to multiple interacting asperities. Using an equivalent rough surface generated from measured topographic data, we construct a rigid plate–multiple asperity contact model in ABAQUS. Three cylindrical asperities with identical curvature radius are arranged in different configurations – different vertical offsets and different horizontal spacings – to investigate how these geometric parameters affect the von Mises stress distribution, relative deformation, and total real contact area. The results demonstrate strong interaction effects among asperities, especially when one asperity has a much higher peak. The total contact area increases almost linearly with asperity spacing within the studied range. These findings provide useful insights for the micro-contact analysis and friction modelling of spur gears.
1. Introduction
The tooth surface of a gear is never perfectly smooth; machining processes such as hobbing leave a roughness pattern that consists of many microscopic peaks and valleys. When two gear teeth come into contact, the real contact area is only a small fraction of the nominal area, and the local stresses at these micro-contacts can be extremely high. Therefore, understanding the elastic-plastic response of a single asperity and the interaction between neighboring asperities is essential for predicting friction, wear, scuffing, and pitting initiation in spur gears.
Since the pioneering work of Greenwood and Williamson (1966), many statistical contact models have been proposed to describe rough surface contact. Chang et al. (1987) developed the CEB model by considering plastic deformation of asperities. Kogut and Etsion (2002) proposed the KE model based on FE analysis of a deformable sphere against a rigid flat. Zhao et al. (2000) introduced the ZMC model that includes a transitional elastic-plastic regime. However, most of these models assume that asperities are isolated and do not interact with each other. In practice, when asperities are closely spaced, the stress field around one asperity affects its neighbors, modifying the contact area and load distribution.
For gear contact, the conditions are even more complex because the tooth surfaces undergo both normal and tangential loads. The tangential component indicates that asperities may contact not only at their tips but also on their flanks, i.e., side contact. In this paper, we address both normal and side contact for a single asperity in the context of spur gears. Then we perform detailed FE simulations for multi-asperity contacts to reveal the role of asperity spacing and height difference. This study provides a basis for building physically accurate friction models for spur gears.
2. Theoretical Model for a Single Asperity
2.1 Geometry and assumptions
We model each asperity as a smooth spherical cap (for three-dimensional analysis) or as a parabolic cylinder (for line contact analysis). For the single-asperity model, we assume that the asperity heights are small compared to their radii, so the parabolic approximation is valid. The two contacting tooth surfaces are represented by two asperities that may have different tip radii. When the surfaces are lubricated or separated by an adsorbed film, the tangential traction may be negligible, leading to frictionless normal contact. On the other hand, under boundary lubrication or dry contact, tangential forces exist and the contact orientation deviates from the normal direction; this is called side contact.
For normal contact, the geometry is shown in the left part of the classical Hertz problem: two parabolic bodies touch at their vertices, and the contact zone is circular. For side contact, one asperity is displaced relative to the other so that the contact point lies on the flank of each asperity; the contact area becomes elliptical. In both cases, we use the Hertz pressure distribution for the elastic part and a simplified elastic-plastic transition law.
2.2 Frictionless normal contact
Let two asperities have radius of curvature \(R_1\) and \(R_2\). The equivalent radius \(R\) is defined by:
\[
\frac{1}{R} = \frac{1}{R_1} + \frac{1}{R_2}
\]
The composite elastic modulus \(E_t\) is:
\[
\frac{1}{E_t} = \frac{1-\nu_1^2}{E_1} + \frac{1-\nu_2^2}{E_2}
\]
where \(E_i\) and \(\nu_i\) are the elastic modulus and Poisson’s ratio of the two contacting bodies. According to Hertz theory, when the normal load is \(F\), the contact radius \(r_a\) is:
\[
r_a = \left( \frac{3 F R}{4 E_t} \right)^{1/3}
\]
The approach (relative normal deformation) \(\delta\) is:
\[
\delta = \frac{a^2}{R} = \left( \frac{9 F^2}{16 R E_t^2} \right)^{1/3}
\]
The maximum contact pressure is:
\[
p_0 = \frac{3F}{2\pi r_a^2}
\]
When \(\delta\) exceeds a critical value \(\delta_c\), plastic yielding occurs. The critical approach is given by (Chang et al., 1987):
\[
\delta_c = \left( \frac{\pi k H}{2 E_t} \right)^2 R
\]
where \(k = 0.454 + 0.41\nu\), \(H\) is the hardness (often taken as \(2.8\sigma_y\) for metals, with \(\sigma_y\) the yield stress). For \(\delta < \delta_c\), the contact is purely elastic and the Hertz equations hold. For \(\delta > \delta_c\), we adopt the idea that the contact zone consists of an inner circular plastic region of radius \(r_p\) and an outer elastic annulus. The total load is the sum of the plastic core load and the elastic ring load:
\[
F = \frac{2}{3} E_t \sqrt{R} \left( r_p^2 (r_a^2 – r_p^2)^{1/2} + r_a^2 \sqrt{r_a^2 – r_p^2} \right)
\]
To avoid this complex equation, many existing models use empirical relations. Our proposed model ensures continuity of stress and deformation at the transition point, which is not guaranteed in the KE model. The details of the derivation are given in an earlier publication (Zhou et al., 2016).
For engineering applications, we also express the contact stress along the radius \(r\) as:
\[
\sigma(r) = p_0 \sqrt{1 – (r/r_a)^2}
\]
In the elastic-plastic regime, the pressure distribution is no longer perfectly Hertzian, but for simplicity we use a modified profile that matches the analytical solution.
2.3 Frictional side contact
When friction is present, the resultant force on each asperity is inclined with respect to the normal direction. The contact point moves up the side of one asperity and down the side of the other. This configuration is approximated by two parabolic surfaces whose axes are parallel but offset by a distance \(d_0\) and whose vertices are separated by \(y_0\) along the vertical direction. The contact normal \(n_0\) is not parallel to the common normal of the original surfaces, but is rotated by an angle \(\theta\) where
\[
\tan\theta = \frac{y_0}{d_0} = \mu
\]
with \(\mu\) being the average coefficient of friction. The equivalent radius of curvature in the plane of contact can be calculated from the geometry. For the side contact model, we define a local coordinate system and determine the contact radius using the same Hertz expression but with the equivalent radius \(R_0\) that accounts for the offset. The critical approach \(\delta_{cn}\) is then:
\[
\delta_{cn} = \left( \frac{\pi k H}{2 E_t} \right)^2 R_0
\]
where \(R_0\) is the equivalent radius in the normal direction. In the plane perpendicular to the contact normal, the curvature radii are different, leading to an elliptical contact zone. The pressure distribution is again given by an elliptical expression. Our model provides a continuous transition from elastic to elastic-plastic behavior, which is important for accurate prediction of friction and wear in spur gears.
2.4 Comparison with existing models
To validate our theoretical model, we compared the dimensionless load–deformation curves with those from the CEB and KE models. The dimensionless load \(F^* = F/F_c\) and approach \(\delta^* = \delta/\delta_c\) were used. For both the normal and side contact cases, our model agrees well with the KE model for \(\delta^* < 40\), and with the CEB model for small deformations. At large deformations, the CEB model overestimates the contact area because it assumes fully plastic behavior with a constant average pressure. Our model avoids this simplification and yields a smooth curve even at the transition point \(\delta^* = 6\), where the KE model has a slope discontinuity. These results confirm the applicability of the present model to the micro-contact analysis of gear tooth surfaces.
3. Finite Element Verification for Single Asperity
To further validate the theoretical model, we performed FE simulations using real measured surface parameters of a hobbed spur gear pair. The gear specifications are listed in the following table.
| Parameter | Value |
|---|---|
| Module (mm) | 6 |
| Number of teeth | 30 |
| Face width (mm) | 80 |
| Accuracy grade | 6 |
| Elastic modulus of gear material (GPa) | 206 |
| Poisson’s ratio | 0.3 |
| Yield strength (MPa) | 418 |
| Measured average asperity tip radius, \(R_1\) (μm) | 1.65 |
| Measured average asperity tip radius, \(R_2\) (μm) | 1.75 |
| Friction coefficient \(\mu\) (at single-tooth meshing) | 0.1 |
| Center offset \(d_0\) (μm) | 0.68 |
| Vertical separation \(y_0\) (μm) | 0.068 |
The asperities were modelled as spheres with the measured tip radii, and meshed with C3D8R elements. The bottom surface of the lower asperity was fully constrained, while a displacement load was applied to the upper surface of the top asperity. The applied displacement was incremented in steps of \(m\delta_c\), where \(m = 1, 2, 6, 7, 10\).
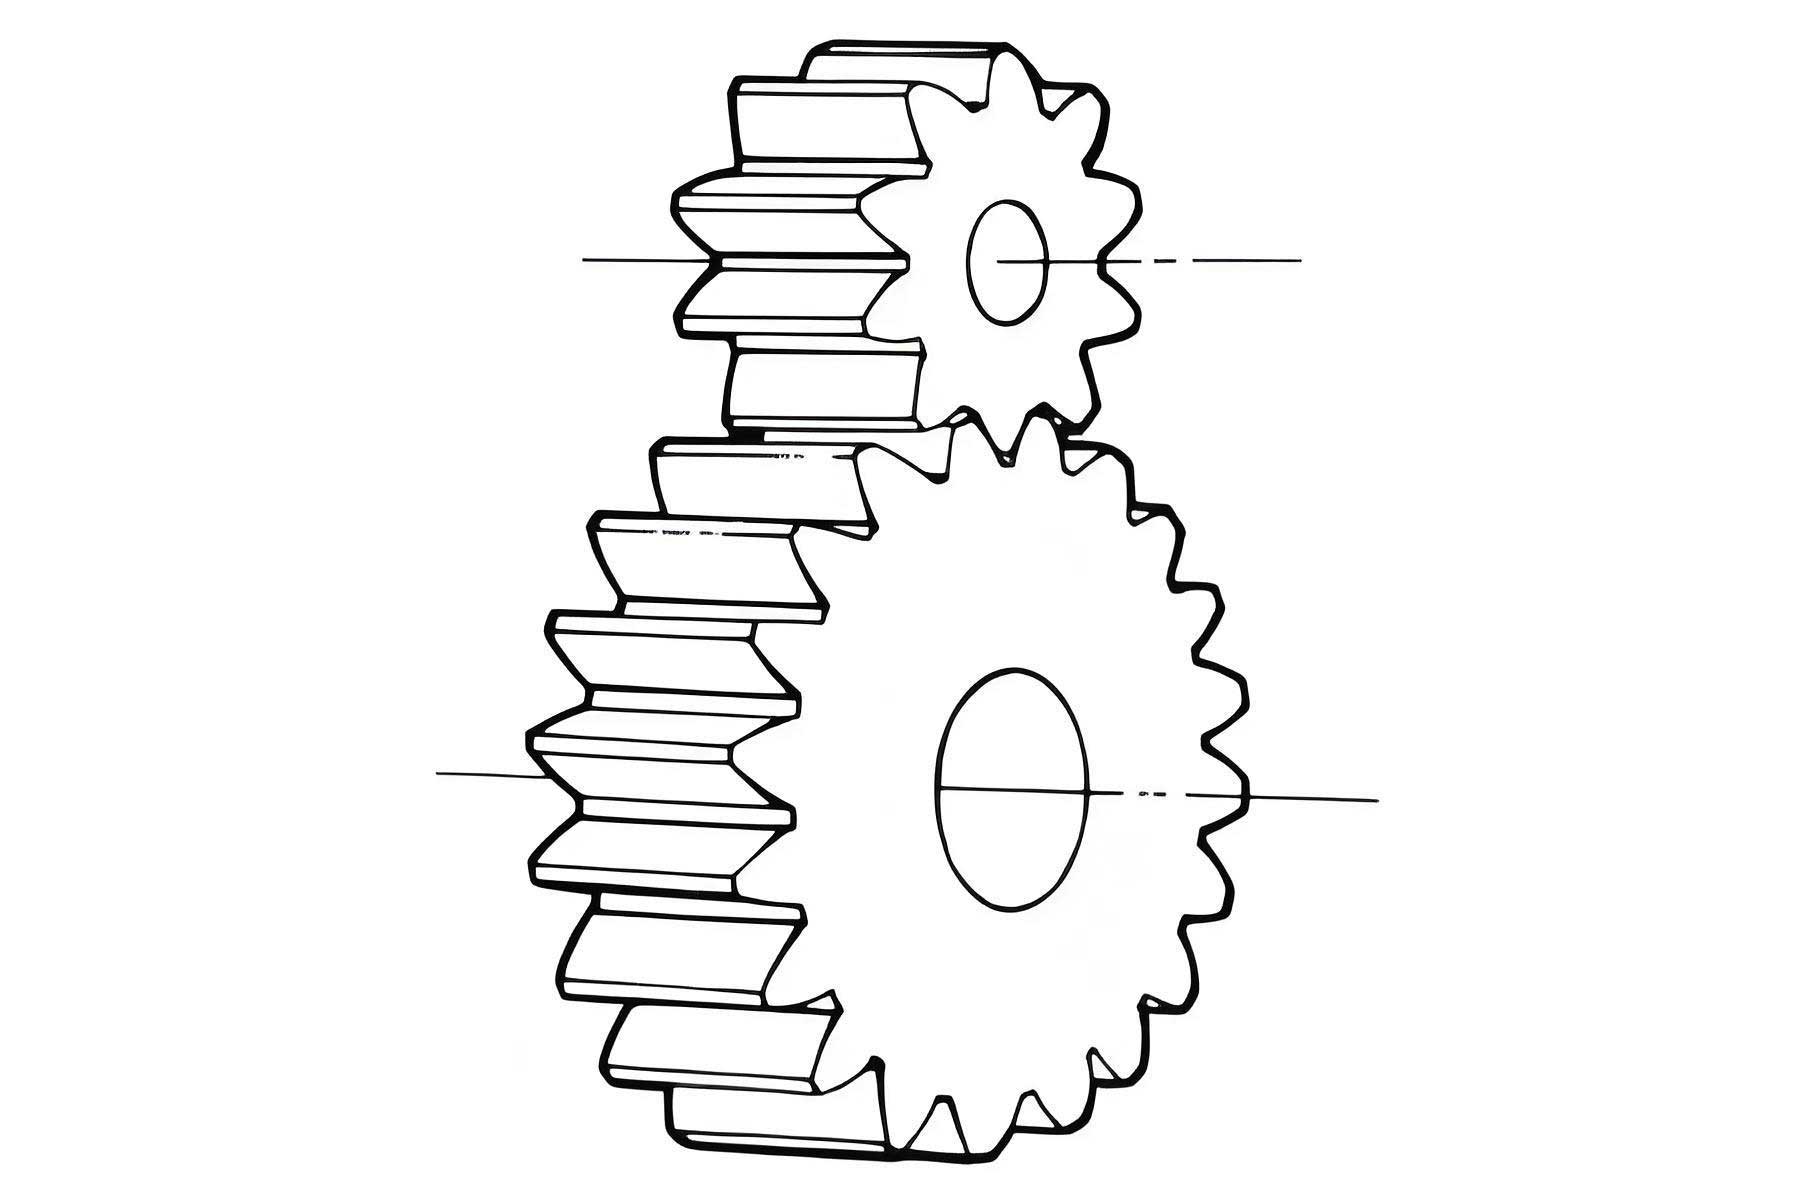
Figure below shows the micro-contact model used for the gear tooth surface in the FE simulation. It illustrates how the discrete asperity contact is represented in the analysis.
The von Mises stress distributions were extracted along the normal direction from the contact point. For both normal and side contact, the stress first increased to a maximum value and then decreased monotonically, indicating that plastic yielding initiates at a subsurface point. This finding supports our assumption that the plastic zone begins below the contact surface.
The contact pressure and contact radius were also computed and compared between the theoretical model and FE model. For normal contact, the pressure–radius curve closely follows a quarter circle; for side contact, it resembles a quarter ellipse. The FE results agrees well with the theoretical predictions, especially for the side contact case, where the error is within a few percent. This confirms that the proposed continuous elastic-plastic asperity contact model is a reliable tool for micro-contact analysis of spur gears.
4. Multi-Asperity Contact Modeling
4.1 Construction of rough gear tooth surfaces
Real gear tooth surface topography was measured using a white-light interferometer. The measured point cloud data were processed with CATIA to construct a three-dimensional surface model. The measured surface had a wavy appearance, typical of hobbed gears. Because a full three-dimensional rough surface contact simulation would be computationally expensive and prone to convergence difficulties, we simplified the contact to an equivalent rough surface in contact with a rigid flat plane. This simplification is valid for conformal contacts like gear teeth, where the relative curvature is much larger than the roughness wavelength. The equivalent gap between the two surfaces is defined as the sum of the heights of the upper and lower surfaces above the mean planes, effectively combining their roughness into a single equivalent surface profile.
In the present multi-asperity analysis, we further simplified the rough surface into a series of independent parabolic cylinder asperities, as illustrated in the context of the original rough surface. We selected three identical cylindrical asperities with the same radius of curvature \(R_m = 6.6\,\mu m\), which is a representative value obtained from the measured surface. The asperities were placed on a common base, with controlled horizontal spacing \(d_m\) and vertical peak offset \(h_m\). Four arrangements were considered:
- Type L-L-H: left and middle asperities are low, right asperity is high;
- Type L-H-L: middle asperity is high, left and right are low;
- Type L-H-H: left is low, middle and right are high;
- Type H-L-H: left and right are high, middle is low.
Here, “low” means the peak height is \(\delta_m, 2\delta_m\) or \(3\delta_m\) below the highest asperity. The critical deformation \(\delta_m\) for a cylindrical asperity in contact with a rigid flat is given by the following relation based on the work of Green (2005):
\[
\delta_m = \frac{2 R_m \sigma_y}{E_t} C\left( \ln\left( \frac{2 E_t}{C \sigma_y} \right) – 1 \right)
\]
where \(C = (1 + 4\nu) / (1 – 4\nu)\) for \(\nu \le 0.1938\), otherwise \(C = 1.64 + 2.16\nu – 2.97\nu^2 + 0.29\nu^3\). For our material, \(\nu=0.3\), hence \(C = 1.64 + 2.16(0.3) – 2.97(0.09) + 0.29(0.027) \approx 1.643\). Using \(E_t = 206 \, \text{GPa}\), \(\sigma_y = 418 \, \text{MPa}\), and \(R_m=6.6\,\mu m\), we obtain \(\delta_m \approx 3.66 \times 10^{-4} \, \mu m = 0.366 \, \text{nm}\). This value is extremely small, so we use \(\delta_m\) as a unit for the applied displacement.
4.2 Rigid plate – single cylinder contact
For a single cylindrical asperity of radius \(R_m\) and length \(L\) pressed against a rigid flat, the elastic contact half-width \(b\) is:
\[
b = \sqrt{\frac{4 F R_m}{\pi L E_t}}
\]
where \(F\) is the normal load. The elastic approach is:
\[
\delta = \frac{F}{\pi L E_t} \left( 1 – \ln \left(\frac{4 F R_m}{L E_t \pi}\right) \right)
\]
These relations are used to compare with the multi-asperity FE results. In our FE models, the plate was rigid and the asperities were deformable with the material properties given earlier. The load was applied by displacing the rigid plate downward by \(6\delta_m\) in staged steps.
4.3 Finite element models for three asperities
Using ABAQUS, we built three-dimensional FE models of three cylindrical asperities with parabolic cross-sections. The asperities were aligned in a row, with equal spacing between neighboring asperities. The spacing took values of 0.25, 0.5, 0.75, 1.0, 1.25, 1.5, and 2.0 μm. For each spacing, the four height arrangements listed earlier were considered. In addition, the case where all three asperities have the same height (offset = 0) was analyzed for different spacings to isolate the spacing effect.
The mesh was refined near the contact zone. A convergence study was performed to determine an appropriate mesh density. We selected the L-H-H arrangement with \(d_m=1\,\mu m\) and \(h_m=3\delta_m\) for the convergence check. Different mesh sizes were tested; the maximum mesh size in the contact region varied from 0.04 μm to 0.001 μm. The table below shows the effect of mesh density on the maximum von Mises stress and the total contact area.
| Mesh ID | Max element size (μm) | Min element size (μm) | Max von Mises stress (MPa) | Total contact area (μm²) |
|---|---|---|---|---|
| 1 | 1 | 0.04 | 438.4 | 1.07125 |
| 2 | 1 | 0.03 | 441.7 | 1.11151 |
| 3 | 1 | 0.02 | 442.1 | 1.11026 |
| 4 | 1 | 0.01 | 441.1 | 1.06990 |
| 5 | 0.5 | 0.04 | 439.8 | 1.04353 |
| 6 | 0.5 | 0.03 | 440.5 | 1.08846 |
| 7 | 0.5 | 0.01 | 441.1 | 1.05687 |
| 8 | 0.5 | 0.008 | 440.8 | 1.05443 |
| 9 | 0.5 | 0.004 | 440.9 | 1.05222 |
| 10 | 0.5 | 0.001 | 477.4 | 1.03062 |
It was found that using a minimum element size of 0.01 μm gives a converged stress and area with reasonable computational cost. This mesh setting was adopted for all subsequent simulations.
5. Results and Discussion of Multi-Asperity Contact
5.1 Von Mises stress on the contact surface
For the four arrangements with fixed spacing \(d_m=0.5\,\mu m\), we extracted von Mises stresses along the contact surface. The horizontal coordinate “distance along contact surface” covers all three asperities. For the L-L-H arrangement (left and middle low, right high), the maximum stress on the left and middle asperities decreases as the height offset \(h_m\) increases from \(\delta_m\) to \(3\delta_m\), while the right high asperity maintains almost the same maximum stress. At \(h_m=3\delta_m\), the middle asperity’s stress is significantly lower than the right one. This indicates that a high neighboring asperity carries a larger share of the load, reducing stress on the lower ones.
For the L-H-L arrangement (middle high), the middle asperity’s stress remains almost independent of \(h_m\), while the two low side asperities experience reduced stress with increasing \(h_m\). The stress distribution is symmetric. For L-H-H, the middle and right high asperities are unaffected, but the left low asperity’s stress drops drastically. For H-L-H (side high, middle low), the middle low asperity’s stress decreases rapidly with \(h_m\), until at \(h_m=3\delta_m\) it almost does not contact the plate. The following table summarizes the maximum von Mises stress on each asperity for all arrangements.
| Arrangement | \(h_m\) | L (MPa) | M (MPa) | R (MPa) |
|---|---|---|---|---|
| L-L-H | \(\delta_m\) | 419.0 | 418.5 | 420.1 |
| \(2\delta_m\) | 398.9 | 375.4 | 423.0 | |
| \(3\delta_m\) | 346.0 | 249.0 | 420.3 | |
| L-H-L | \(\delta_m\) | 419.0 | 420.3 | 418.7 |
| \(2\delta_m\) | 394.0 | 421.0 | 393.7 | |
| \(3\delta_m\) | 304.0 | 420.7 | 304.5 | |
| L-H-H | \(\delta_m\) | 418.0 | 420.5 | 420.5 |
| \(2\delta_m\) | 370.3 | 421.1 | 421.1 | |
| \(3\delta_m\) | 225.0 | 421.3 | 421.3 | |
| H-L-H | \(\delta_m\) | 420.0 | 418.3 | 420.0 |
| \(2\delta_m\) | 422.0 | 297.3 | 422.0 | |
| \(3\delta_m\) | 421.0 | 104.2 | 421.2 |
The table clearly reveals the interaction effect: the presence of a high asperity reduces the load on a neighboring low asperity. This is because the rigid plate comes into contact first with the highest asperity, and the resulting deformation field produces a gap between the plate and the lower asperities.
5.2 Effect of asperity spacing
When all three asperities have the same height (\(h_m=0\)), the von Mises stress distributions for different spacings are shown in the corresponding figures. The overall peak stress changes little with spacing, but the distribution becomes wider as the spacing increases. The stress at the midpoint between neighboring asperities decreases quasi-linearly with spacing. For example, at \(d_m=0.25\,\mu m\), the midpoint stress is about 152 MPa; at \(d_m=2\,\mu m\), it drops to about 34 MPa. This indicates that closely spaced asperities interact strongly, increasing the stress in the valley region.
The von Mises stress along the normal direction (down from the contact point of the middle asperity) was also analyzed. For spacings larger than 0.25 μm, the stress profile shows a single maximum near the surface, followed by a rapid decay and then a gradual decrease. With increasing spacing, the location of the “knee” point moves farther from the contact surface and the corresponding stress value decreases. The table below lists the knee point positions and stresses for different spacings.
| Spacing \(d_m\) (μm) | Distance to contact point (μm) | von Mises stress at knee point (MPa) |
|---|---|---|
| 0.25 | 0.1933 | 321.1 |
| 0.50 | 0.2964 | 251.7 |
| 0.75 | 0.3851 | 214.0 |
| 1.00 | 0.4710 | 190.6 |
| 1.25 | 0.6282 | 156.3 |
| 1.50 | 0.7928 | 133.4 |
| 2.00 | 0.9949 | 114.7 |
These results suggest that when asperities are far apart, each one behaves almost independently, and the stress field beneath the middle asperity resembles that of a single asperity. As the spacing decreases, the stress field from neighboring asperities superimposes, leading to a more complex distribution.
5.3 Relative deformation on the contact surface
The relative deformation (normal displacement) along the contact surface was extracted for various arrangements and spacings. For the four height-offset cases, the deformation of the highest asperity is always constant for a given applied displacement. The lower asperities deform less as their height offset increases. For the L-H-L and L-H-H arrangements, the deformation difference between different offsets follows the same trend as the stress. Specifically, the relative deformation of the middle or right high asperity remains unchanged, while the low ones show a clear decrease.
When the three asperities have the same height, the deformation distributions are symmetric. For a fixed applied displacement of \(6\delta_m\), the maximum deformation at each contact point is \(3.478\,nm\). With increasing spacing, the deformation profile widens, and the deformation in the valley between asperities decreases. At the midpoint between two neighboring asperities, the relative deformation drops from about \(1.5\,nm\) at \(d_m=0.25\,\mu m\) to about \(0.5\,nm\) at \(d_m=2\,\mu m\). This indicates weaker interaction for larger spacing.
5.4 Total contact area
The total real contact area is a critical quantity for friction and wear. We computed the sum of the contact areas of the three asperities for each configuration. For a fixed spacing of \(0.5\,\mu m\), the total contact area decreases as the height offset increases, as shown in the next table.
| Arrangement | \(\delta_m\) | \(2\delta_m\) | \(3\delta_m\) | Gain \(\delta_m \to 2\delta_m\) (%) | Gain \(2\delta_m \to 3\delta_m\) (%) |
|---|---|---|---|---|---|
| L-L-H | 0.9496 | 0.8941 | 0.7580 | -5.84 | -15.22 |
| L-H-L | 0.9902 | 0.8881 | 0.7542 | -10.31 | -15.08 |
| L-H-H | 1.0254 | 0.9767 | 0.9057 | -3.89 | -7.27 |
| H-L-H | 1.0142 | 0.9668 | 0.7854 | -4.68 | -18.77 |
The L-H-L arrangement shows the largest drop from \(\delta_m\) to \(2\delta_m\), while L-H-H shows the smallest overall reduction. This demonstrates that the spatial arrangement of high and low asperities significantly affects the total contact area. When there are two high asperities separated by a low one, the low one barely contributes, but the two high ones still dominate the contact, so the area reduction is limited.
For the case where all three asperities have equal height, the total contact area was calculated for different spacings, as listed below.
| Spacing \(d_m\) (μm) | 0 | 0.25 | 0.5 | 0.75 | 1.0 | 1.25 | 1.5 | 2.0 |
|---|---|---|---|---|---|---|---|---|
| Total area (μm²) | 0.51333 | 0.92380 | 1.0301 | 1.1845 | 1.2241 | 1.2524 | 1.2919 | 1.3755 |
When the spacing is \(0\), the three asperities coincide, so the total area equals that of a single asperity, \(0.51333\,\mu m^2\). As the spacing increases, the interaction between asperities weakens and each asperity develops a contact area closer to that of an isolated asperity. The total area gradually approaches three times the single-asperity area, \(1.54\,\mu m^2\). In the intermediate range from \(0.25\) to \(2\,\mu m\), the total contact area increases almost linearly with spacing. This linear trend is useful for estimating contact area in statistical contact models of spur gears.
6. Conclusions
We have presented a comprehensive investigation of elastic-plastic contact of rough surface asperities on spur gears. The single-asperity contact model, applicable to both normal frictionless contact and frictional side contact, yields results that agree well with the established CEB and KE models and, more importantly, provides a continuous stress–deformation relationship. The FE simulations confirmed the theoretical predictions and validated the assumption that plasticity first occurs below the contact surface. Extending the analysis to multiple asperities, we have systematically examined the effects of asperity spacing and peak-height differences. The main findings are:
- For the same spacing, a higher neighboring asperity always reduces the load and stress on adjacent lower asperities. The effect increases with the height offset from \(\delta_m\) to \(3\delta_m\).
- When all asperities have the same height, the total real contact area increases with spacing and asymptotically approaches the sum of individual isolated asperity contacts. Between 0.25 and 2 μm, the area–spacing relationship is nearly linear.
- The von Mises stress at the mid-point between two asperities decreases almost linearly as the spacing increases, indicating weaker interaction.
- Closely spaced asperities produce a more uniform deformation and lower maximum stresses in the valley regions, which may affect the distribution of plastic strain and wear.
These conclusions provide a useful framework for developing scale-dependent friction and wear models for spur gears and other mechanical components with rough surfaces. Future work will extend the current deterministic model to a statistical population of asperities with random heights and spacings, and will incorporate the calculated micro-contact parameters into a macro-level gear contact simulation.